Fitness Effects vs Conservation -- Quantitative Analysis
CompletedResearch Question
Is there a continuous gradient from essential genes (core) to dispensable genes (accessory) across the full fitness spectrum, and what does the fitness landscape of novel genes look like?
Research Plan
Hypothesis
The companion project (conservation_vs_fitness) showed that essential genes are modestly enriched in core clusters (OR=1.56). But essentiality is binary. This project asks the quantitative question: across the full spectrum from essential to neutral to burden, how does fitness importance relate to gene conservation? We expect a continuous gradient, but the shape and magnitude are unknown.
Approach
- Extract per-gene fitness statistics from 194,216 protein-coding genes across 43 organisms, including both fitness scores (from
genefitness) and essential gene status (genes with no transposon insertions) - Fitness magnitude vs conservation -- bin genes from essential through strong/moderate/weak effects to neutral, compare % core across the spectrum
- Positive fitness effects -- test whether auxiliary/singleton genes are more likely to be burdens (mutant grows better = gene is costly)
- Fitness breadth vs conservation -- are genes important in many conditions more likely core?
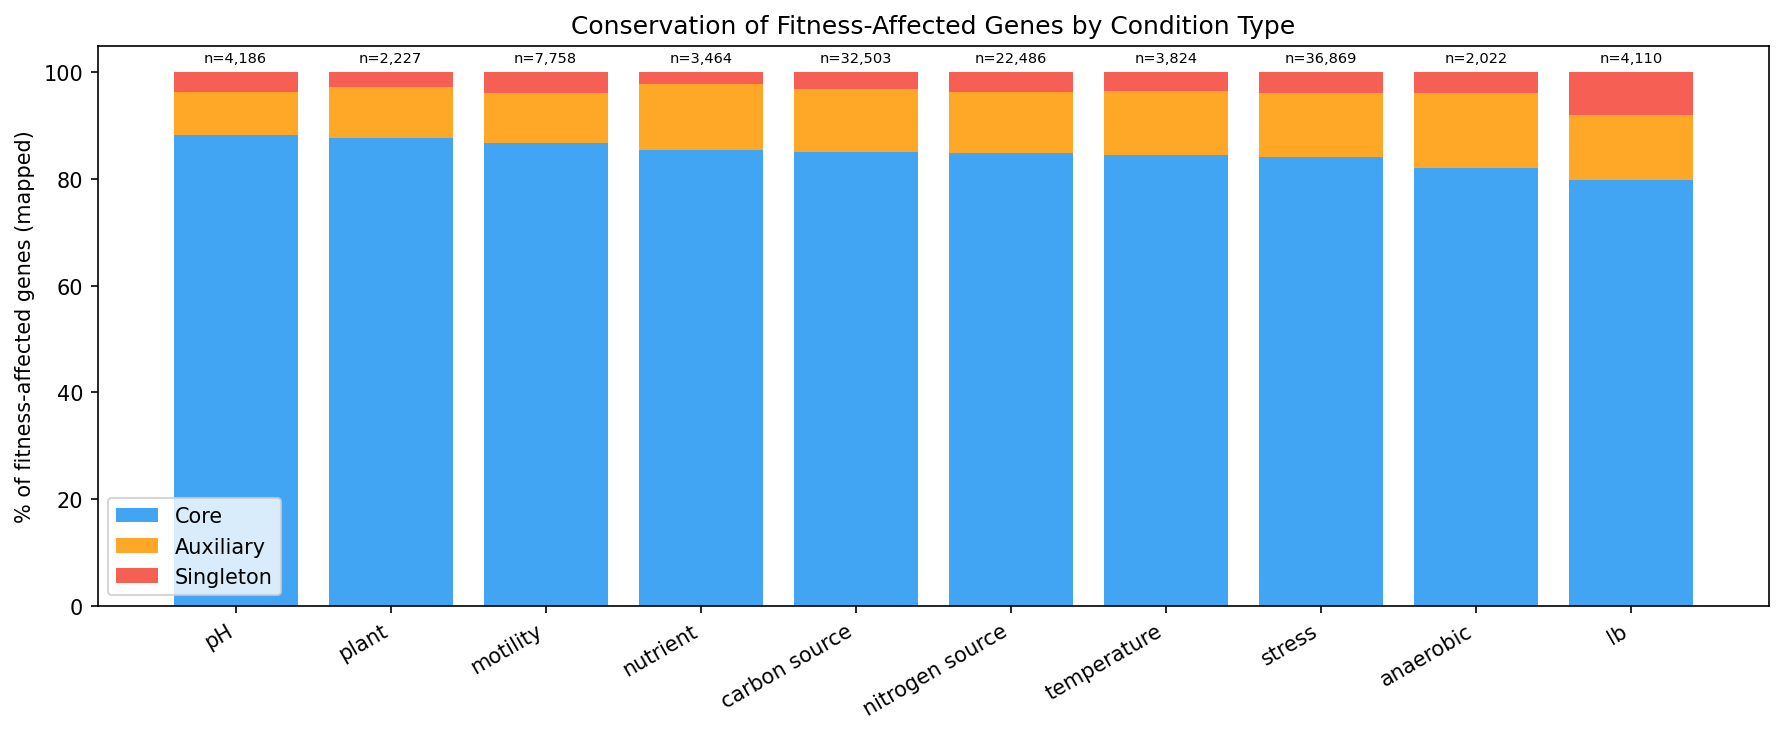
- Condition type analysis -- do stress, carbon source, and nitrogen source conditions reveal different conservation patterns?
- Novel gene fitness landscape -- are singleton genes generally detrimental, neutral, or ephemeral (neutral except in one condition)?
Revision History
- v1 (2026-02): Migrated from README.md
Overview
This project moves beyond the binary essential/non-essential classification to ask quantitative questions about how fitness importance relates to pangenome conservation. It reveals a clear gradient from essential genes (82% core) to always-neutral genes (66% core), shows that fitness breadth predicts conservation, and finds that core genes are MORE likely to be burdens and have condition-specific effects -- suggesting they are the most functionally active part of the genome.
Key Findings
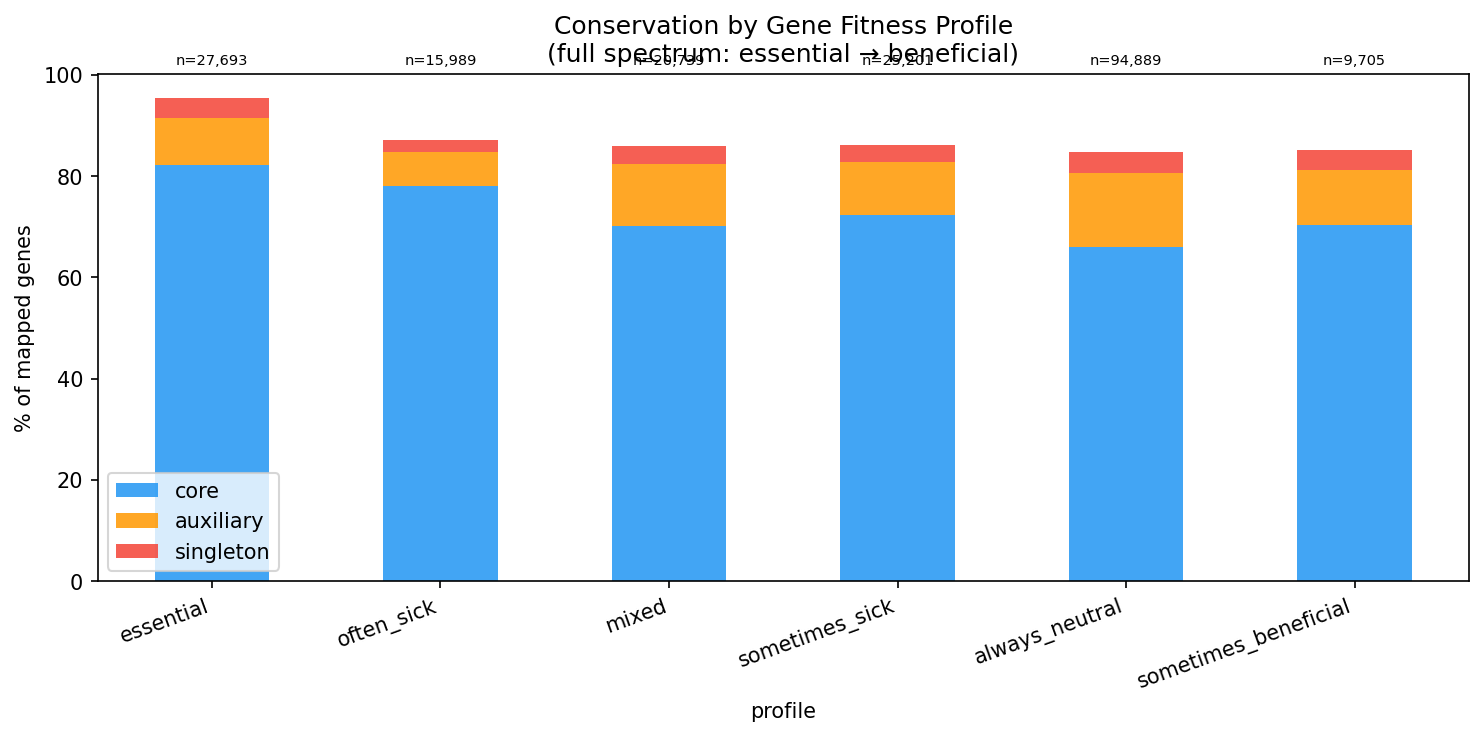
Conservation Increases with Fitness Importance
A clear gradient from essential to neutral genes:
| Fitness category | n genes | % Core |
|---|---|---|
| Essential (no viable mutants) | 27,693 | 82% |
| Often sick (>10% experiments) | 15,989 | 78% |
| Mixed (sick + beneficial) | 20,739 | 70% |
| Sometimes sick | 25,201 | 72% |
| Always neutral | 94,889 | 66% |
| Sometimes beneficial | 9,705 | 70% |
The same gradient holds when binning by strongest fitness effect: essential -> 82.2% core, min_fit < -3 -> 77.7%, min_fit -1 to 0 -> 66.4%.
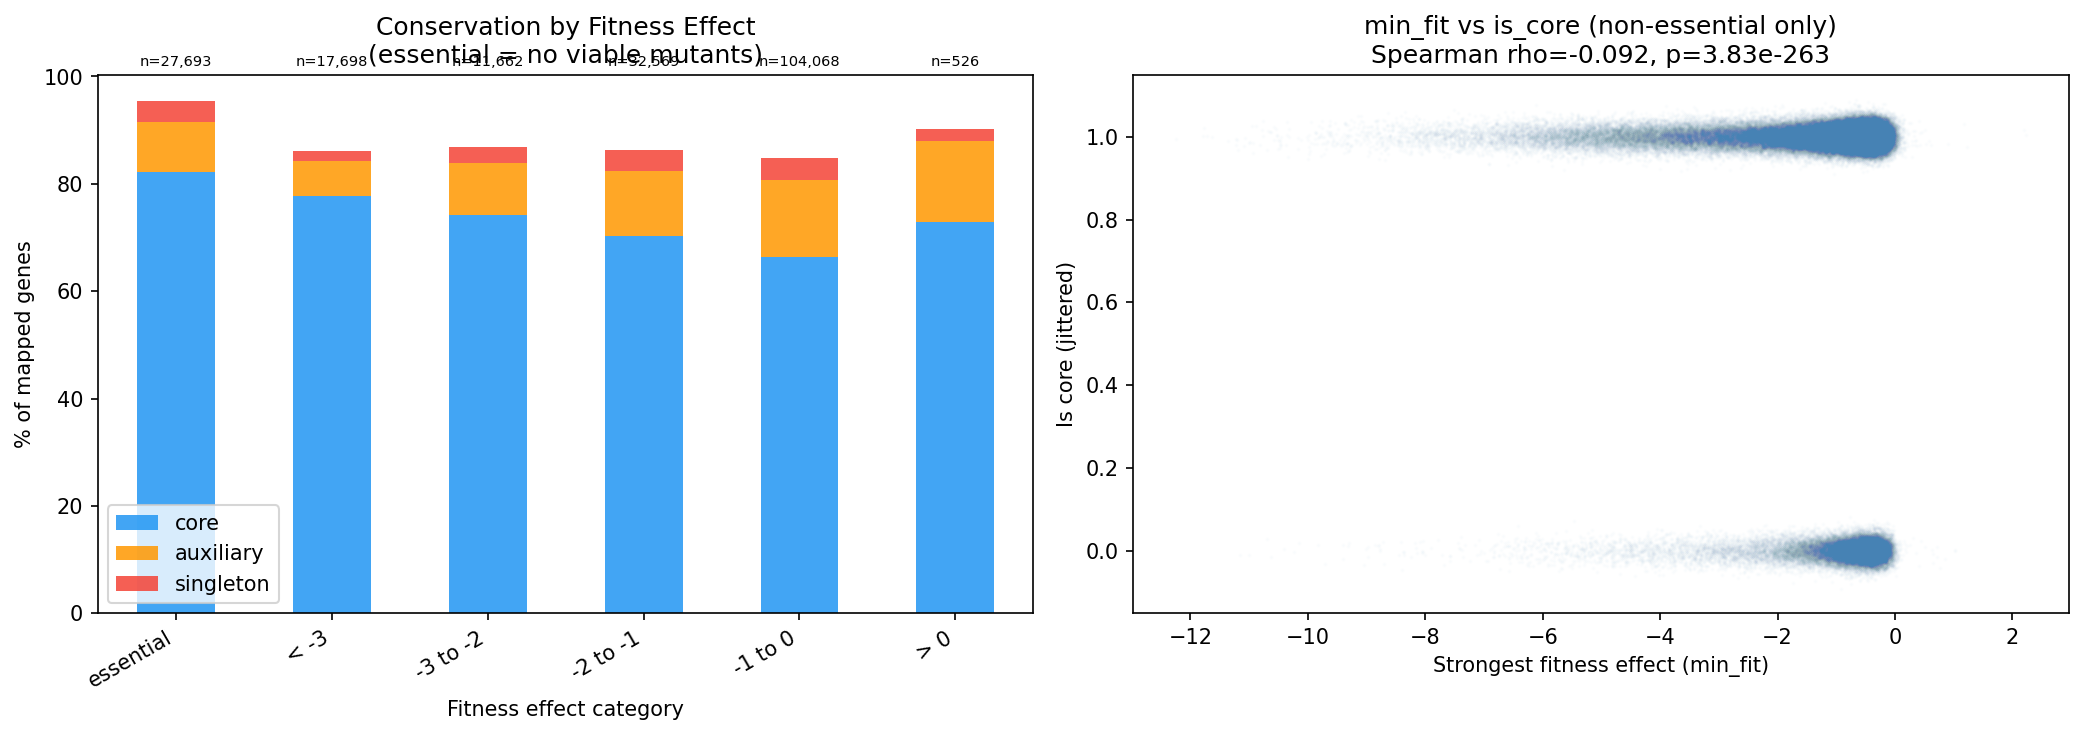
(Notebook: 02_fitness_vs_conservation.ipynb)
Breadth of Fitness Effects Predicts Conservation
Genes important in more conditions are more likely core (Spearman rho=0.086, p=8.1e-230):
| Breadth | % Core |
|---|---|
| Essential | 82% |
| 20+ experiments | 79% |
| 6-20 experiments | 73% |
| 1-5 experiments | 71% |
| 0 experiments | 66% |
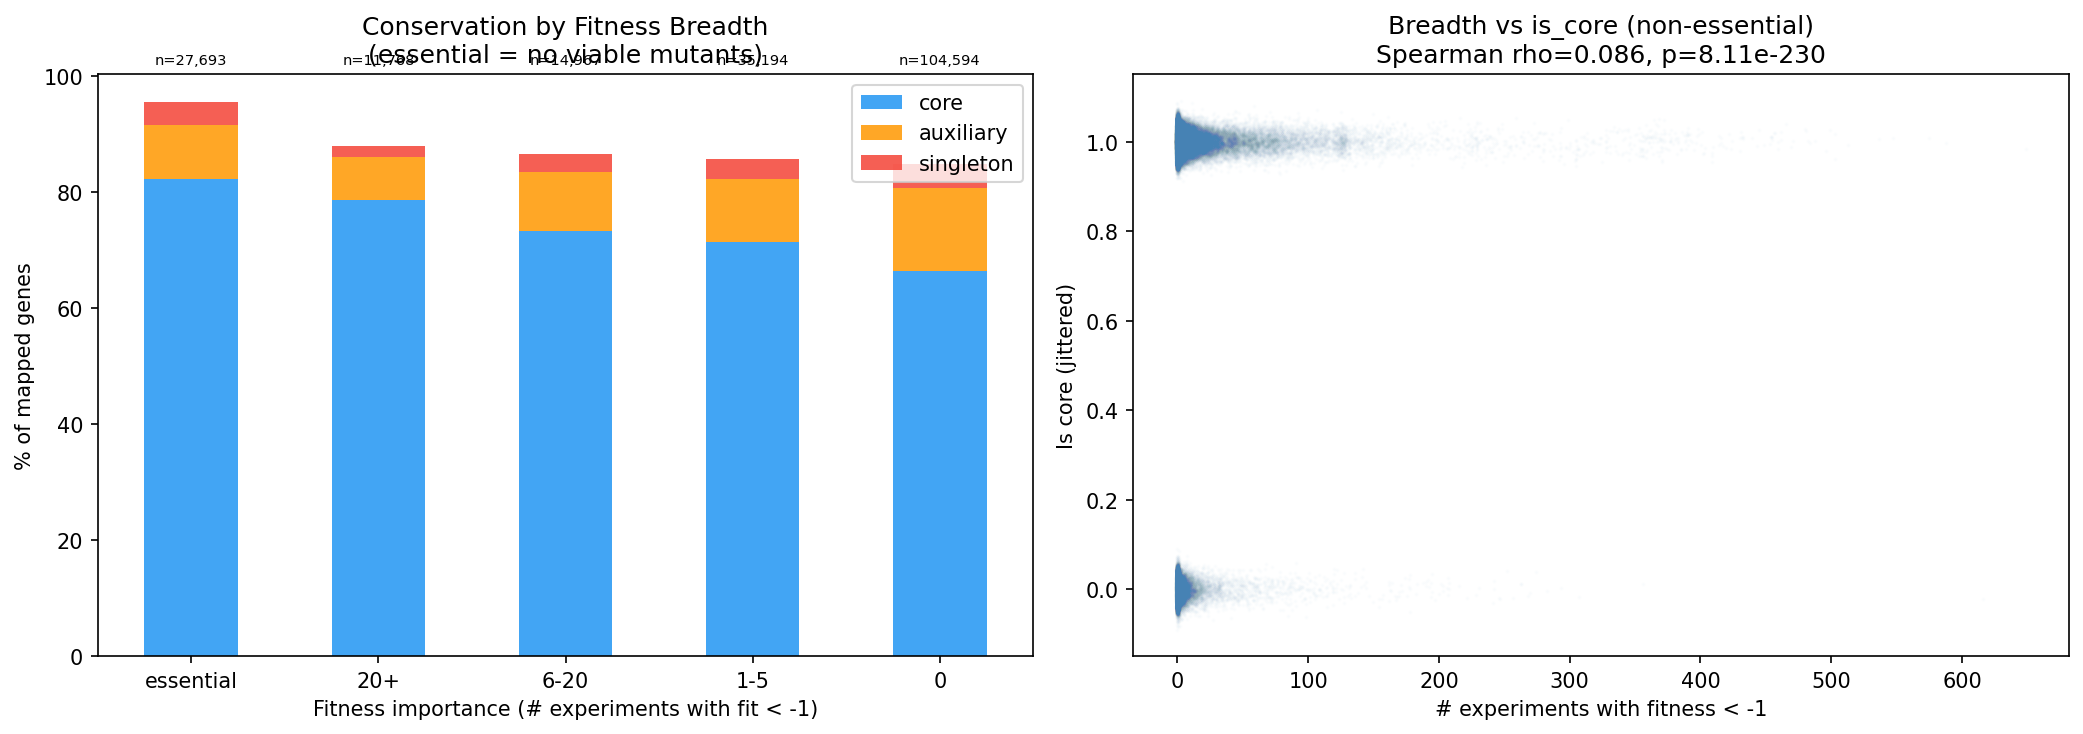
(Notebook: 03_breadth_vs_conservation.ipynb)
Core Genes Are Not Burdens -- They're More Likely Beneficial
Counter to the expectation that accessory genes might be costly to carry, core genes are MORE likely to show positive fitness effects when deleted (24.4% ever beneficial vs 19.9% for auxiliary, OR=0.77 for auxiliary vs core). This may reflect that core genes are more likely to participate in trade-off situations -- they help in some conditions but cost in others.
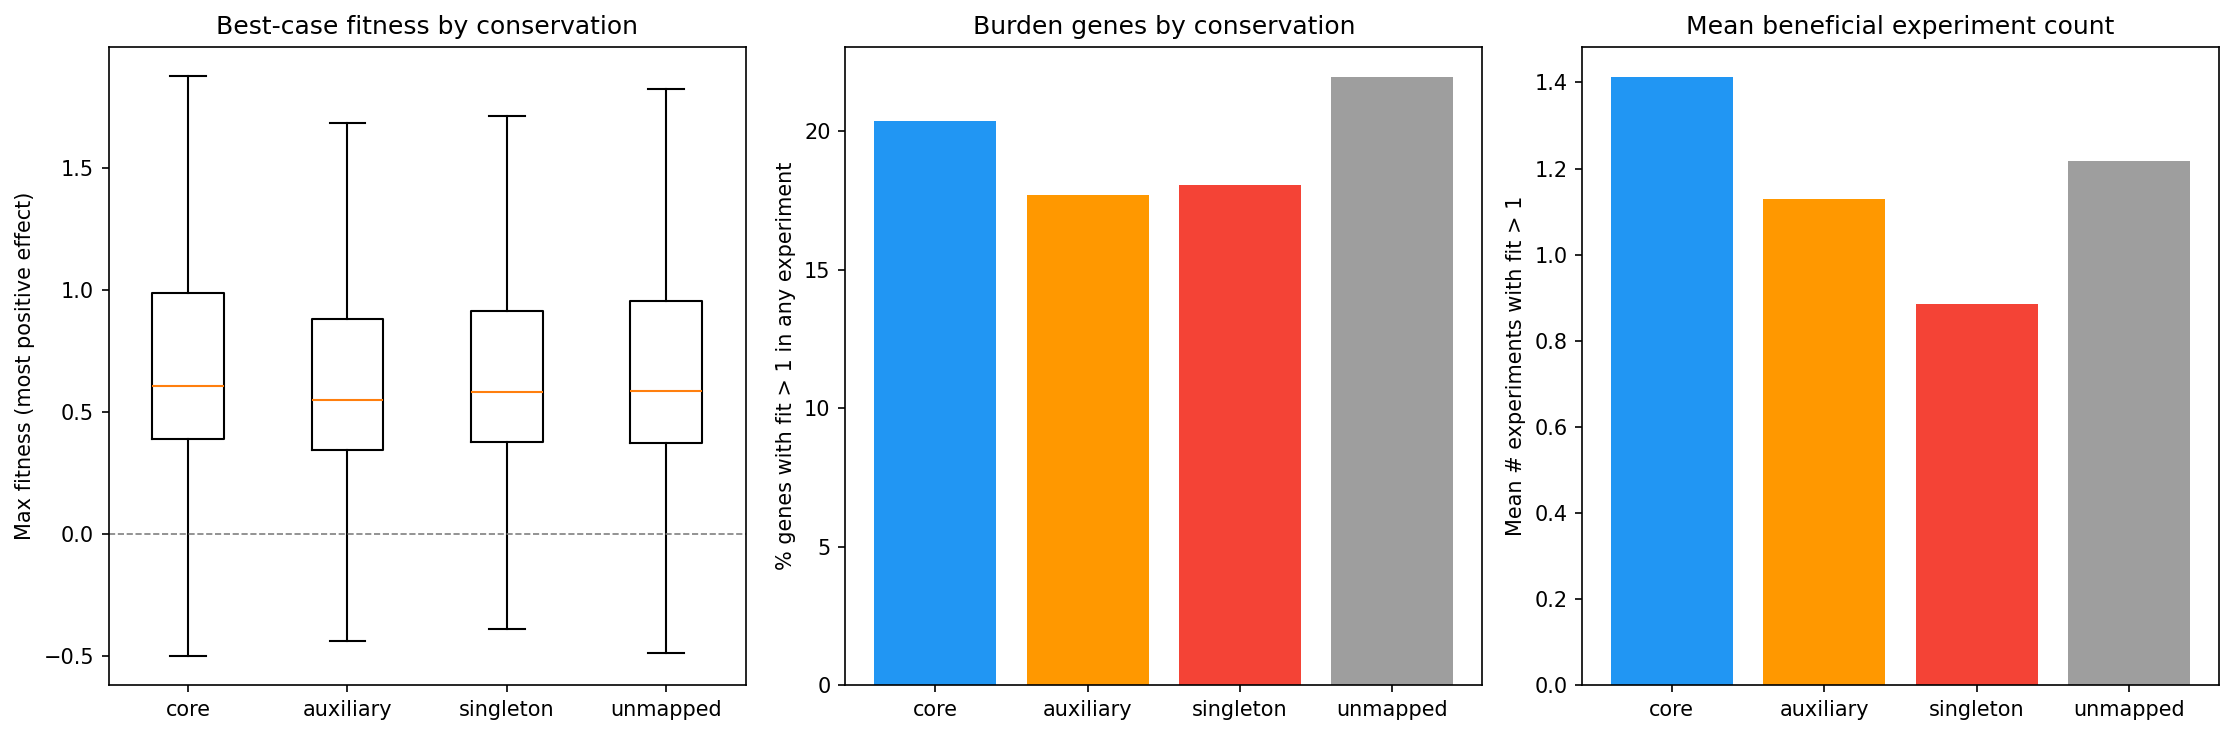
(Notebook: 02_fitness_vs_conservation.ipynb)
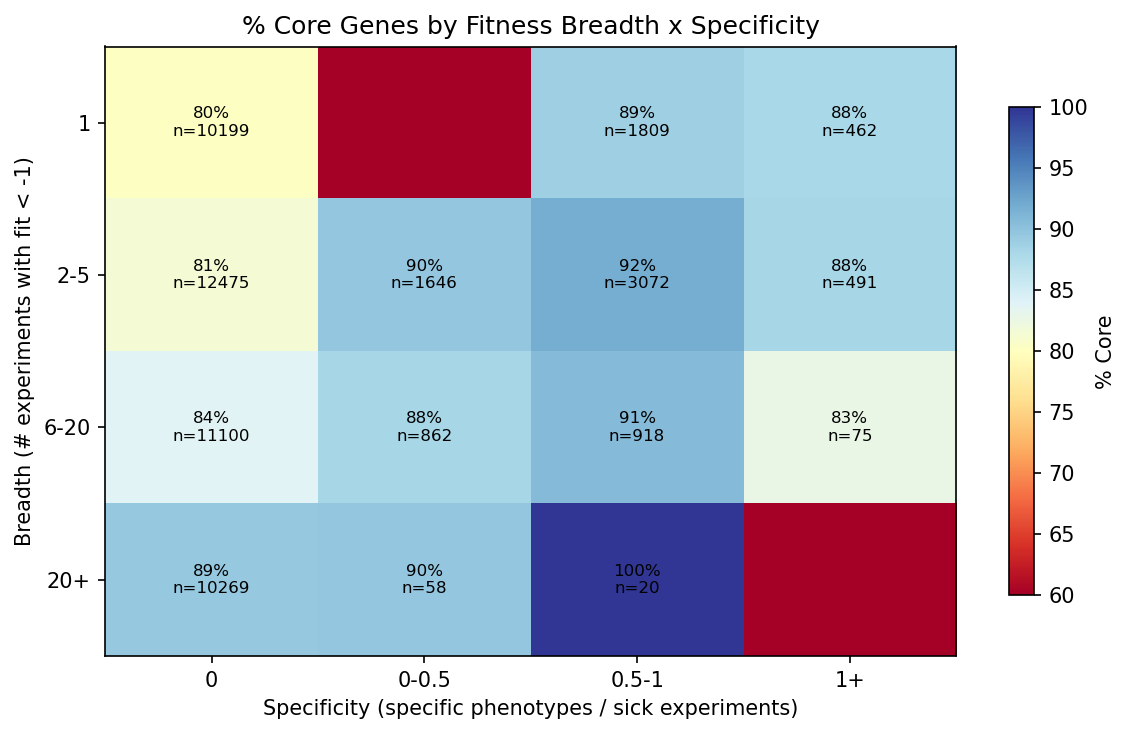
Specific-Phenotype Genes Are More Likely Core
Genes with strong condition-specific effects (tagged in specificphenotype) are 77.3% core vs 70.3% for genes without specific phenotypes (OR=1.78, p=1.8e-97). This contradicts the naive expectation that condition-specific genes would be accessory. Instead, it suggests that core genes are more likely to have measurable condition-specific effects -- perhaps because they participate in well-characterized pathways.
(Notebook: 03_breadth_vs_conservation.ipynb)
Ephemeral Niche Genes
4,450 genes (2.7%) fit the "ephemeral niche gene" pattern: neutral overall but critical in one condition. Surprisingly, these are MORE common in core genes (3.0%) than auxiliary (1.7%) or singleton (1.6%). Core genes may simply have more detectable conditional effects because they participate in more pathways.
Fitness Distributions by Conservation
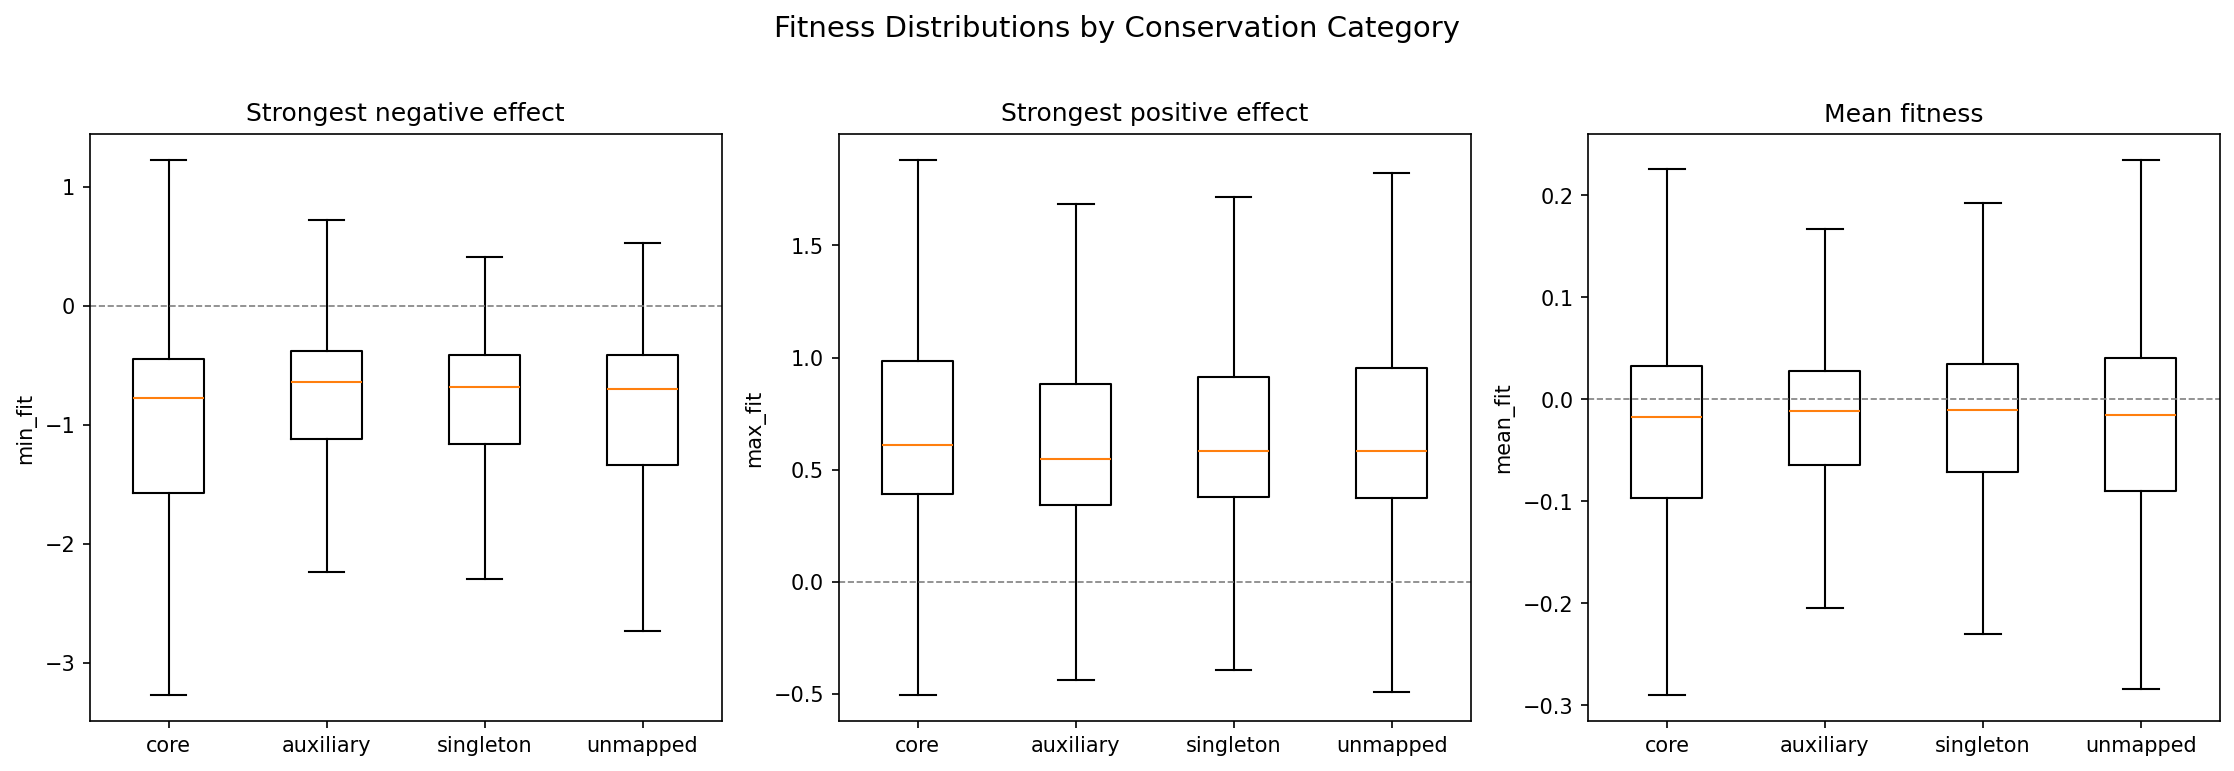
Core and auxiliary genes show distinct fitness effect distributions, with core genes having heavier tails in both the negative (important) and positive (burdensome) directions.
(Notebook: 02_fitness_vs_conservation.ipynb)
Novel Gene Landscape
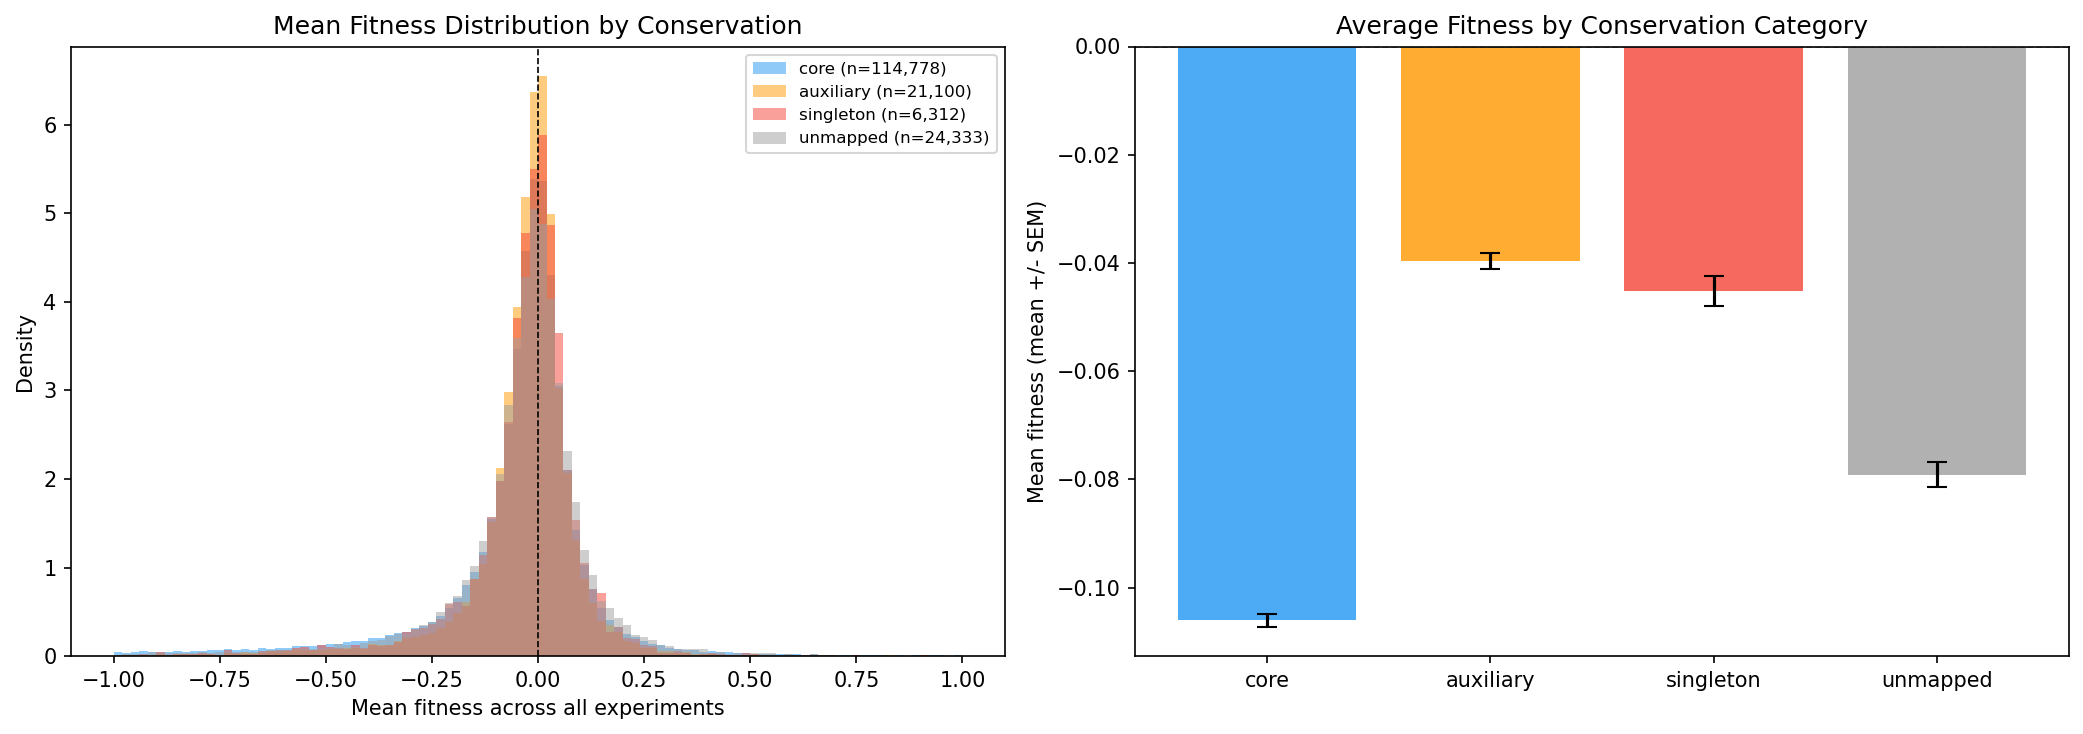
Novel (singleton) genes show near-zero mean fitness, suggesting they are largely invisible to lab-based fitness assays -- neither beneficial nor detrimental under tested conditions.
(Notebook: 02_fitness_vs_conservation.ipynb)
Interpretation
The results paint a consistent picture: gene fitness importance and pangenome conservation are positively correlated across the full spectrum. Essential genes are 82% core; always-neutral genes are 66% core. This 16-percentage-point gradient spans ~194,000 genes across 43 diverse bacteria.
However, several findings challenge simple models:
- Core genes are more likely to be both detrimental (essential) AND beneficial (burden) when deleted -- they're more extreme, not more neutral
- Condition-specific fitness genes are more core, not more accessory
- Novel/singleton genes are NOT systematically detrimental -- their mean fitness is near zero, similar to auxiliary genes
These patterns suggest that core genes are the most functionally active genes -- they have the largest fitness effects in both directions because they're embedded in critical pathways. Accessory genes, by contrast, tend to be functionally quieter under lab conditions.
Literature Context
- Price et al. (2018) generated the Fitness Browser data used here, providing the largest resource of genome-wide mutant fitness data for bacteria. Our analysis adds a pangenome conservation dimension to their fitness measurements.
- Luo et al. (2015) showed that core genes have stronger purifying selection than accessory genes across bacterial species, consistent with our finding that genes with stronger fitness effects are more likely core.
- McInerney et al. (2017) reviewed the gene-sharing network view of pangenomes, arguing that gene frequency distributions reflect a balance of selection, drift, and HGT. Our fitness-conservation gradient provides empirical support for selection as a major driver of core gene maintenance.
Limitations
- Lab conditions are biased toward rich media and standard stresses; many ecological niches are unrepresented
- The 16pp gradient, while statistically robust, means conservation is only weakly predicted by fitness importance
- Fitness measurements are for single-gene knockouts; epistatic interactions are not captured
- The Fitness Browser covers 43 bacteria -- primarily Proteobacteria -- limiting generalizability
- Singleton/novel genes may lack fitness data due to poor transposon coverage rather than true neutrality
Data
Sources
| Dataset | Description | Source |
|---|---|---|
| Fitness Browser | RB-TnSeq mutant fitness data for ~194K genes | Price et al. (2018) |
| KBase pangenome link table | Gene-to-cluster conservation mapping | conservation_vs_fitness/data/fb_pangenome_link.tsv |
| Essential genes | Essentiality classification | conservation_vs_fitness/data/essential_genes.tsv |
| Specific phenotypes | Condition-specific fitness annotations | Fitness Browser specificphenotype table |
Generated Data
| File | Description |
|---|---|
data/fitness_stats.tsv |
Per-gene fitness summary |
data/fitness_stats_by_condition.tsv |
Per-gene per-condition-type stats |
data/specific_phenotypes.tsv |
Specific phenotype counts |
References
- Price MN et al. (2018). "Mutant phenotypes for thousands of bacterial genes of unknown function." Nature 557:503-509. PMID: 29769716
- Parks DH et al. (2022). "GTDB: an ongoing census of bacterial and archaeal diversity through a phylogenetically consistent, rank normalized and complete genome-based taxonomy." Nucleic Acids Res 50:D199-D207. PMID: 34520557
- Luo H et al. (2015). "Evolution of divergent life history strategies in marine alphaproteobacteria." mBio 6:e01251-15. PMID: 26530382
- McInerney JO et al. (2017). "Why prokaryotes have pangenomes." Nat Microbiol 2:17040. PMID: 28350002
Discoveries
Across 194,216 protein-coding genes in 43 bacteria, there is a clear 16-percentage-point gradient from essential genes (82% core) to always-neutral genes (66% core). The same pattern holds when binning by strongest negative fitness effect (min_fit < -3 → 78% core vs min_fit near 0 → 66%) and by fitn
Read more →Core genes are MORE likely to be burdens, not less
February 2026Counter to the expectation that accessory genes impose a carrying cost, core genes are more likely to show positive fitness effects when deleted (24.4% ever beneficial vs 19.9% for auxiliary; OR=0.77 for auxiliary vs core, p=5.5e-48). Core genes participate in more pathways and trade-off situations
Read more →Genes with strong condition-specific phenotypes (from the FB specificphenotype table) are 77.3% core vs 70.3% for genes without specific phenotypes (OR=1.78, p=1.8e-97). This contradicts the intuition that condition-specific fitness = niche-specific genes = accessory genome. Instead, core genes ar
Data Collections
Derived Data
This project builds on processed data from other projects.
Used By
Data from this project is used by other projects.
Core Gene Paradox -- Why Are Core Genes More Burdensome?
View project →
Lab Fitness Predicts Field Ecology at Oak Ridge
View project →
Metabolic Capability vs Dependency
View project →
Gene Conservation, Fitness, and the Architecture of Bacterial Genomes
View project →
The 5,526 Costly + Dispensable Genes
View project →
Review
Summary
This is a well-executed quantitative analysis that extends the companion project's binary essential/non-essential framing into a continuous fitness spectrum, asking whether genes with stronger or broader fitness effects are more conserved in the pangenome. The project demonstrates strong scientific reasoning, clean notebook organization, and thoughtful inclusion of essential genes as the extreme fitness category. The key finding — a 16-percentage-point gradient from 82% core (essential) to 66% core (always neutral) across 194,000 genes — is clearly supported by the data. Several counter-intuitive findings (core genes are more likely to be burden genes; condition-specific genes are more core, not more accessory) are honestly reported and thoughtfully interpreted. The main areas for improvement are minor: the README numbers for some categories show small discrepancies with notebook outputs, the t-statistic from the genefitness table is not used for quality filtering, and a requirements.txt exists but lacks version pinning for reproducibility.
Methodology
Research question: Clearly stated and testable — the project asks whether the fitness-conservation relationship is a continuous gradient (not just binary), and tests this from multiple angles (magnitude, breadth, condition type, novel gene landscape, ephemeral niche genes). The multi-faceted approach is a strength.
Essential gene inclusion: The decision to include essential genes (no viable transposon mutants) as the most extreme fitness category is well-justified and explicitly motivated in the NB02 header. This is a critical design choice — without it, the analysis would miss 14.3% of genes and the strongest signal. The README and notebooks are transparent that this is an upper bound on true essentiality.
Statistical methods: Appropriate throughout. Spearman correlation for the ordinal/continuous relationship, Fisher's exact test for 2×2 contingency tables, and odds ratios for effect sizes. The Spearman rho values (−0.092 for min_fit vs is_core; 0.086 for breadth vs is_core) are small but highly significant given the sample size (~140K mapped non-essential genes), and the project does not overclaim their magnitude.
Data sources: Clearly identified in the README table. The dependency on the companion project's shared link table (fb_pangenome_link.tsv) and essential gene classifications (essential_genes.tsv) is explicitly documented.
Reproducibility: Strong. The project has:
- A clear three-step reproduction guide (extract → NB02 → NB03) distinguishing Spark vs local steps
- A requirements.txt with minimum versions
- A standalone extraction script (src/extract_fitness_stats.py) with checkpointing (skips if output exists)
- Notebooks that load from cached TSV files rather than requiring live Spark access
- All 15 code cells across both notebooks have saved outputs (9/9 in NB02, 6/6 in NB03), including 9 figures
- 9 figures in the figures/ directory covering all major analysis stages
Code Quality
SQL queries (in src/extract_fitness_stats.py): Correct and follow BERDL best practices:
- All numeric comparisons use CAST(fit AS FLOAT) — correctly addressing the pitfall that all kescience_fitnessbrowser columns are strings (documented in docs/pitfalls.md)
- Queries filter by orgId per iteration, avoiding full-table scans of the 27M-row genefitness table
- The join between genefitness and experiment for condition-type breakdown uses proper key columns (orgId + expName)
Extraction script design: Well-structured with three independent extraction phases, each with checkpointing. The use of berdl_notebook_utils.setup_spark_session.get_spark_session for CLI execution is consistent with the documented approach in docs/pitfalls.md.
Notebook organization: Both notebooks follow a clean structure: setup → analysis sections (A, B, C, D) → summary. Each section has a markdown header, analysis code, and printed results. The summary cells at the end of each notebook provide a quick reference.
Potential issues:
-
No
t-statistic filtering: Thegenefitnesstable includes atcolumn (t-statistic for the fitness score). The extraction script computes fitness thresholds (e.g.,fit < -1) without filtering on|t| > 2or similar quality cutoffs. While not wrong — this is a deliberate choice to include all data — it means low-confidence fitness scores are included in the counts. A brief note justifying this choice would strengthen the methodology. -
SQL injection pattern: The extraction script uses f-string interpolation for
orgIdvalues (WHERE orgId = '{orgId}'). Since these values come from a trusted internal TSV file rather than user input, this is safe in practice, but parameterized queries would be more robust. -
Minor README vs notebook discrepancy: The README states ephemeral niche genes are "3.0% in core" and "1.7% in auxiliary," but the NB02 output shows 2.5% core and 1.5% auxiliary. The notebook output is the authoritative source; the README appears to use slightly different numbers (possibly from an earlier run or from mapped-only denominators).
-
Conservation classification logic: In both notebooks, the
is_coreandis_singletonboolean comparison uses== Truerather than== 1. Since the link table comes from a pandas merge with boolean-typed columns, this works correctly, but it's worth noting since the upstream pangenome data stores these as integers (0/1) perdocs/pitfalls.md. -
Ephemeral gene definition: The definition (|mean_fit| < 0.3, min_fit < −2, n_sick ≤ 3) is reasonable but somewhat arbitrary. The thresholds are stated clearly in both the README and the notebook code, which is good practice, but the project doesn't test sensitivity to these thresholds.
Findings Assessment
Conclusions supported by data: Yes. Each major finding in the README has corresponding notebook output:
- The fitness magnitude gradient (essential 82% → neutral 66%) is shown in both the min_fit_bin crosstab and the fitness profile analysis
- The breadth-conservation correlation (Spearman rho=0.086) is computed and visualized in NB03
- The burden gene analysis uses Fisher's exact tests with reported odds ratios
- The specific phenotype enrichment (OR=1.78) is directly computed in NB03
Limitations acknowledged: Yes, thoroughly. The README's Interpretation section explicitly addresses three counter-intuitive findings rather than glossing over them. The companion project's limitations (essentiality upper bound, pangenome coverage variation, E. coli exclusion) are referenced by dependency.
Incomplete analysis: None detected. All six analysis threads listed in the Approach section are carried out in the notebooks.
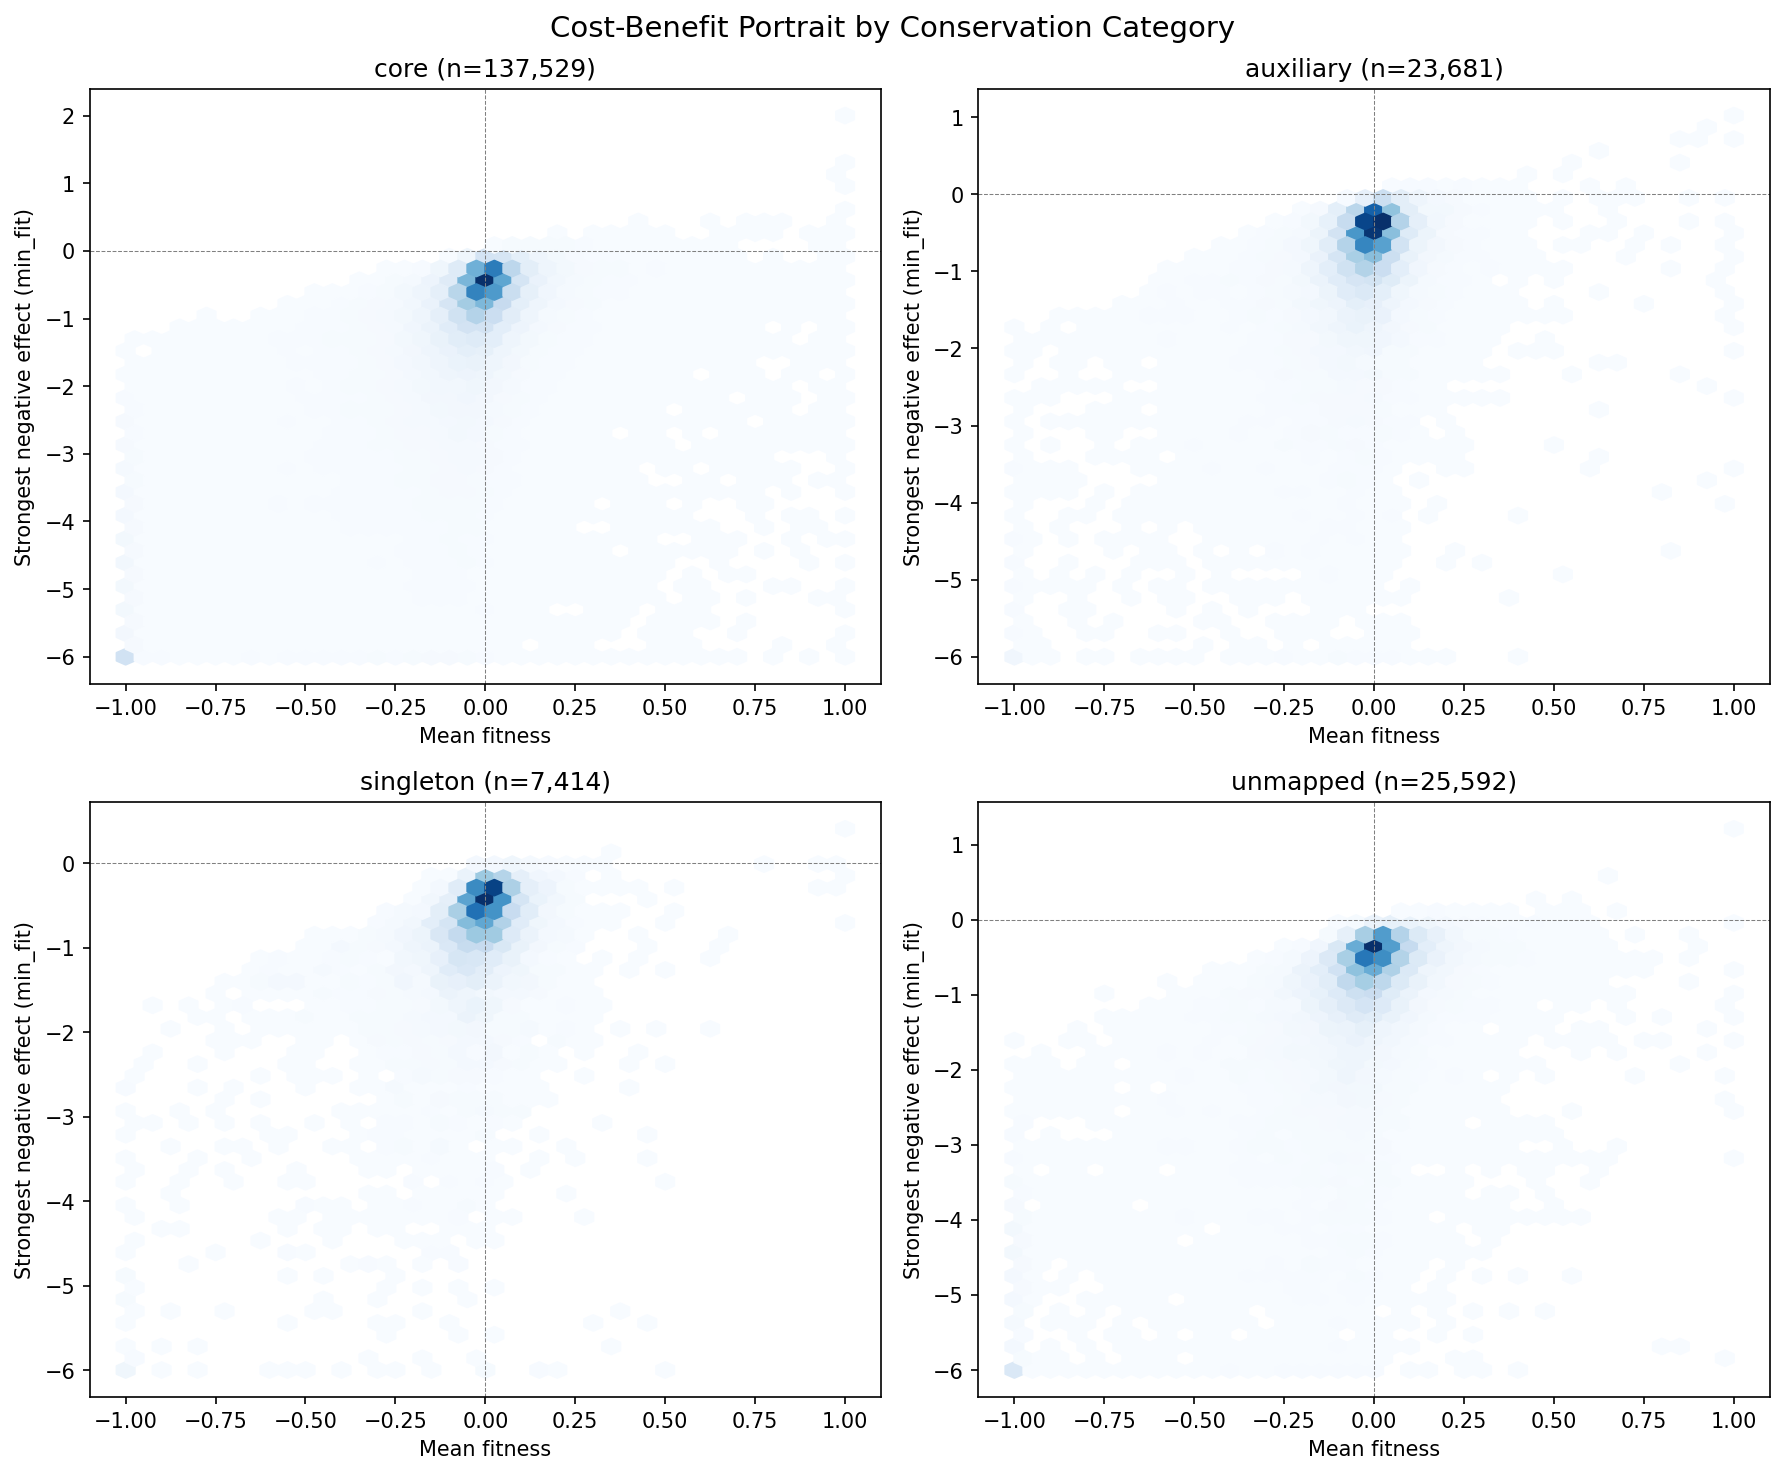
Visualizations: 9 figures covering fitness magnitude, burden genes, fitness distributions, fitness profiles, novel gene landscape, cost-benefit portrait, fitness breadth, condition type, and broad-vs-specific heatmap. All are properly saved to figures/ and embedded in notebook outputs. Axis labels and titles are clear. The cost-benefit portrait (hexbin 2D density) is a particularly effective visualization.
Suggestions
-
Reconcile README numbers with notebook outputs (minor): The ephemeral gene percentages in the README (3.0% core, 1.7% auxiliary, 1.6% singleton) differ from NB02 output (2.5% core, 1.5% auxiliary, 1.4% singleton). Update the README to match the notebook's authoritative output, or document if the README intentionally uses mapped-only denominators.
-
Document the t-statistic filtering decision (minor): Add a brief note in NB02's header markdown or the README explaining why no
t-statistic quality filter is applied to fitness scores. Even a one-sentence justification ("We include all fitness measurements regardless of t-statistic to maximize coverage; quality filtering by |t| > 2 reduces coverage by X% but does not change the direction of results") would strengthen the methodology. -
Test ephemeral gene threshold sensitivity (nice-to-have): The ephemeral niche gene definition uses three arbitrary thresholds. A brief sensitivity analysis (e.g., varying min_fit threshold from −1.5 to −3) would demonstrate robustness or reveal that the pattern is threshold-dependent.
-
Add per-organism effect heterogeneity analysis (nice-to-have): The companion project analyzed per-organism odds ratios with a forest plot. A similar per-organism breakdown for the fitness magnitude gradient would show whether the pattern is universal or driven by a subset of organisms. This would complement the cross-organism Spearman correlations.
-
Pin exact dependency versions (minor): The
requirements.txtspecifies minimum versions (pandas>=1.5) but not exact versions. For full reproducibility, consider adding arequirements-frozen.txtwith pinned versions from the analysis environment (e.g., viapip freeze). -
Add literature references to the README (nice-to-have): Unlike the companion project, this README has no References section. The findings about burden genes and condition-specific fitness effects could benefit from citations to relevant literature on gene dispensability and trade-off evolution (e.g., Kuo & Ochman 2009 on genome streamlining; Basan et al. 2015 on growth-rate trade-offs).
This review was generated by an AI system. It should be treated as advisory input, not a definitive assessment.
Visualizations
Broad Vs Specific Conservation
Burden Genes By Conservation
Conservation By Condition Type
Conservation By Fitness Profile
Cost Benefit Portrait
Fitness Breadth Vs Conservation
Fitness Distributions By Conservation
Fitness Magnitude Vs Conservation
Novel Gene Mean Fitness