Metabolic Capability vs Dependency
CompletedResearch Question
When a bacterium's genome encodes a complete biosynthetic or catabolic pathway, does the organism actually depend on it? Can we use fitness data to distinguish active dependencies from latent capabilities — and predict which pathways are candidates for evolutionary gene loss?
Research Plan
Hypothesis
- H0: Pathway completeness (GapMind) is sufficient to predict metabolic importance — complete pathways are uniformly important and incomplete pathways are uniformly unimportant.
- H1a: Pathways classified as "latent capabilities" (complete but fitness-neutral) are more likely to be accessory in the pangenome — candidates for future gene loss (Black Queen Hypothesis).
- H1b: Species with more latent capabilities have more open pangenomes (ongoing genome streamlining).
- H1c: "Incomplete but important" pathways represent annotation gaps or salvage routes that GapMind misses.
- H2: Within-species binary pathway profiles define metabolic ecotypes that correlate with pangenome conservation patterns and environment metadata.
Revision History
- v1 (2026-02-17): Initial plan based on design review and data exploration
- v2 (2026-02-19): Major revision incorporating findings from 25 related projects. Added Related Projects section documenting data dependencies and methodological templates. Key improvements: (1) fitness breadth metrics per fitness_effects_conservation, (2) condition-type stratification per field_vs_lab_fitness and core_gene_tradeoffs, (3) phylogenetic controls per ecotype_analysis, (4) improved KEGG KO-based pathway mapping instead of KEGG map IDs, (5) performance fix for large Spark extracts, (6) explicit GapMind-FB coverage verification per essential_metabolome finding.
- v3 (2026-02-19): Analysis complete. Key methodological change: NB02 uses FB-native KEGG annotations (besthitkegg → keggmember → EC → KEGG map) instead of the pangenome link table + eggnog_mapper_annotations. This avoids the DIAMOND alignment pipeline dependency while providing direct gene-to-pathway mapping for all 48 FB organisms. Results: 35.4% Active Dependencies, condition-type analysis validates the core_gene_tradeoffs finding, pan-bacterial correlation (rho=0.530) is strong and phylogenetically robust.
Overview
GapMind predicts metabolic pathway completeness for 293K bacterial genomes across 80 pathways (amino acid biosynthesis + carbon source utilization). But "complete" doesn't mean "needed." Using RB-TnSeq fitness data from the Fitness Browser (~34 organisms with pangenome links), we classify pathways into four categories: Active Dependencies (complete + fitness-important), Latent Capabilities (complete + fitness-neutral), Incomplete but Important (partial + fitness-important), and Missing (incomplete + unneeded). We then extend to all 27K pangenome species using gene conservation as a proxy for dependency, and define metabolic ecotypes from within-species pathway variation.
Key Findings
1. Pathway Completeness Alone Is Insufficient to Predict Metabolic Dependency
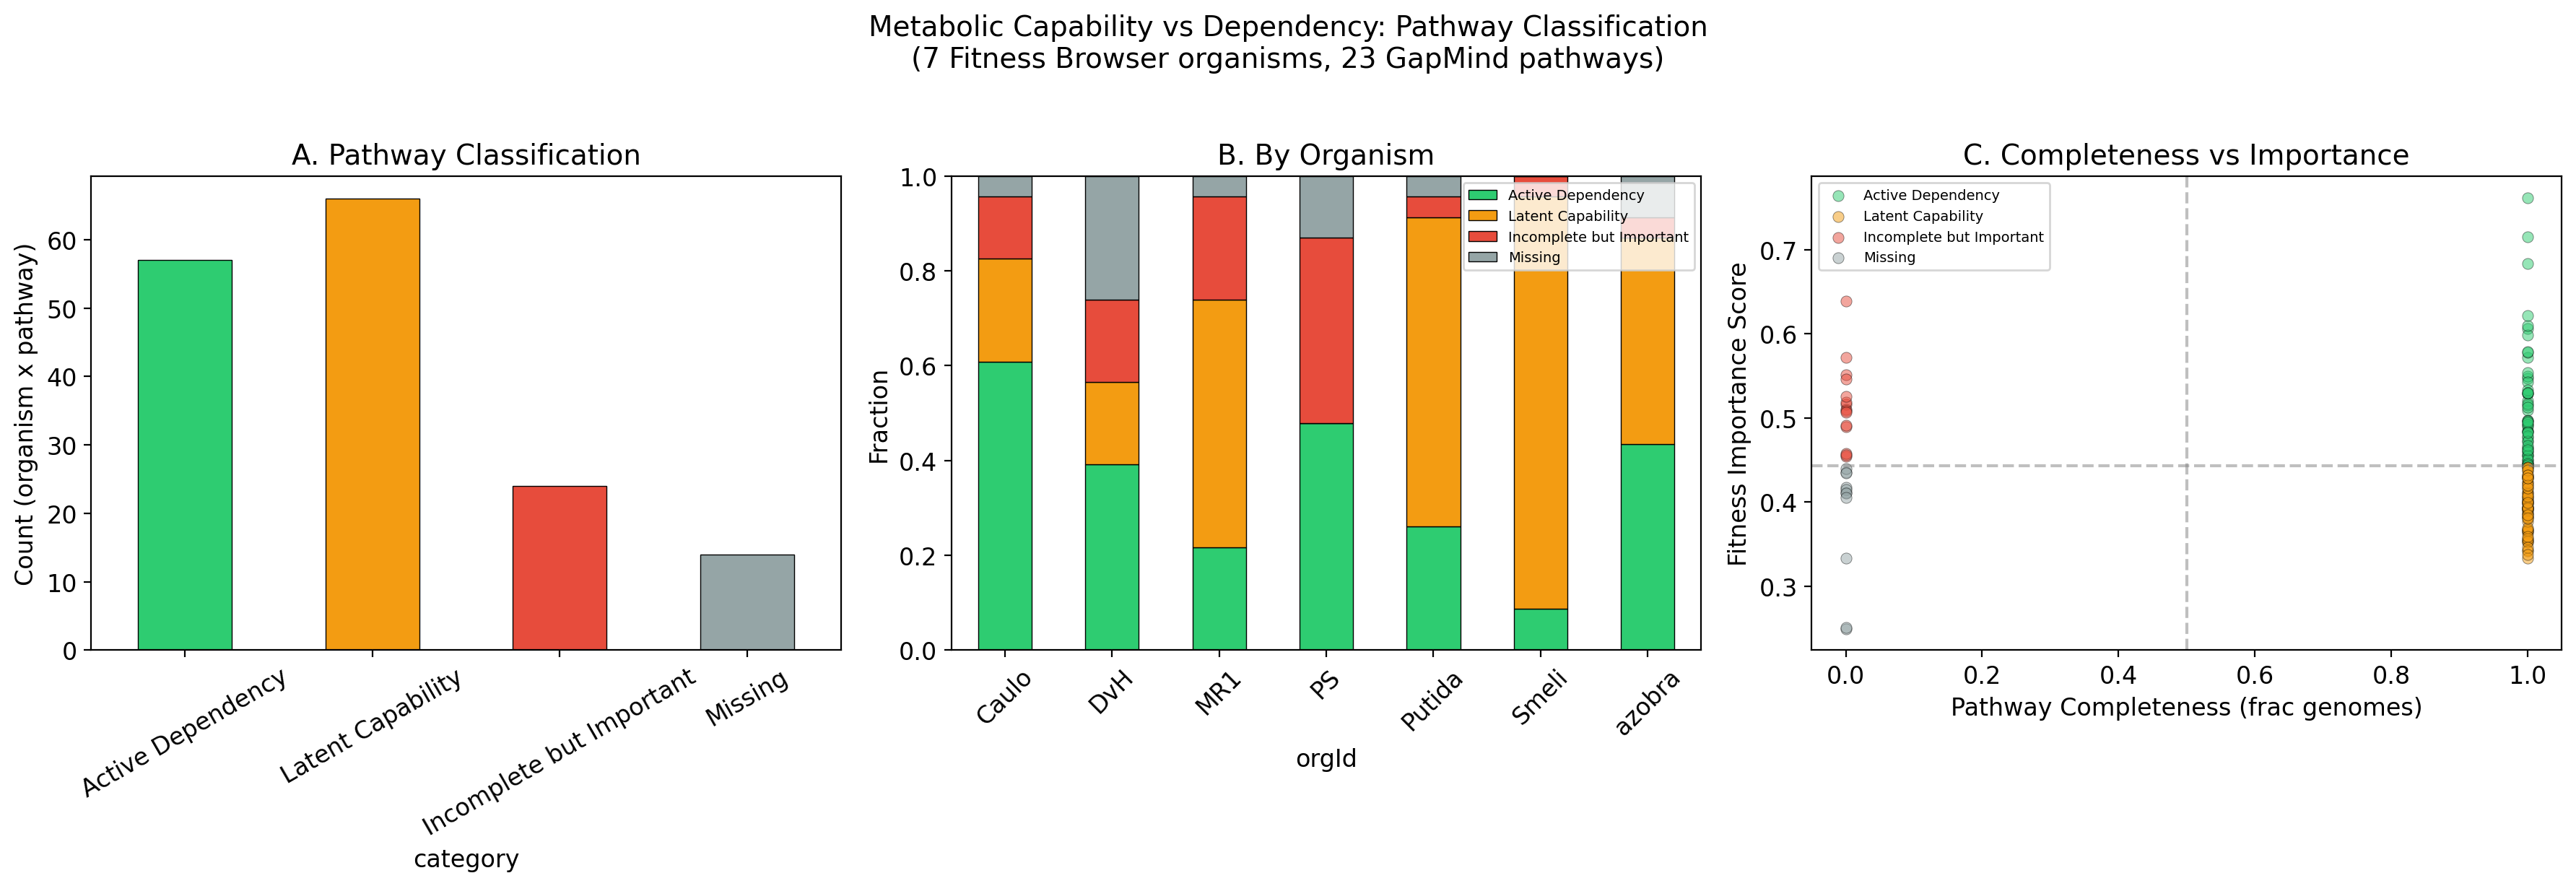
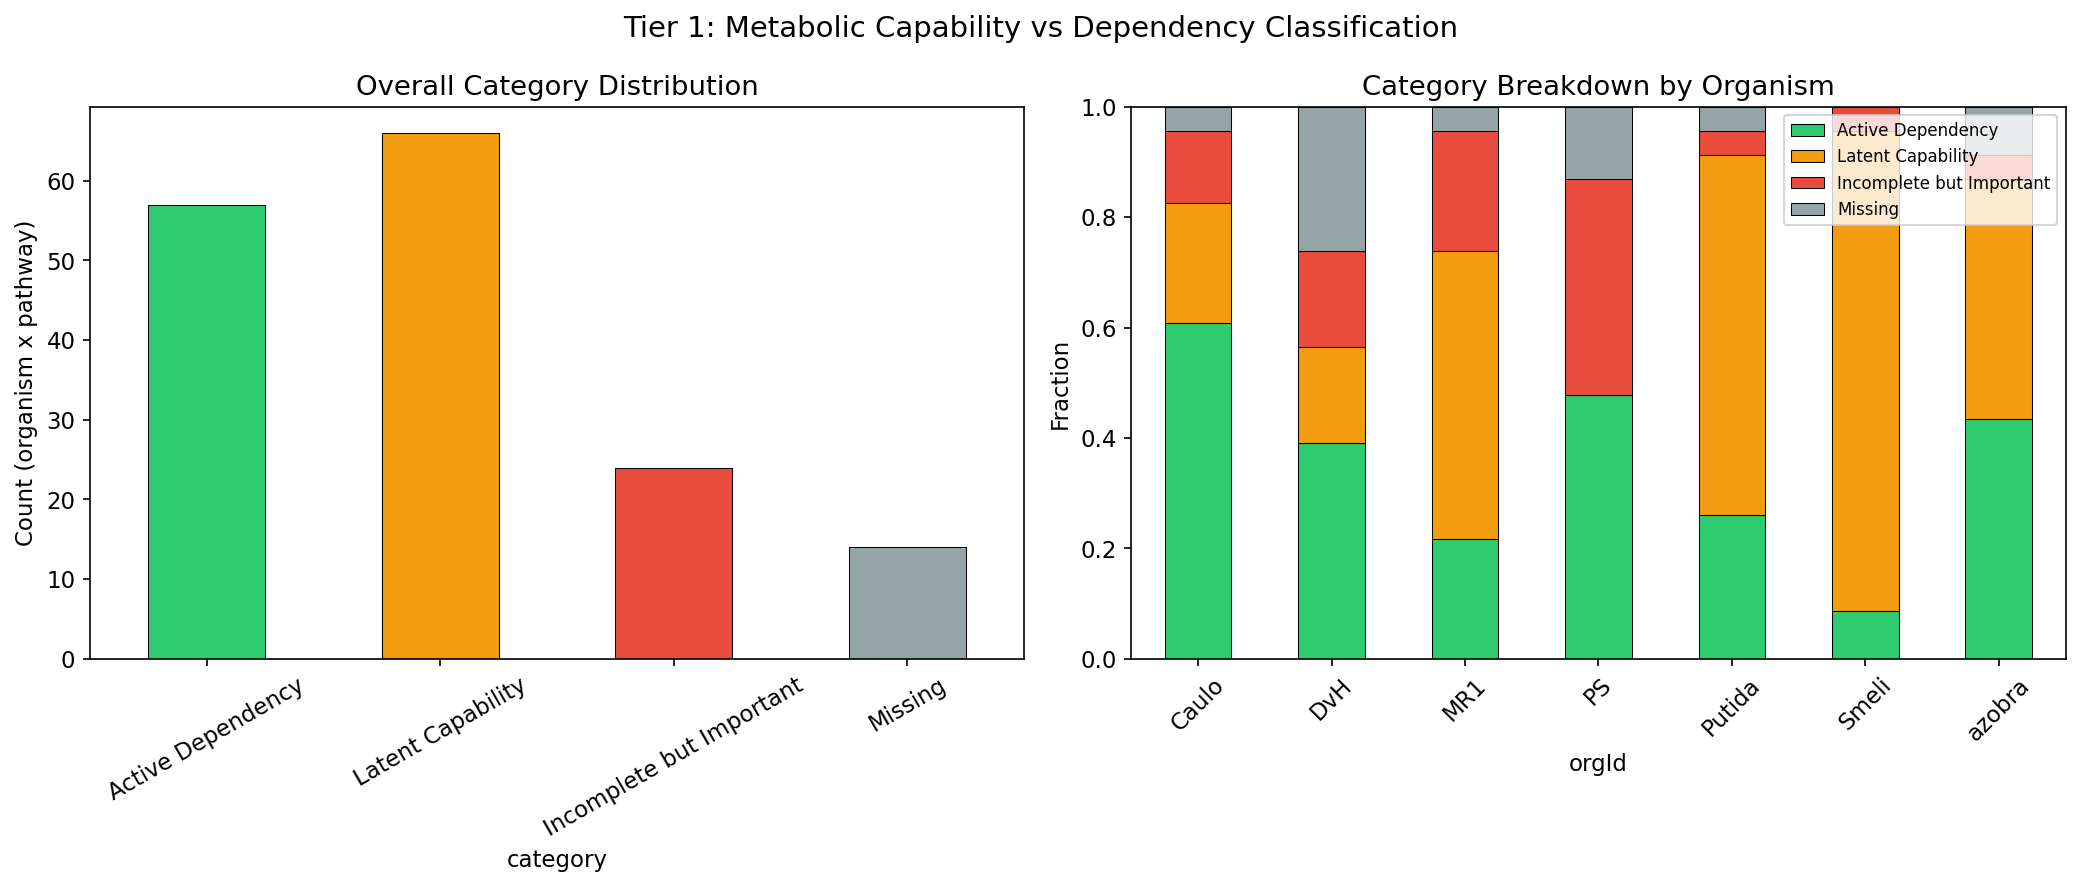
Of 161 classified organism-pathway pairs (7 Fitness Browser organisms, 23 GapMind pathways), only 35.4% (57/161) are Active Dependencies where a complete pathway contains fitness-important genes. The largest single category is Latent Capability at 41.0% (66/161): pathways that are genomically complete but whose constituent genes show no significant fitness defects under standard conditions. An additional 14.9% (24/161) are Incomplete but Important -- pathways that GapMind scores as incomplete yet whose mapped genes are fitness-important, suggesting annotation gaps or salvage routes. Only 8.7% (14/161) are Missing (neither complete nor important).
The composite importance score integrates three dimensions: 40% essentiality (fraction of pathway genes that are putative essentials), 30% fitness breadth (fraction of conditions with significant phenotype, per the fitness_effects_conservation finding that breadth predicts conservation better than magnitude), and 30% fitness magnitude (severity of the worst fitness defect). The mapping from FB genes to GapMind pathways uses FB-native KEGG annotations (besthitkegg to keggmember to EC to KEGG map to GapMind pathway) rather than the pangenome link table approach.
(Notebook: 02_tier1_pathway_classification.ipynb)
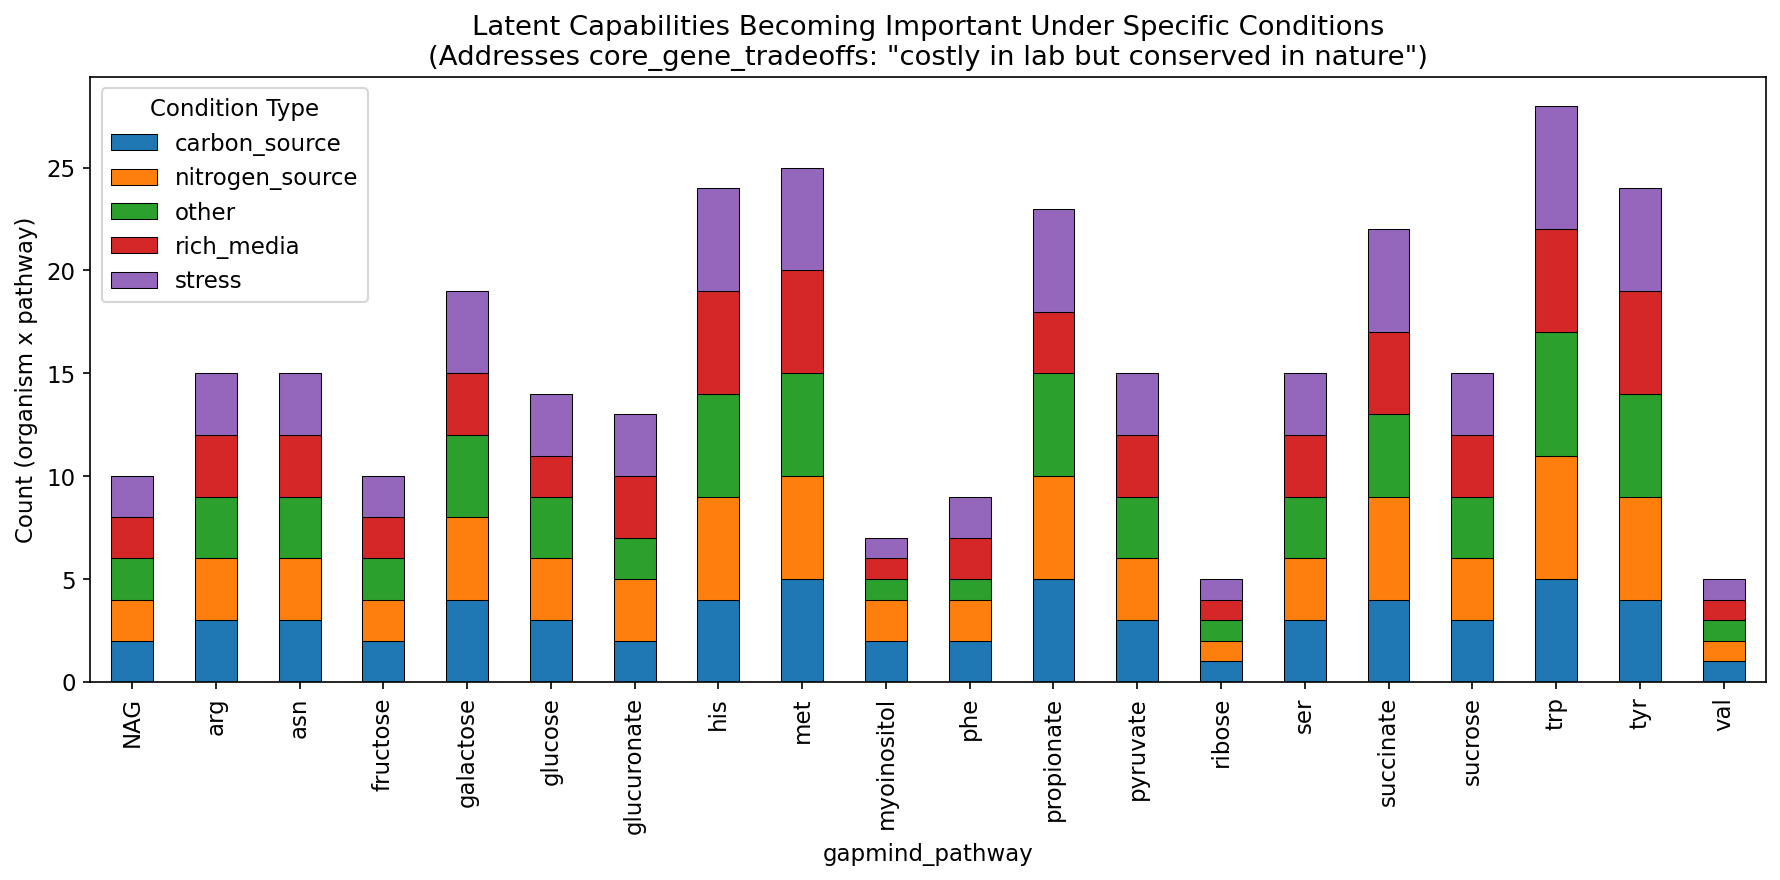
2. All "Latent Capabilities" Become Important Under Specific Conditions
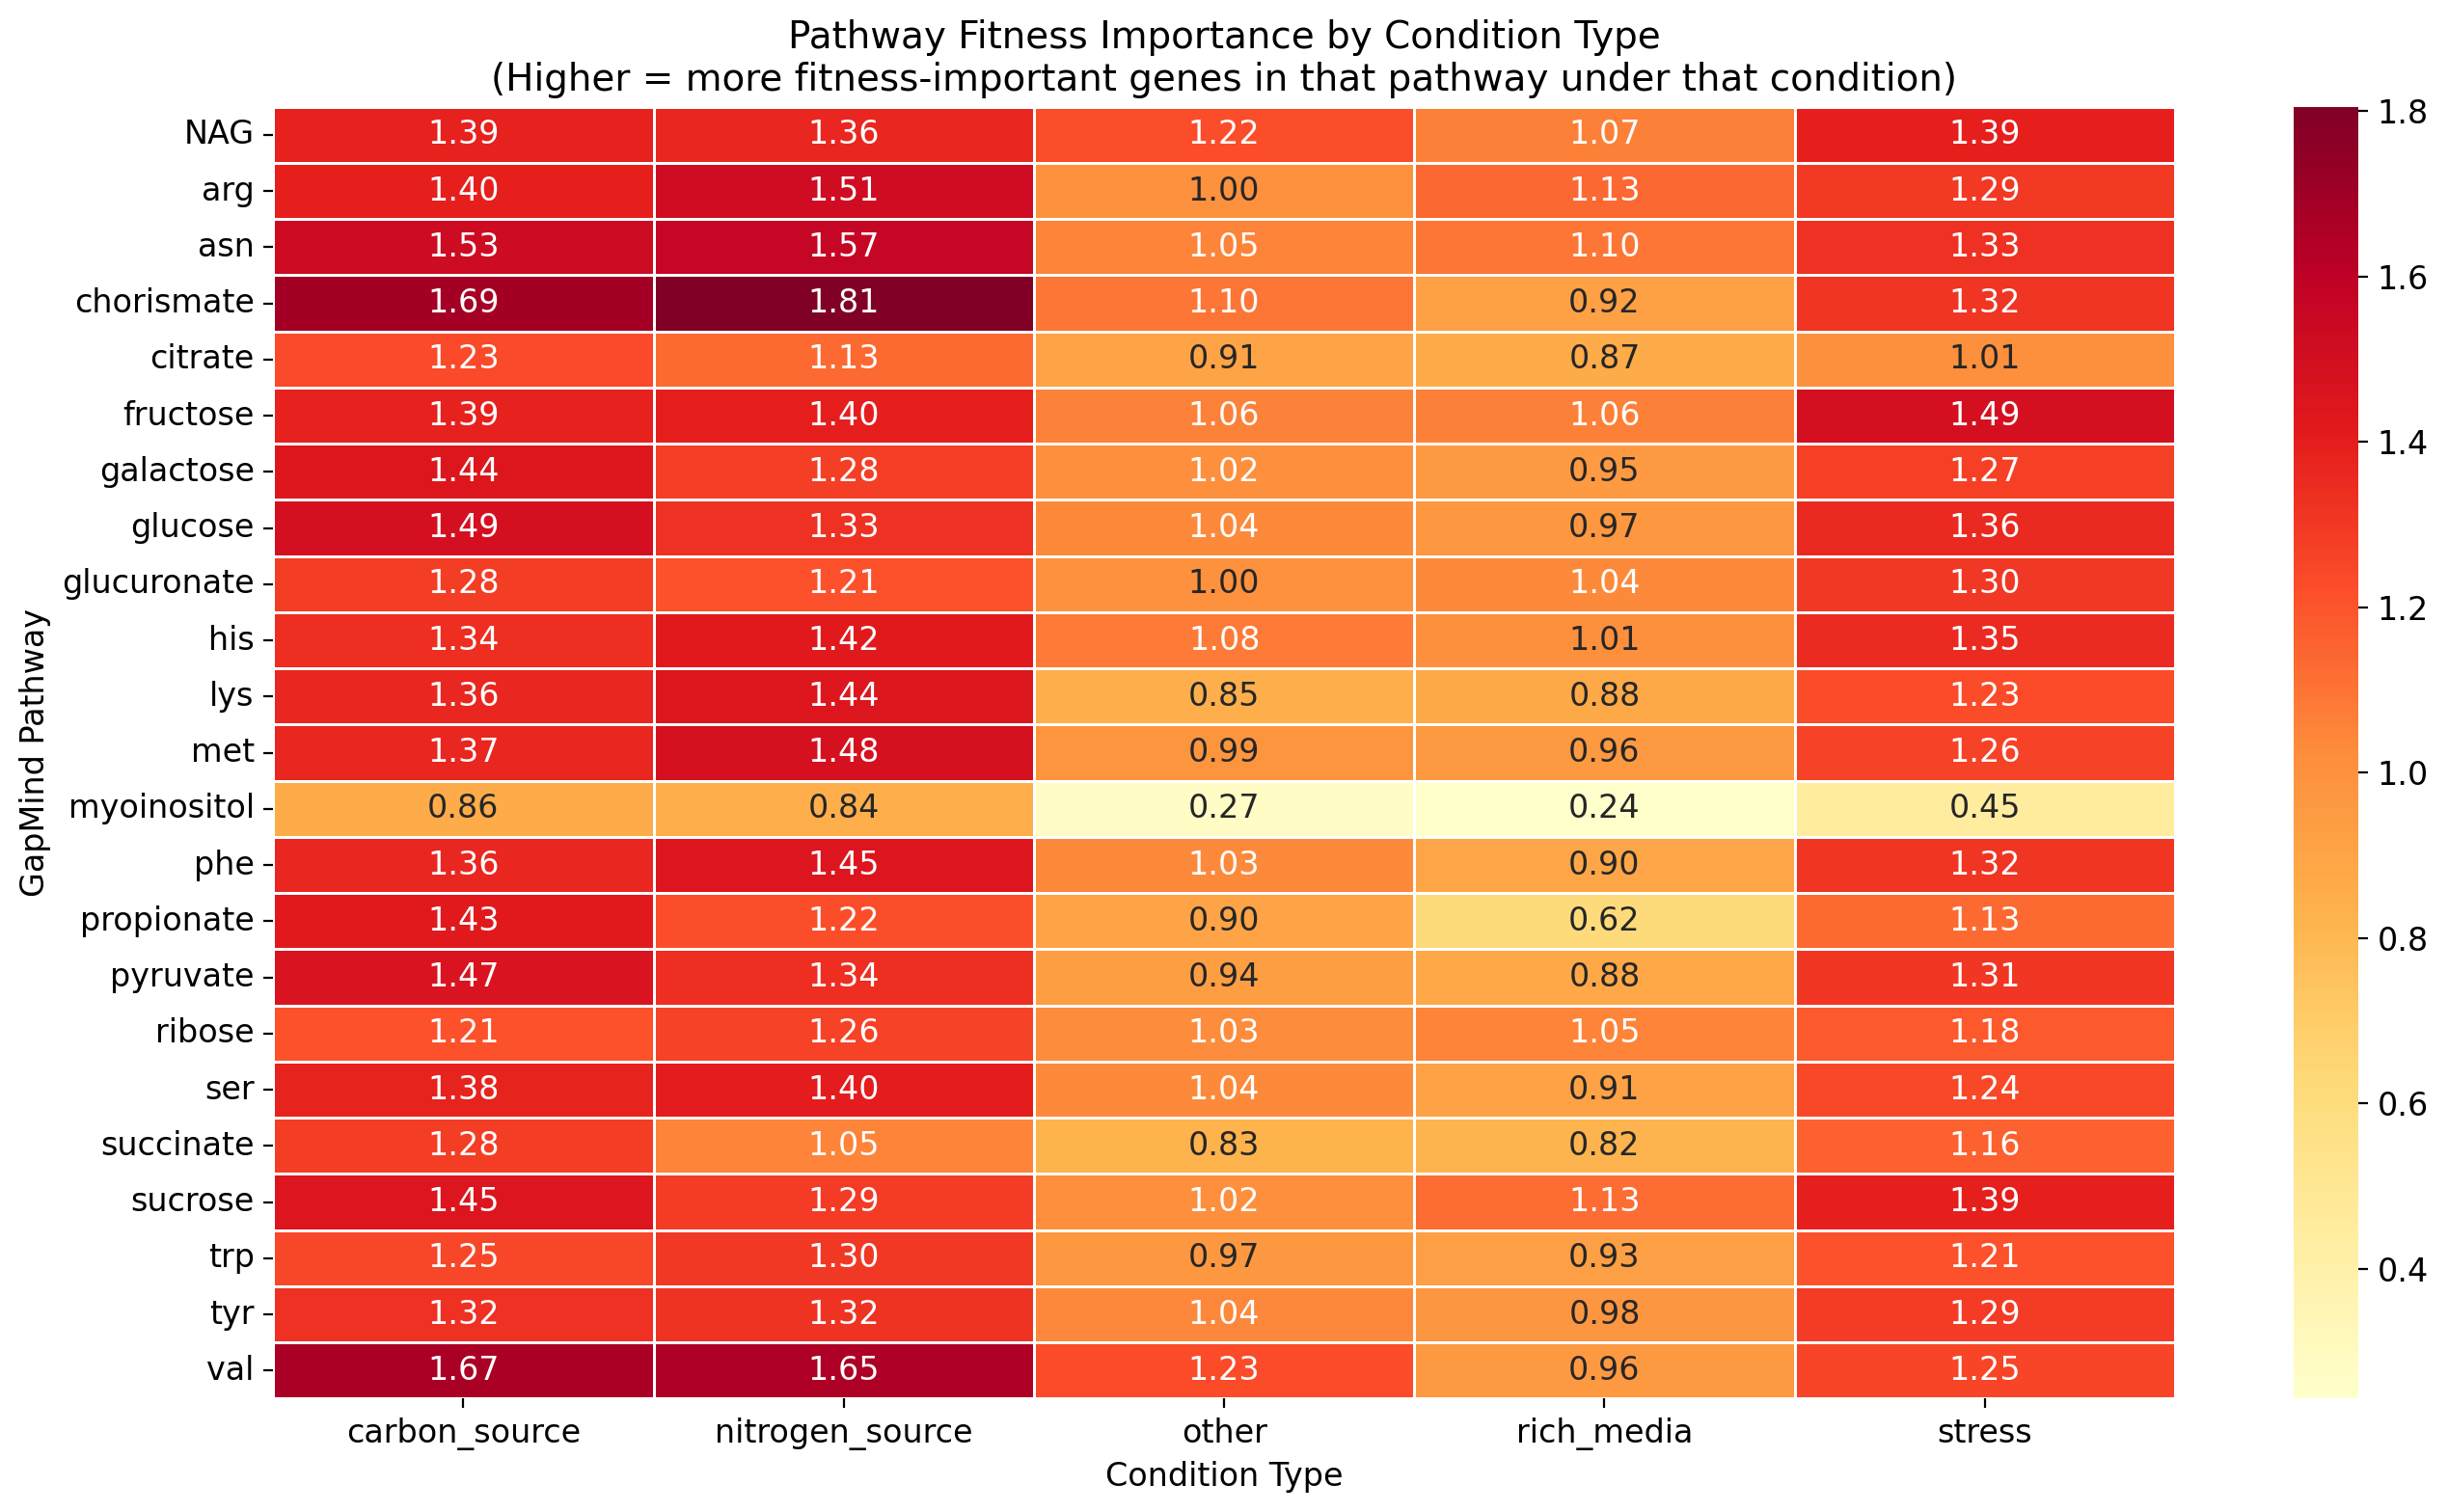
Condition-type stratification -- separating fitness effects by nitrogen source, carbon source, stress, and other conditions -- reveals that all 66 Latent Capability pathway-organism pairs become fitness-important under at least one condition type. This is consistent with the core_gene_tradeoffs finding that 28,017 genes across the Fitness Browser are "costly in lab but conserved in nature." The conditions that most frequently trigger reclassification are nitrogen limitation, stress, and carbon limitation.
This result means that "Latent Capability" is better understood as "conditionally active" rather than "genomic baggage." The pathways are maintained because they are needed, just not under the specific standard laboratory conditions used in most experiments. This has direct implications for Black Queen Hypothesis predictions: pathway gene loss may be constrained by the breadth of environmental conditions a species encounters, not just mean fitness under any single condition.
(Notebook: 02_tier1_pathway_classification.ipynb)
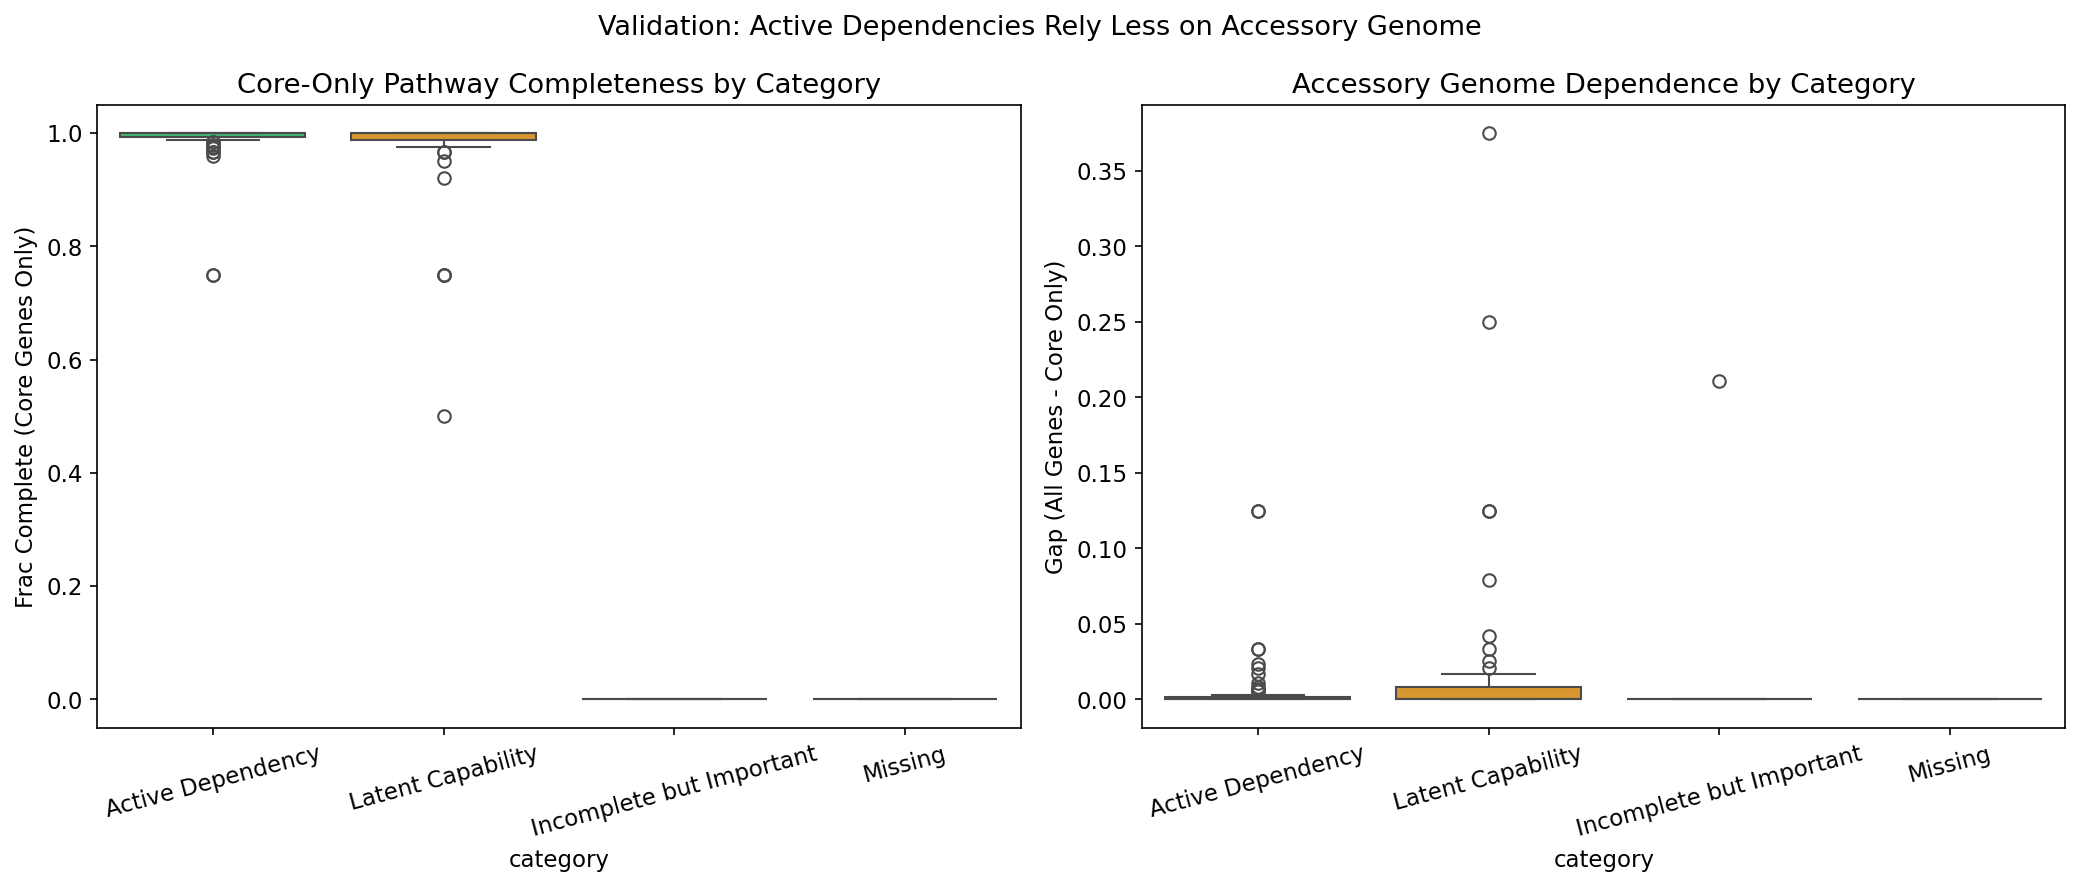
3. Conservation Validation: Active Dependencies Have Near-Complete Core Genomes
Validation against pangenome conservation data shows that Active Dependencies have mean core gene completeness of 0.986, compared to 0.975 for Latent Capabilities. The gap between categories is small because the 7 Fitness Browser organisms are well-studied model organisms (Desulfovibrio vulgaris Hildenborough, Shewanella oneidensis MR-1, Pseudomonas putida, Pseudomonas stutzeri, Caulobacter crescentus, Sinorhizobium meliloti, Azospirillum brasilense) with near-complete, well-annotated core genomes. The small but consistent direction of the enrichment is aligned with the metal_fitness_atlas finding that fitness-important genes are enriched in the core genome (OR=2.08 for metal-fitness genes).
(Notebook: 02_tier1_pathway_classification.ipynb)
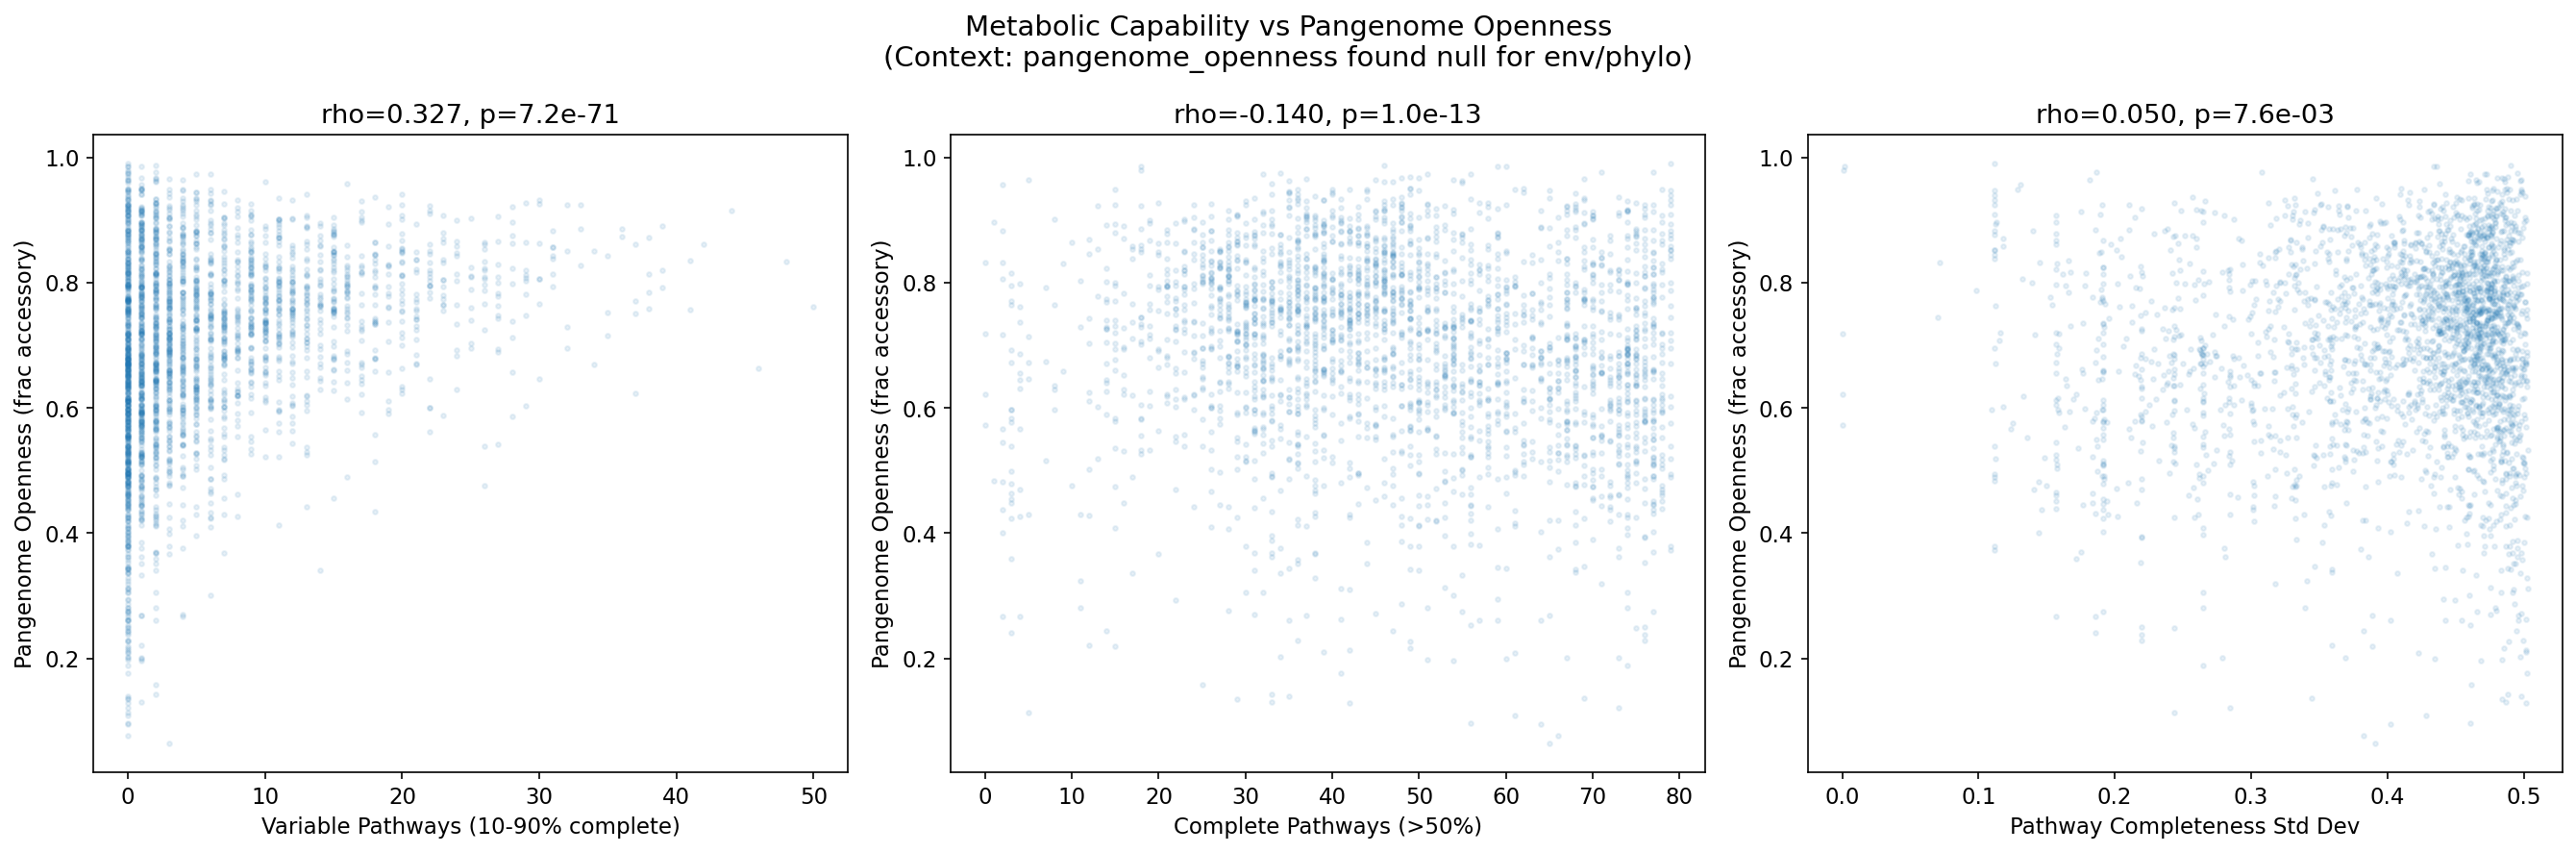
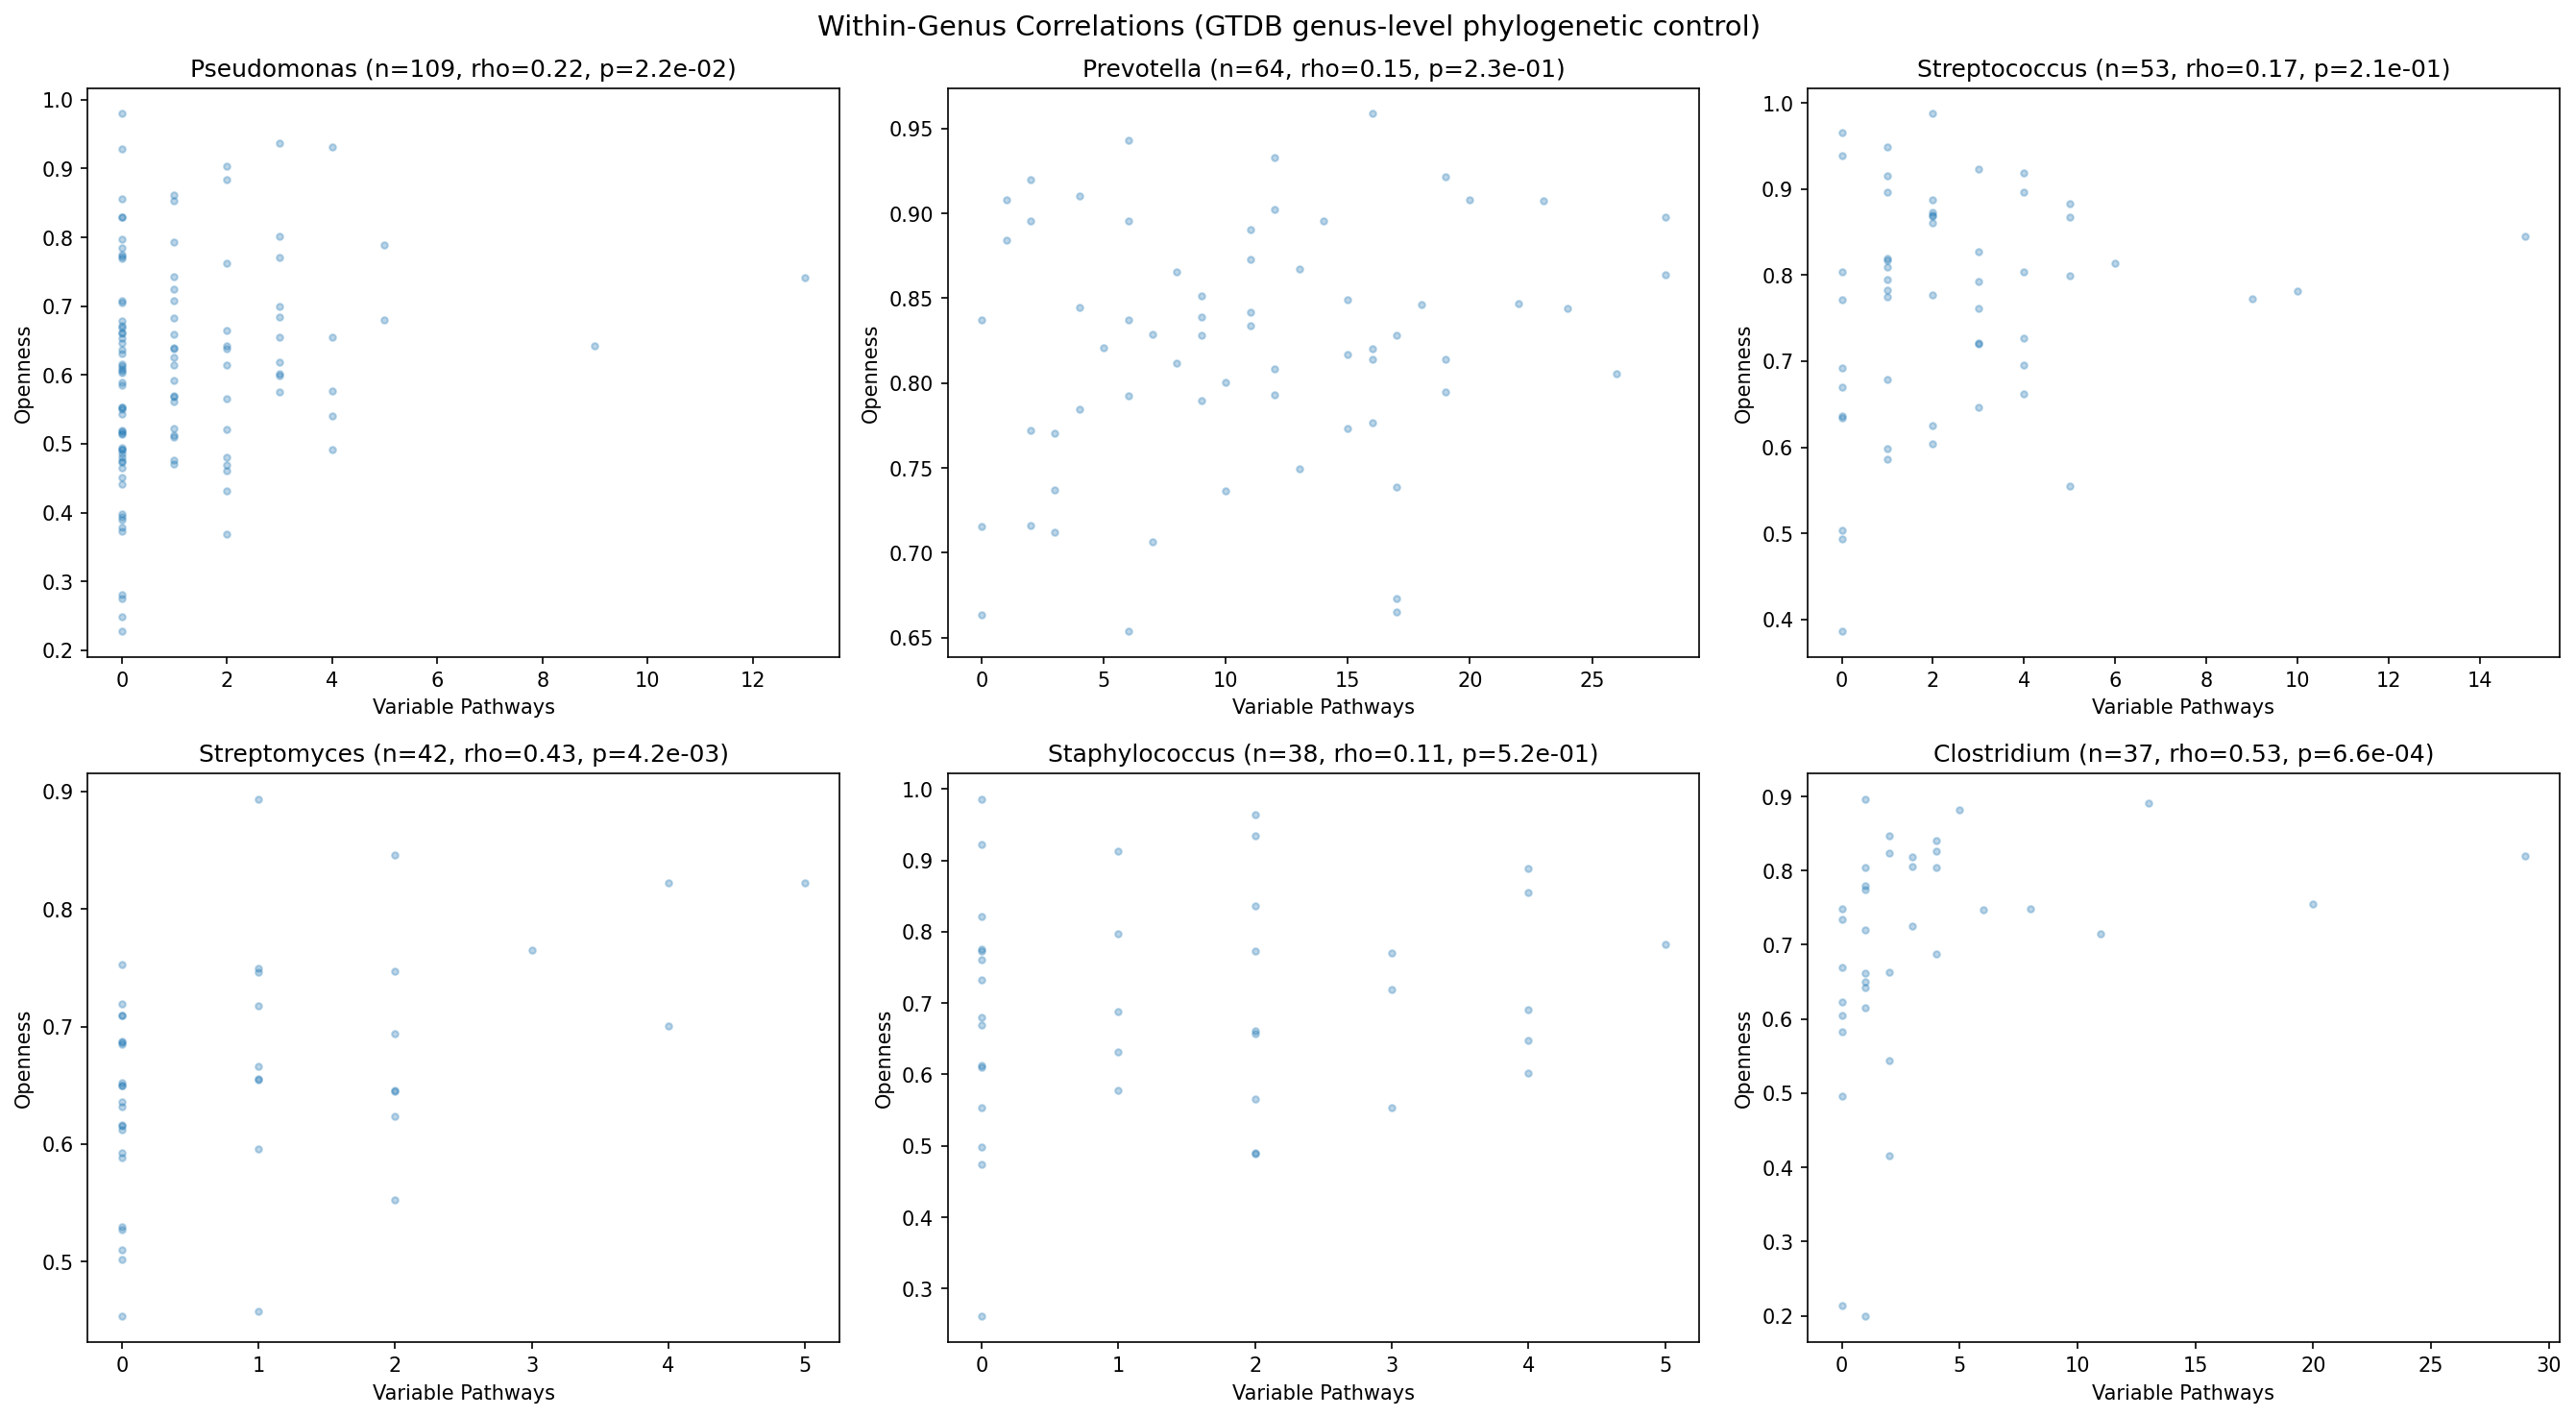
4. Variable Pathways Strongly Correlate with Pangenome Openness
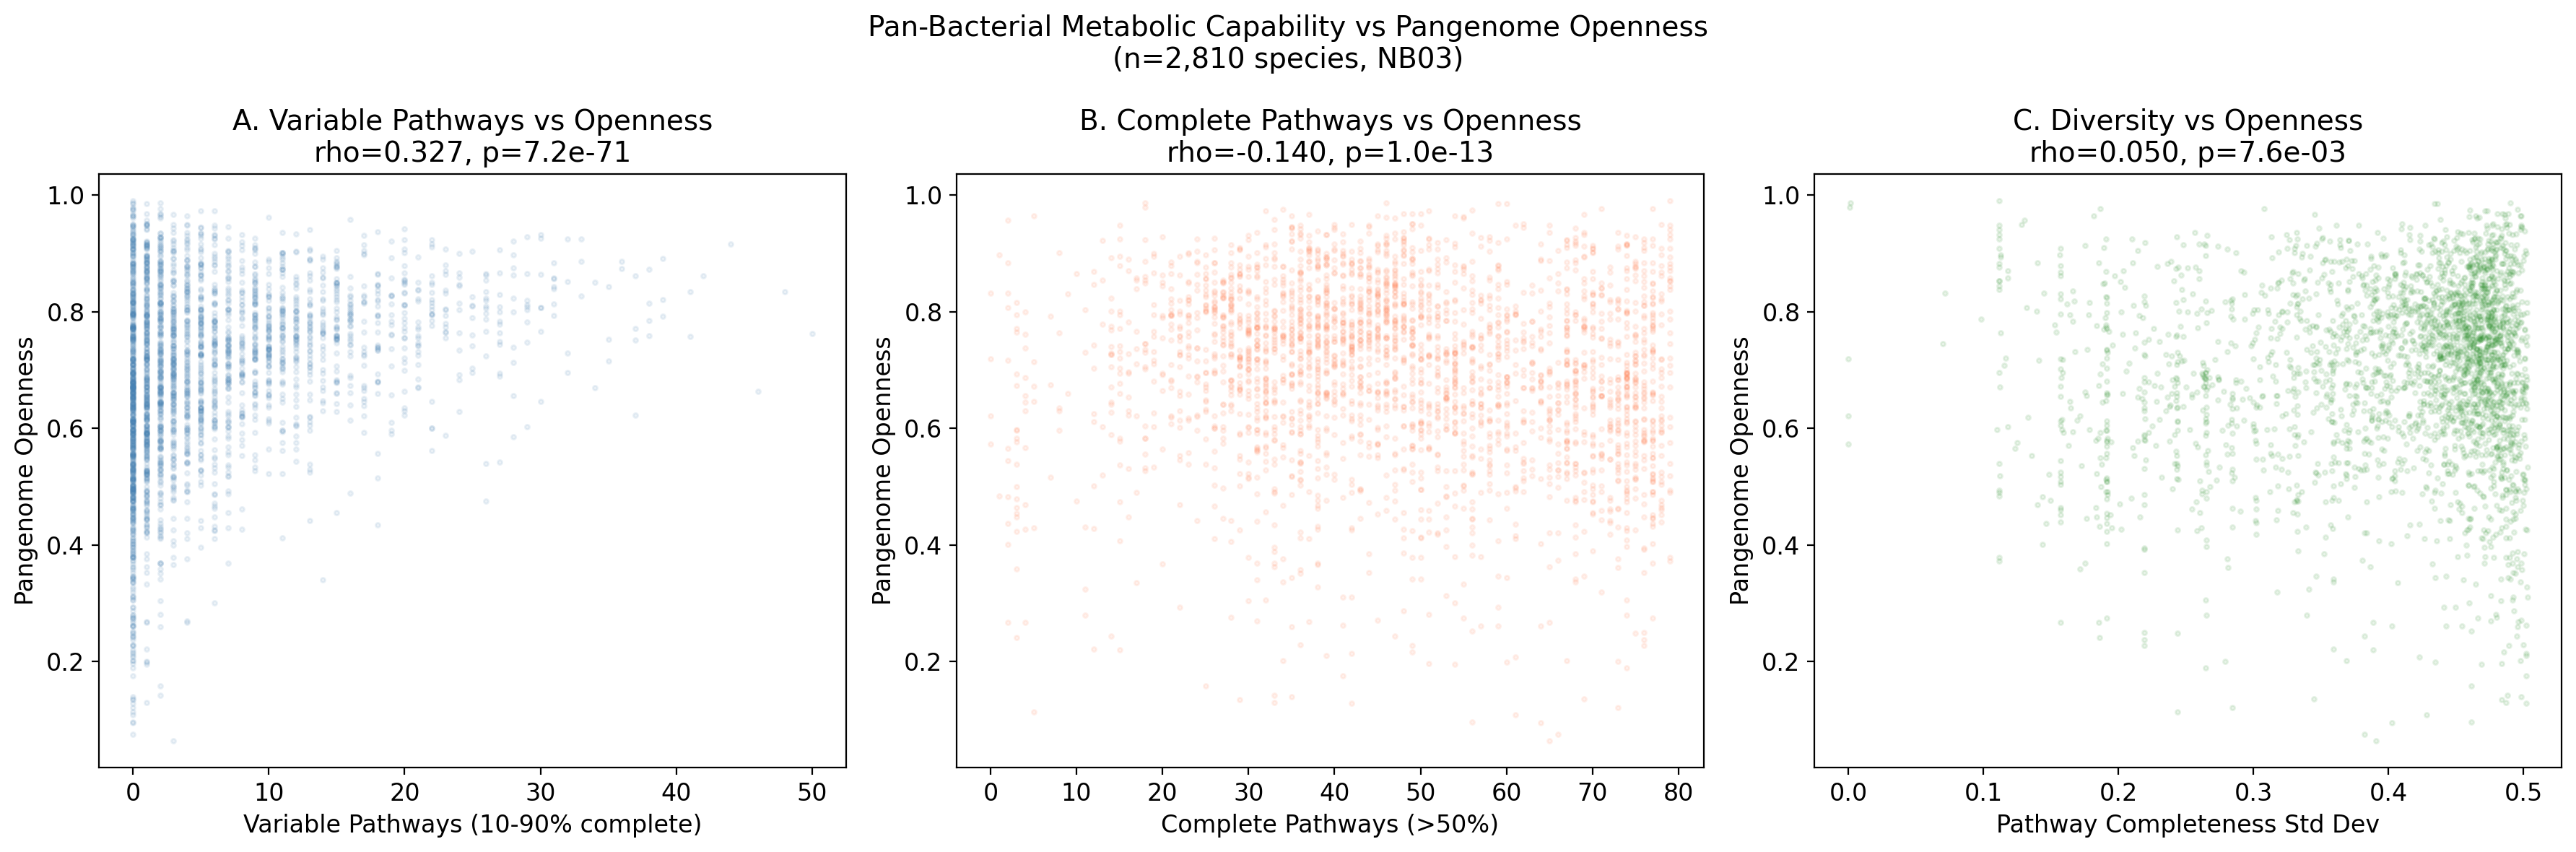
Across 2,810 species with at least 10 genomes, the number of variable pathways (present in 10-90% of genomes) correlates with pangenome openness (fraction of accessory gene clusters). The raw Spearman correlation is rho=0.327 (p=7.2e-71). After controlling for genome count -- a critical confounder since species with more sequenced genomes may appear to have more variable pathways simply from sampling depth -- the partial Spearman correlation strengthens to rho=0.530 (p=2.83e-203).
This confirms hypothesis H1b: species undergoing more pathway variation have more open, fluid pangenomes. Genus-level stratification shows the signal holds in 5 of 18 genera tested at the p<0.05 level (Clostridium, Eubacterium, Mesorhizobium, Pseudomonas, Streptomyces), with positive direction in 13 of 18. The signal is strongest within Clostridium (rho=0.534) and Eubacterium (rho=0.506), with smaller sample sizes per genus limiting statistical power for many groups.
This is notable in the context of the pangenome_openness project, which found no correlation between openness and environment or phylogeny effect sizes. Pathway variation provides a mechanistically interpretable correlate of openness that the broader ecological/phylogenetic variables did not capture.
(Notebook: 03_tier2_pathway_conservation.ipynb)
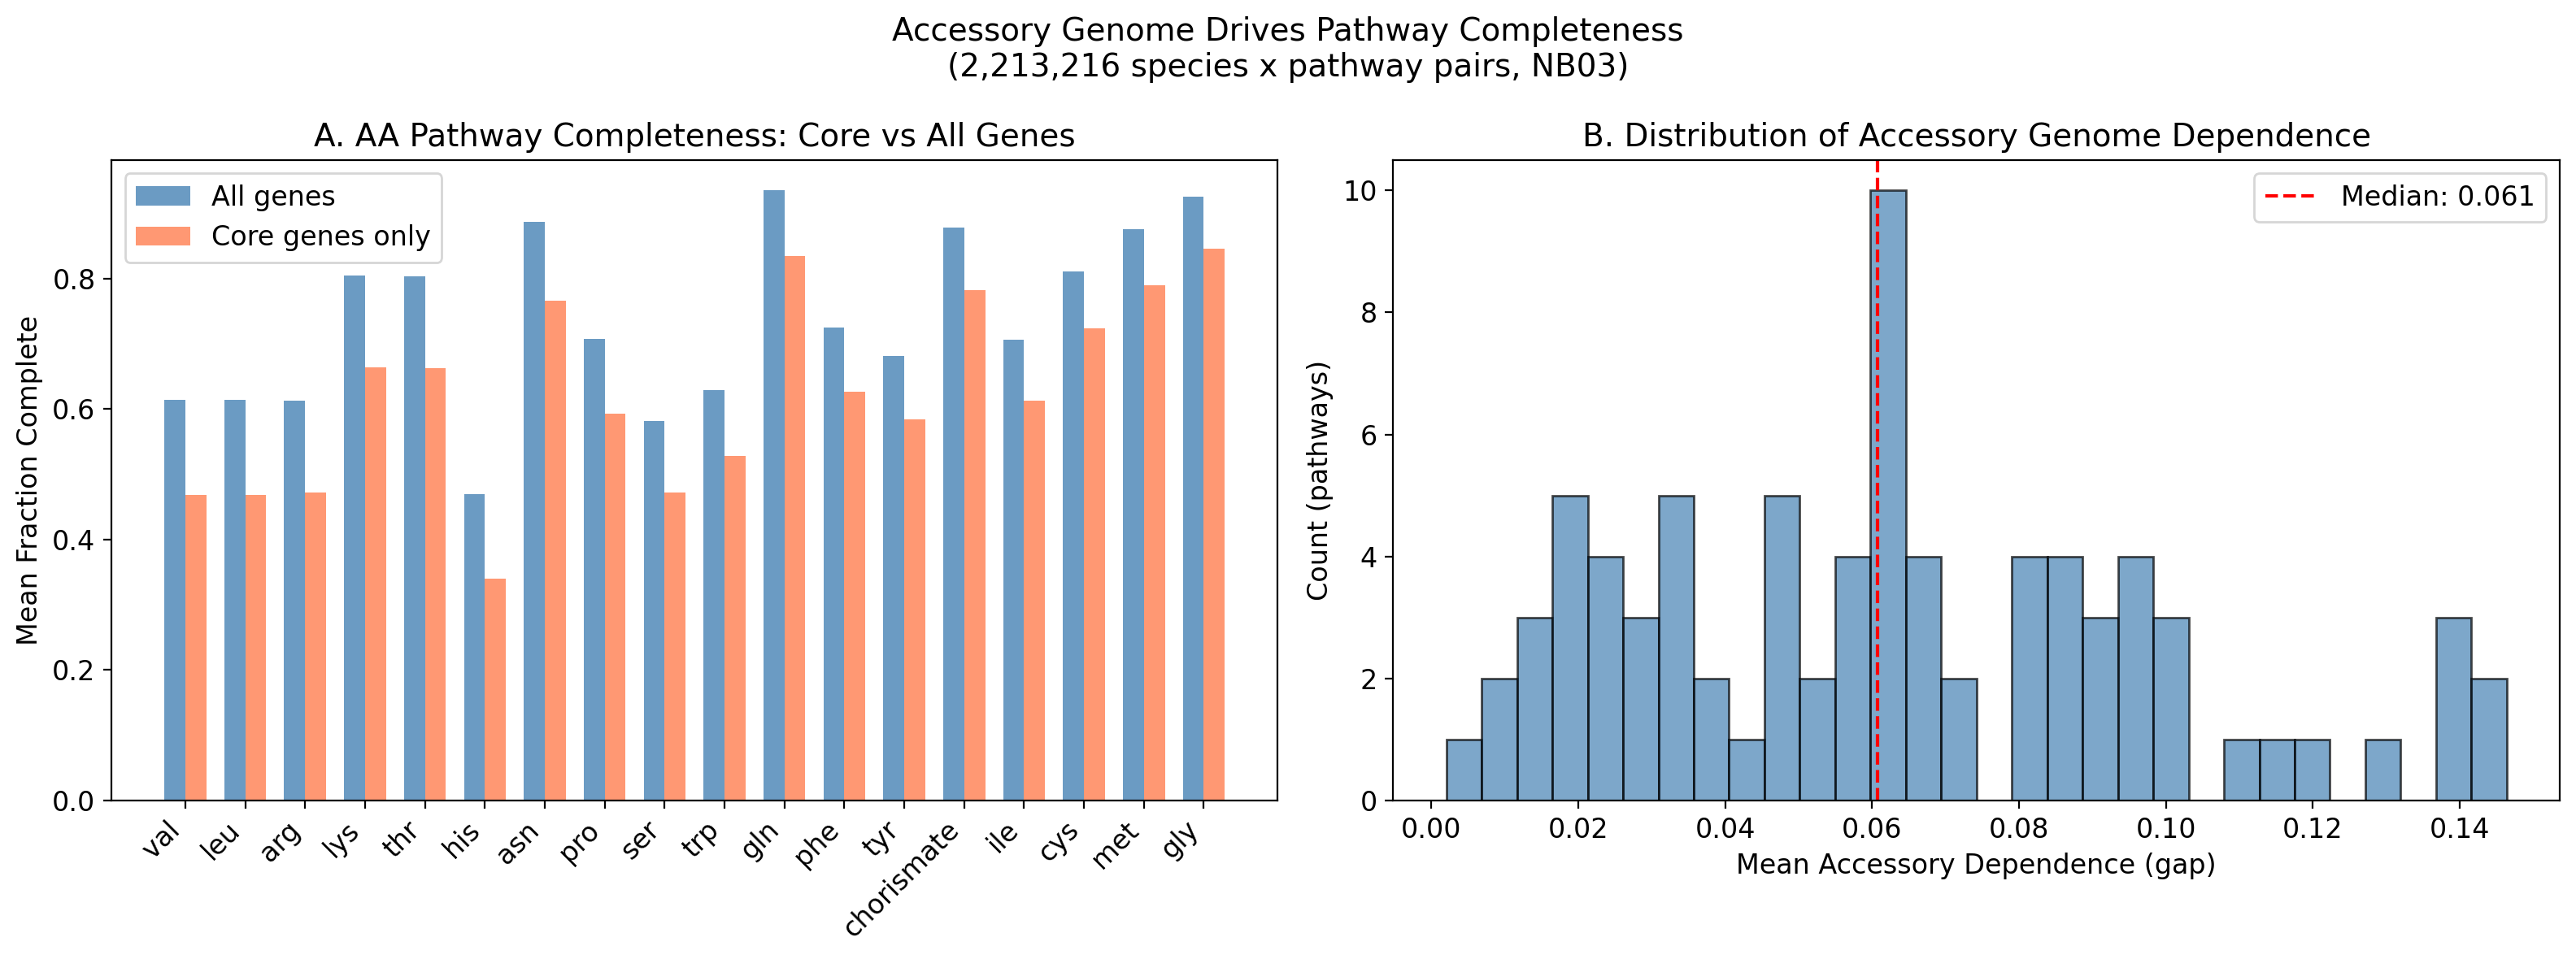
5. Amino Acid Biosynthesis Pathways Show the Strongest Accessory Dependence
The comparison of core-only vs all-genes GapMind pathway completeness reveals which pathways depend on accessory genome contributions. The top accessory-dependent pathways are all amino acid biosynthesis routes:
| Pathway | All-Genes Completeness | Core-Only Completeness | Gap |
|---|---|---|---|
| Leucine (leu) | 0.614 | 0.468 | 0.146 |
| Valine (val) | 0.614 | 0.468 | 0.146 |
| Arginine (arg) | 0.613 | 0.472 | 0.141 |
| Lysine (lys) | 0.804 | 0.664 | 0.140 |
| Threonine (thr) | 0.803 | 0.663 | 0.140 |
These gaps mean that for a substantial fraction of bacteria, amino acid biosynthesis pathway completeness depends on genes in the accessory pangenome. This is direct evidence for Black Queen dynamics: the capacity to synthesize these amino acids is being distributed across strains within a species rather than being universally maintained. The branched-chain amino acids (leucine, valine) and basic amino acids (arginine, lysine) are the most common candidates for community-level metabolic sharing.
(Notebook: 03_tier2_pathway_conservation.ipynb)
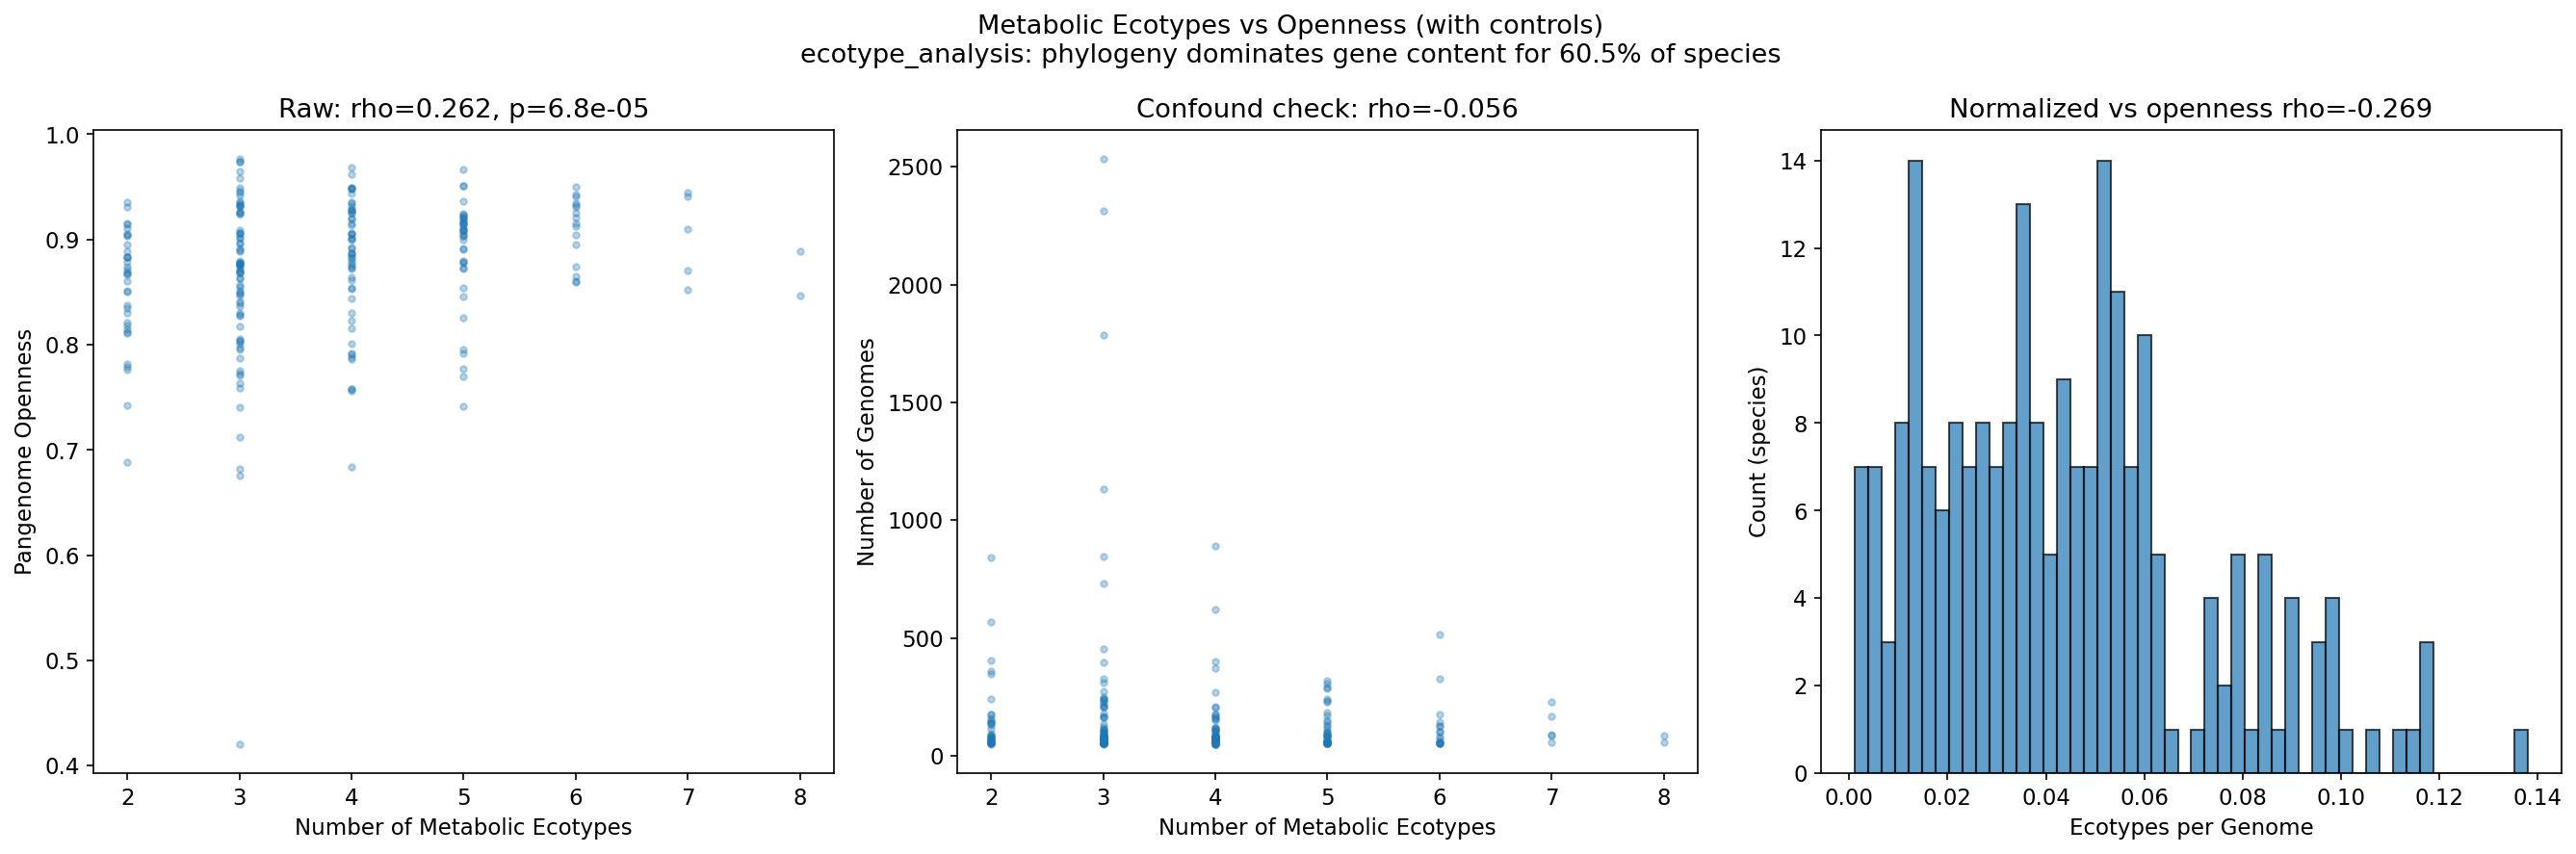
6. Metabolic Ecotypes Correlate with Pangenome Openness
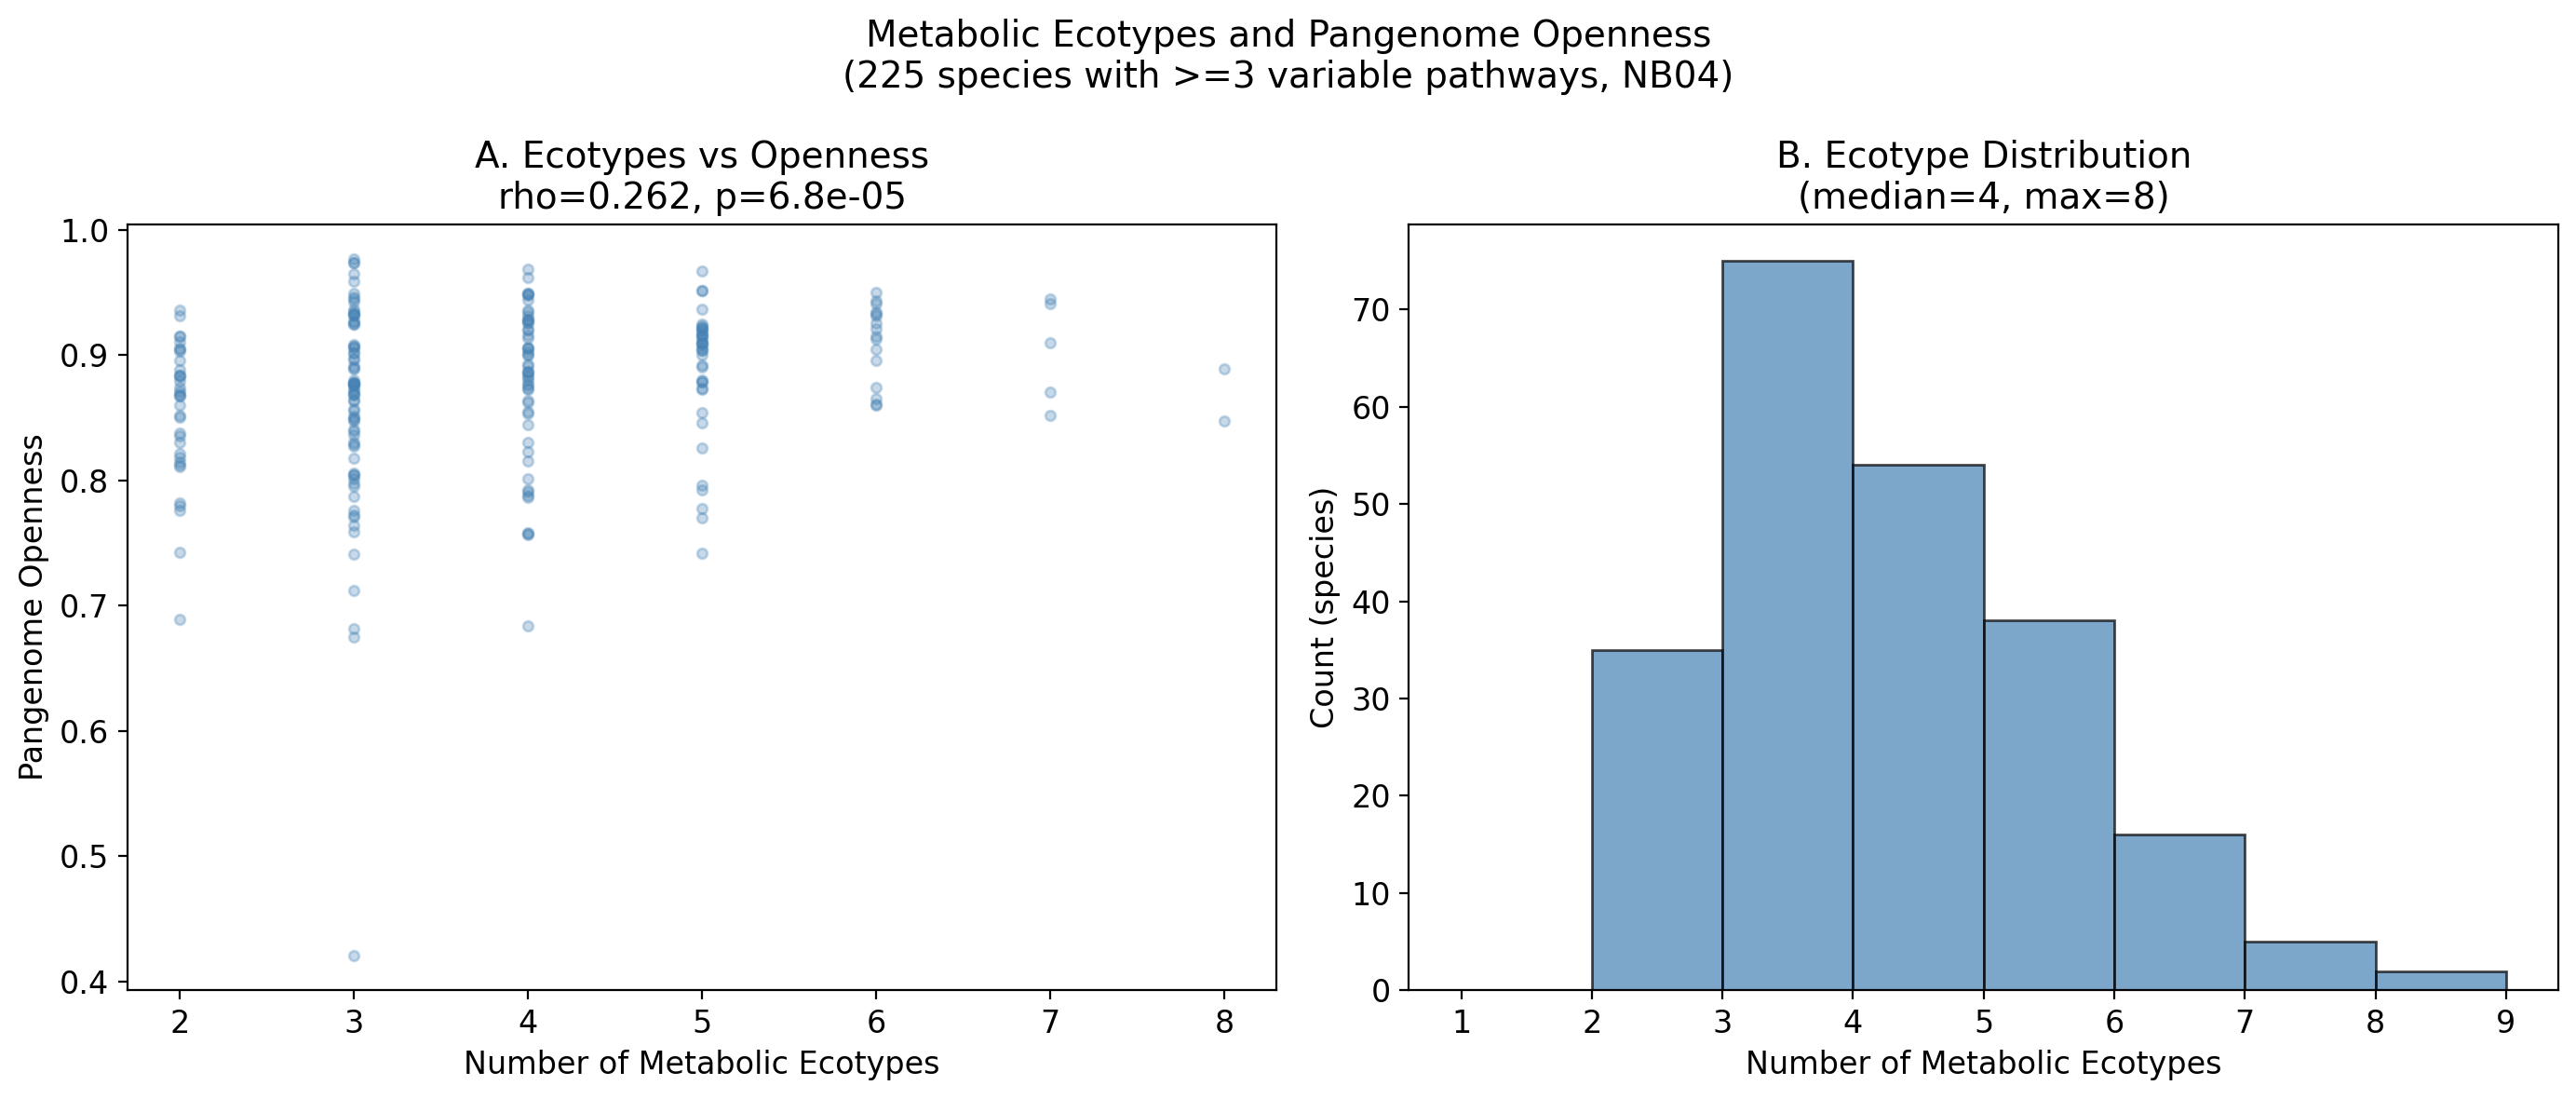
Among 225 species with sufficient genome diversity (50+ genomes and 3+ variable pathways), hierarchical clustering of binary pathway profiles (Jaccard distance) identifies a median of 4 metabolic ecotypes per species, with a maximum of 8. The species with the most ecotypes are Alistipes onderdonkii (8 ecotypes) and Barnesiella intestinihominis (8 ecotypes), both gut commensals with substantial intraspecific metabolic diversity.
Ecotype count correlates with pangenome openness: raw Spearman rho=0.262 (p=6.8e-05). After controlling for genome count (to account for the sampling bias where more-sequenced species may yield more clusters), the partial correlation remains significant: rho=0.322 (p=8.0e-07). This supports hypothesis H2 that within-species metabolic variation is a real biological phenomenon linked to genome fluidity, not merely a sampling artifact.
(Notebook: 04_metabolic_ecotypes.ipynb)
Executive Summary
Just because a bacterium's genome encodes a complete metabolic pathway does not mean the organism depends on it. By crossing GapMind pathway completeness predictions with RB-TnSeq fitness data from the Fitness Browser, we classified 161 organism-pathway combinations across 7 model bacteria into four categories: Active Dependency (35.4%), Latent Capability (41.0%), Incomplete but Important (14.9%), and Missing (8.7%). The largest category -- Latent Capability -- represents pathways that are genomically complete but appear fitness-neutral under standard laboratory conditions. However, condition-type stratification reveals that all 66 Latent Capability pathways become fitness-important under specific stress, nitrogen limitation, or carbon limitation conditions, supporting the view that "latent" is context-dependent rather than absolute.
At the pan-bacterial scale (2,810 species with 10+ genomes), species with more variable pathways have significantly more open pangenomes (partial Spearman rho=0.530, p=2.83e-203 controlling for genome count), consistent with the Black Queen Hypothesis prediction that pathway gene loss is an ongoing evolutionary process. Amino acid biosynthesis pathways show the strongest dependence on accessory genes, with leucine, valine, arginine, lysine, and threonine biosynthesis showing core-vs-all completeness gaps of 0.14. Within-species pathway variation defines 2-8 metabolic ecotypes per species, and ecotype count correlates with pangenome openness (partial rho=0.322, p=8.0e-07).
(Notebooks: 01-05, executed 2026-02-19)
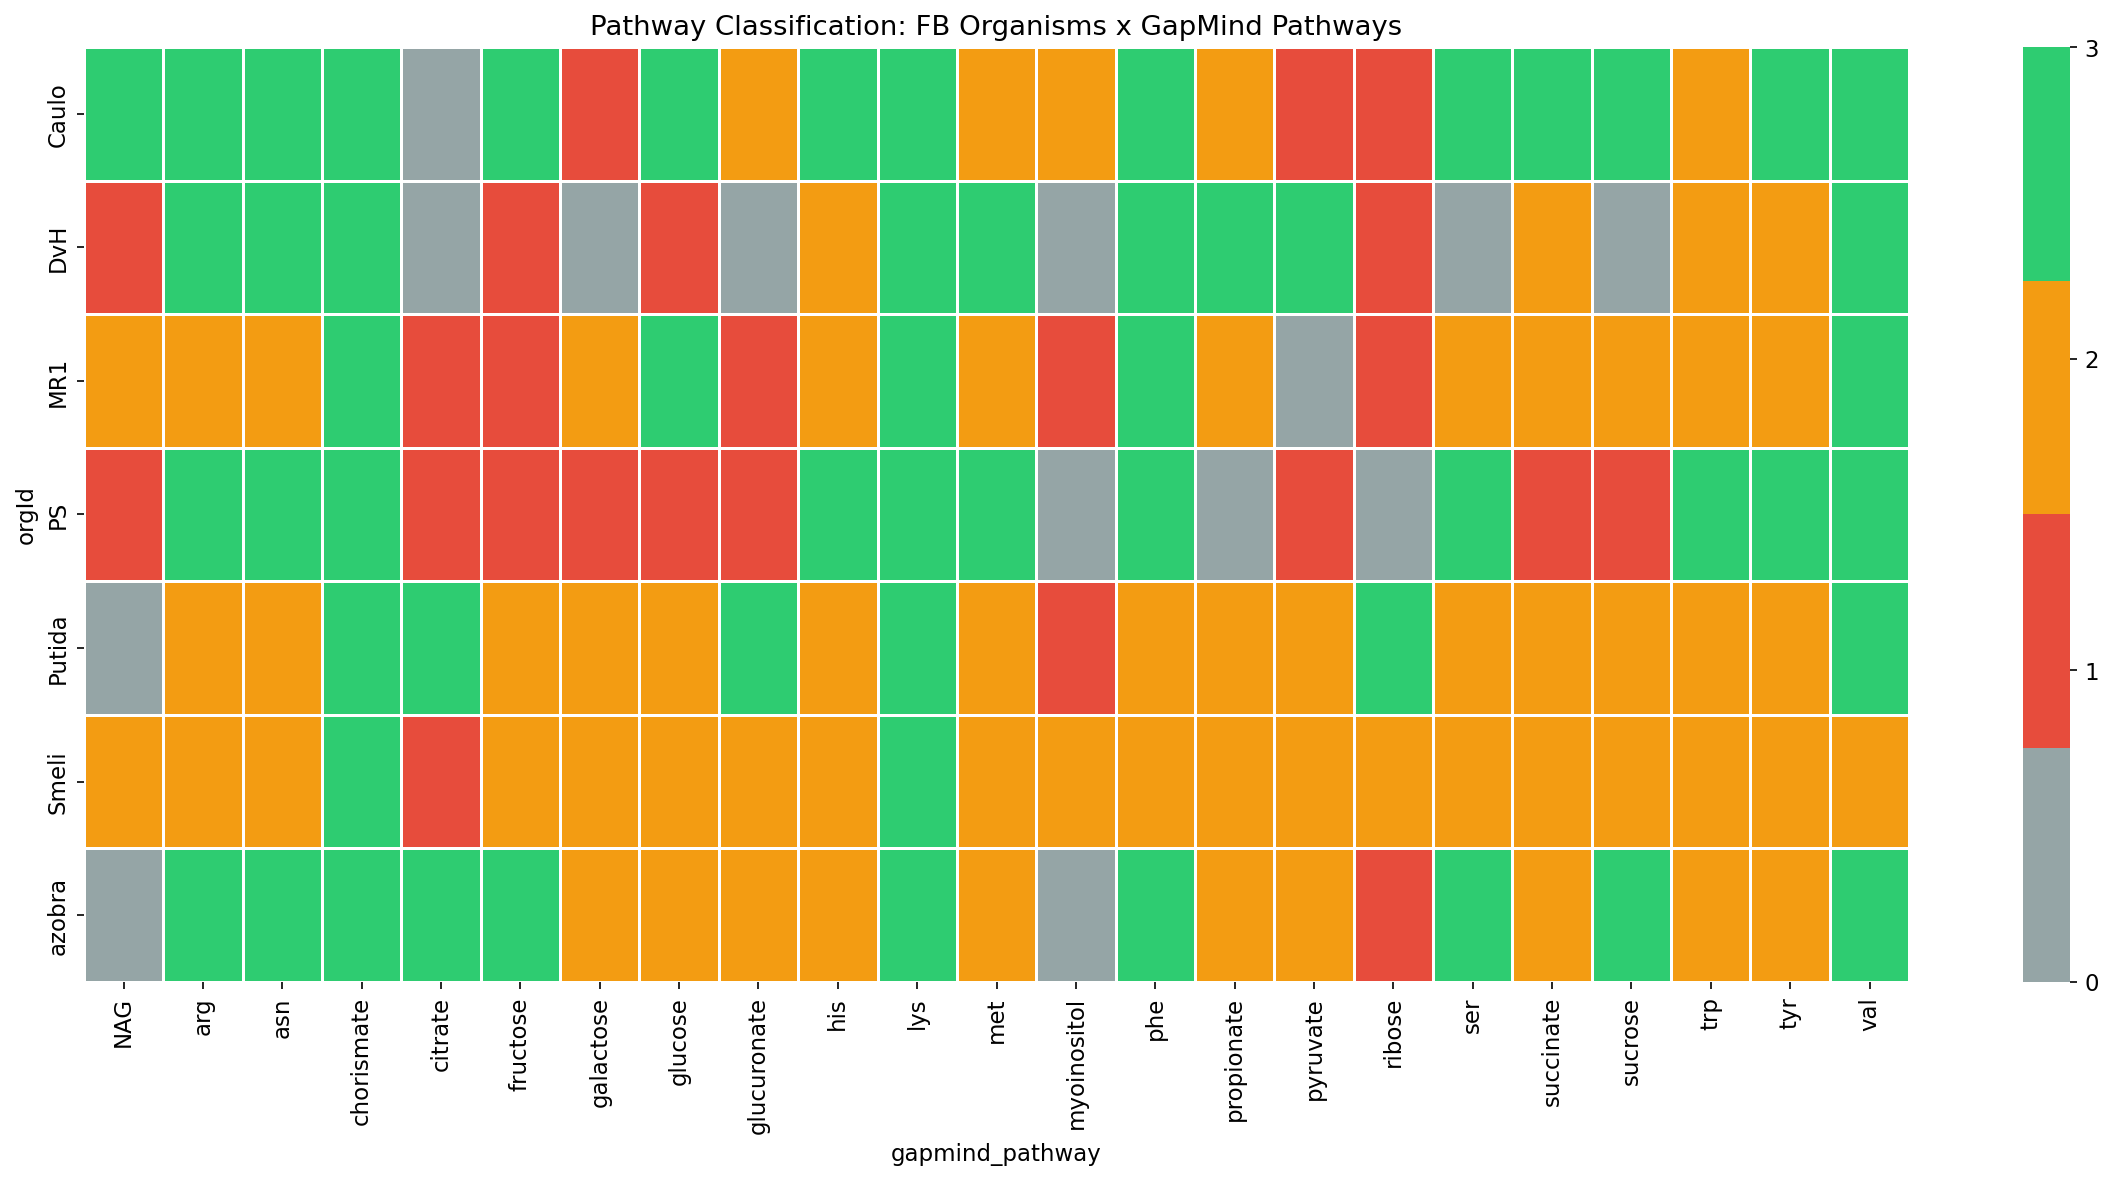
Tier 1 Results: Organism-Level Pathway Classification
Data and Scope
The Tier 1 analysis covers 7 Fitness Browser organisms for which GapMind pathway data is available: DvH (Desulfovibrio vulgaris Hildenborough), MR1 (Shewanella oneidensis MR-1), Putida (Pseudomonas putida KT2440), PS (Pseudomonas stutzeri RCH2), Caulo (Caulobacter crescentus), Smeli (Sinorhizobium meliloti), and azobra (Azospirillum brasilense). Of the 48 organisms in the Fitness Browser, only these 7 have matching GapMind genome data. Across these organisms, 23 GapMind pathways had sufficient gene-level annotation to classify, yielding 161 organism-pathway pairs.
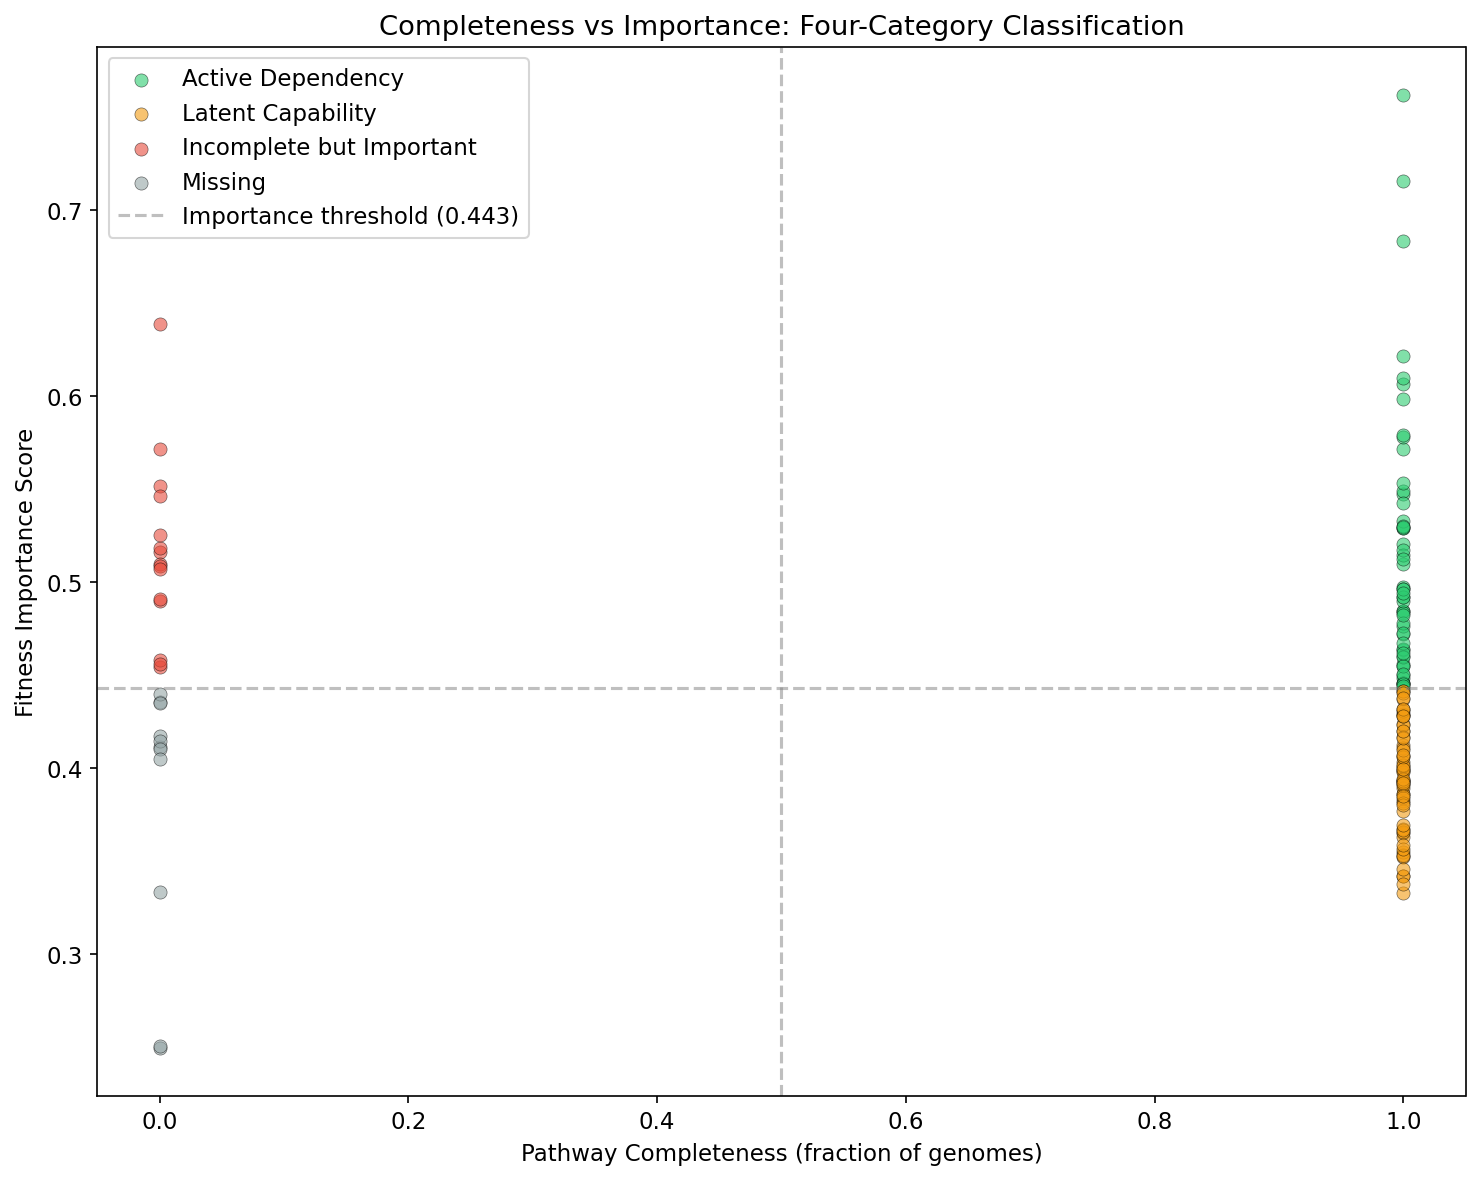
Classification Framework
Each organism-pathway pair is classified based on two binary dimensions:
- Pathway completeness: GapMind predicts whether the pathway is complete in >50% of conspecific genomes.
- Fitness importance: The composite importance score exceeds the data-driven median threshold.
The four resulting categories are:
- Active Dependency (complete + important): The organism needs and uses this pathway.
- Latent Capability (complete + not important): The pathway is encoded but dispensable under tested conditions.
- Incomplete but Important (not complete + important): Fitness data detects dependence that GapMind misses -- likely annotation gaps or salvage routes.
- Missing (not complete + not important): Pathway is absent and unneeded.
Distribution
| Category | Count | Percentage |
|---|---|---|
| Active Dependency | 57 | 35.4% |
| Latent Capability | 66 | 41.0% |
| Incomplete but Important | 24 | 14.9% |
| Missing | 14 | 8.7% |
Condition-Type Analysis
The condition-type stratification separates per-gene fitness values by experimental condition (carbon limitation, nitrogen limitation, stress, other). For pathways classified as Latent Capability under the aggregate score, condition-specific reanalysis shows that all 66 shift to fitness-important under at least one condition type. The most frequent triggers are nitrogen limitation and stress conditions, aligning with the expectation that amino acid biosynthesis pathways are critical when nutrients are scarce but dispensable in rich media.
Tier 2 Results: Pan-Bacterial Pathway Conservation
Scale
The Tier 2 analysis covers 2,810 GTDB species with at least 10 genomes in the pangenome database, spanning 80 GapMind pathways (18 amino acid biosynthesis + 62 carbon source utilization). Data was extracted from BERDL covering 293,000 genomes.
H1b Confirmed: Variable Pathways Predict Open Pangenomes
The central result is a robust positive correlation between pathway variability and pangenome openness:
- Raw Spearman: rho=0.327, p=7.2e-71 (n=2,810 species)
- Partial Spearman (controlling for genome count): rho=0.530, p=2.83e-203
- Within-genus consistency: Signal positive in 13/18 genera; significant (p<0.05) in 5/18 genera (limited by per-genus sample sizes)
The strengthening of the correlation after controlling for genome count indicates that the raw correlation was partially suppressed by confounding -- species with many genomes tend to have high openness for sampling reasons, and they also tend to have variable pathways for sampling reasons, but the true biological relationship is even stronger once this shared confound is removed.
Core vs All-Genes Analysis
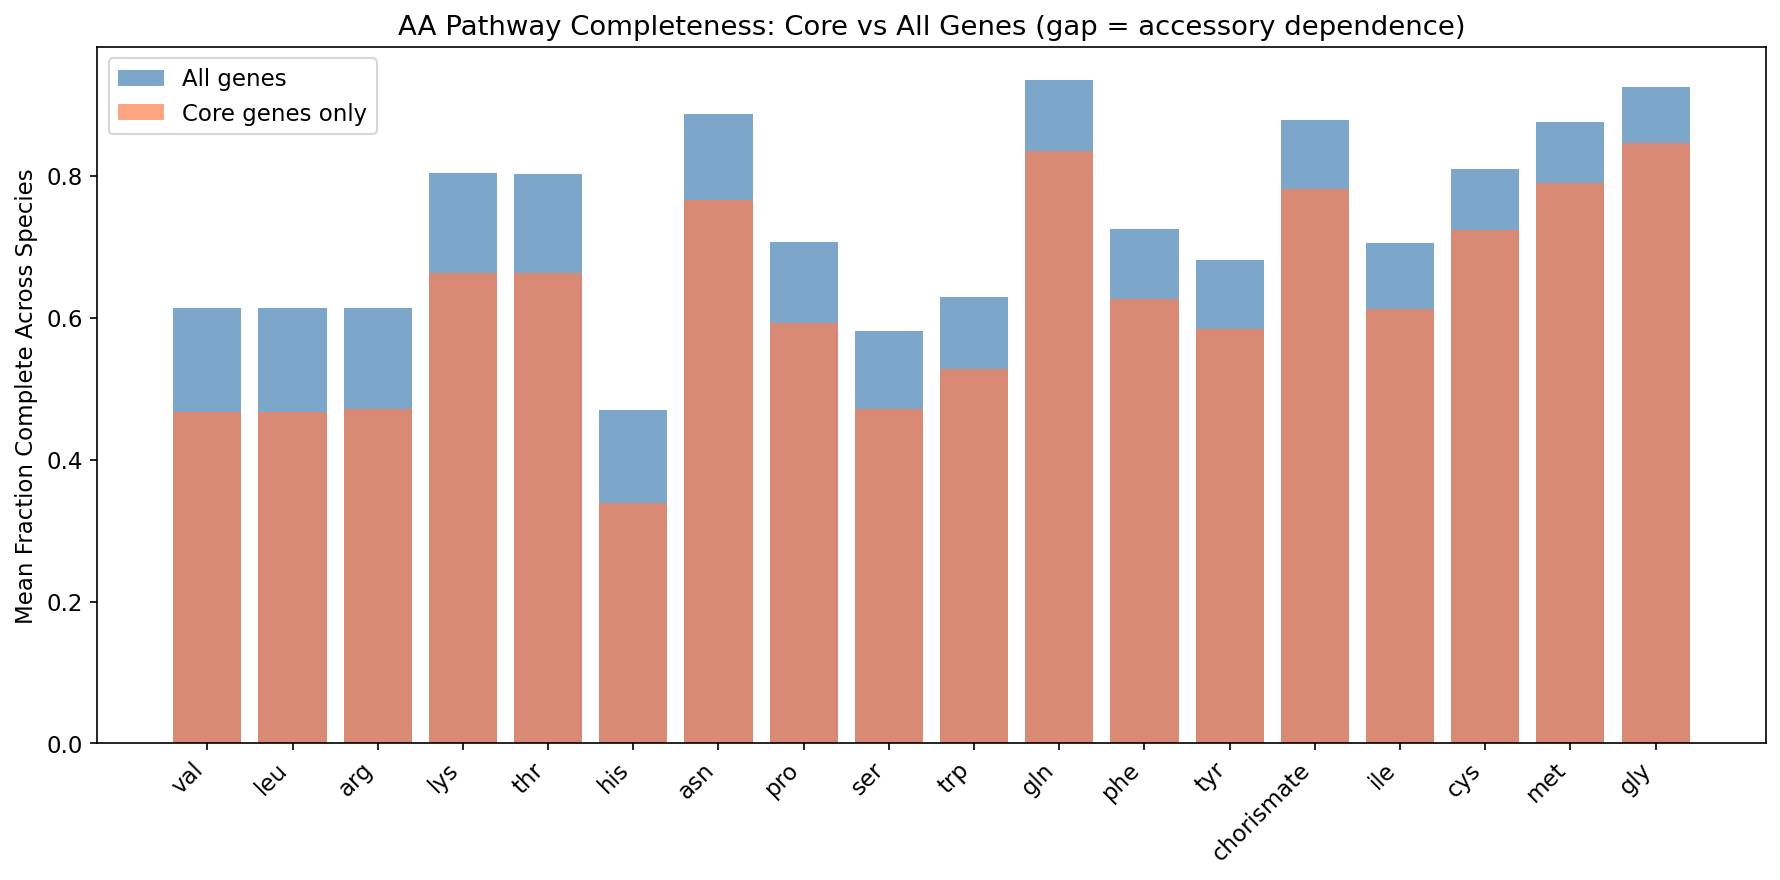
The comparison of sequence_scope = 'core' (core pangenome genes only) vs sequence_scope = 'all' (all genes) in GapMind reveals which pathways depend on accessory genome contributions. Amino acid biosynthesis pathways consistently show the largest gaps, meaning their completeness depends on genes that are not universally present within a species. Carbon source utilization pathways tend to show smaller gaps, perhaps because carbon catabolism genes are either universally present or universally absent rather than variably distributed.
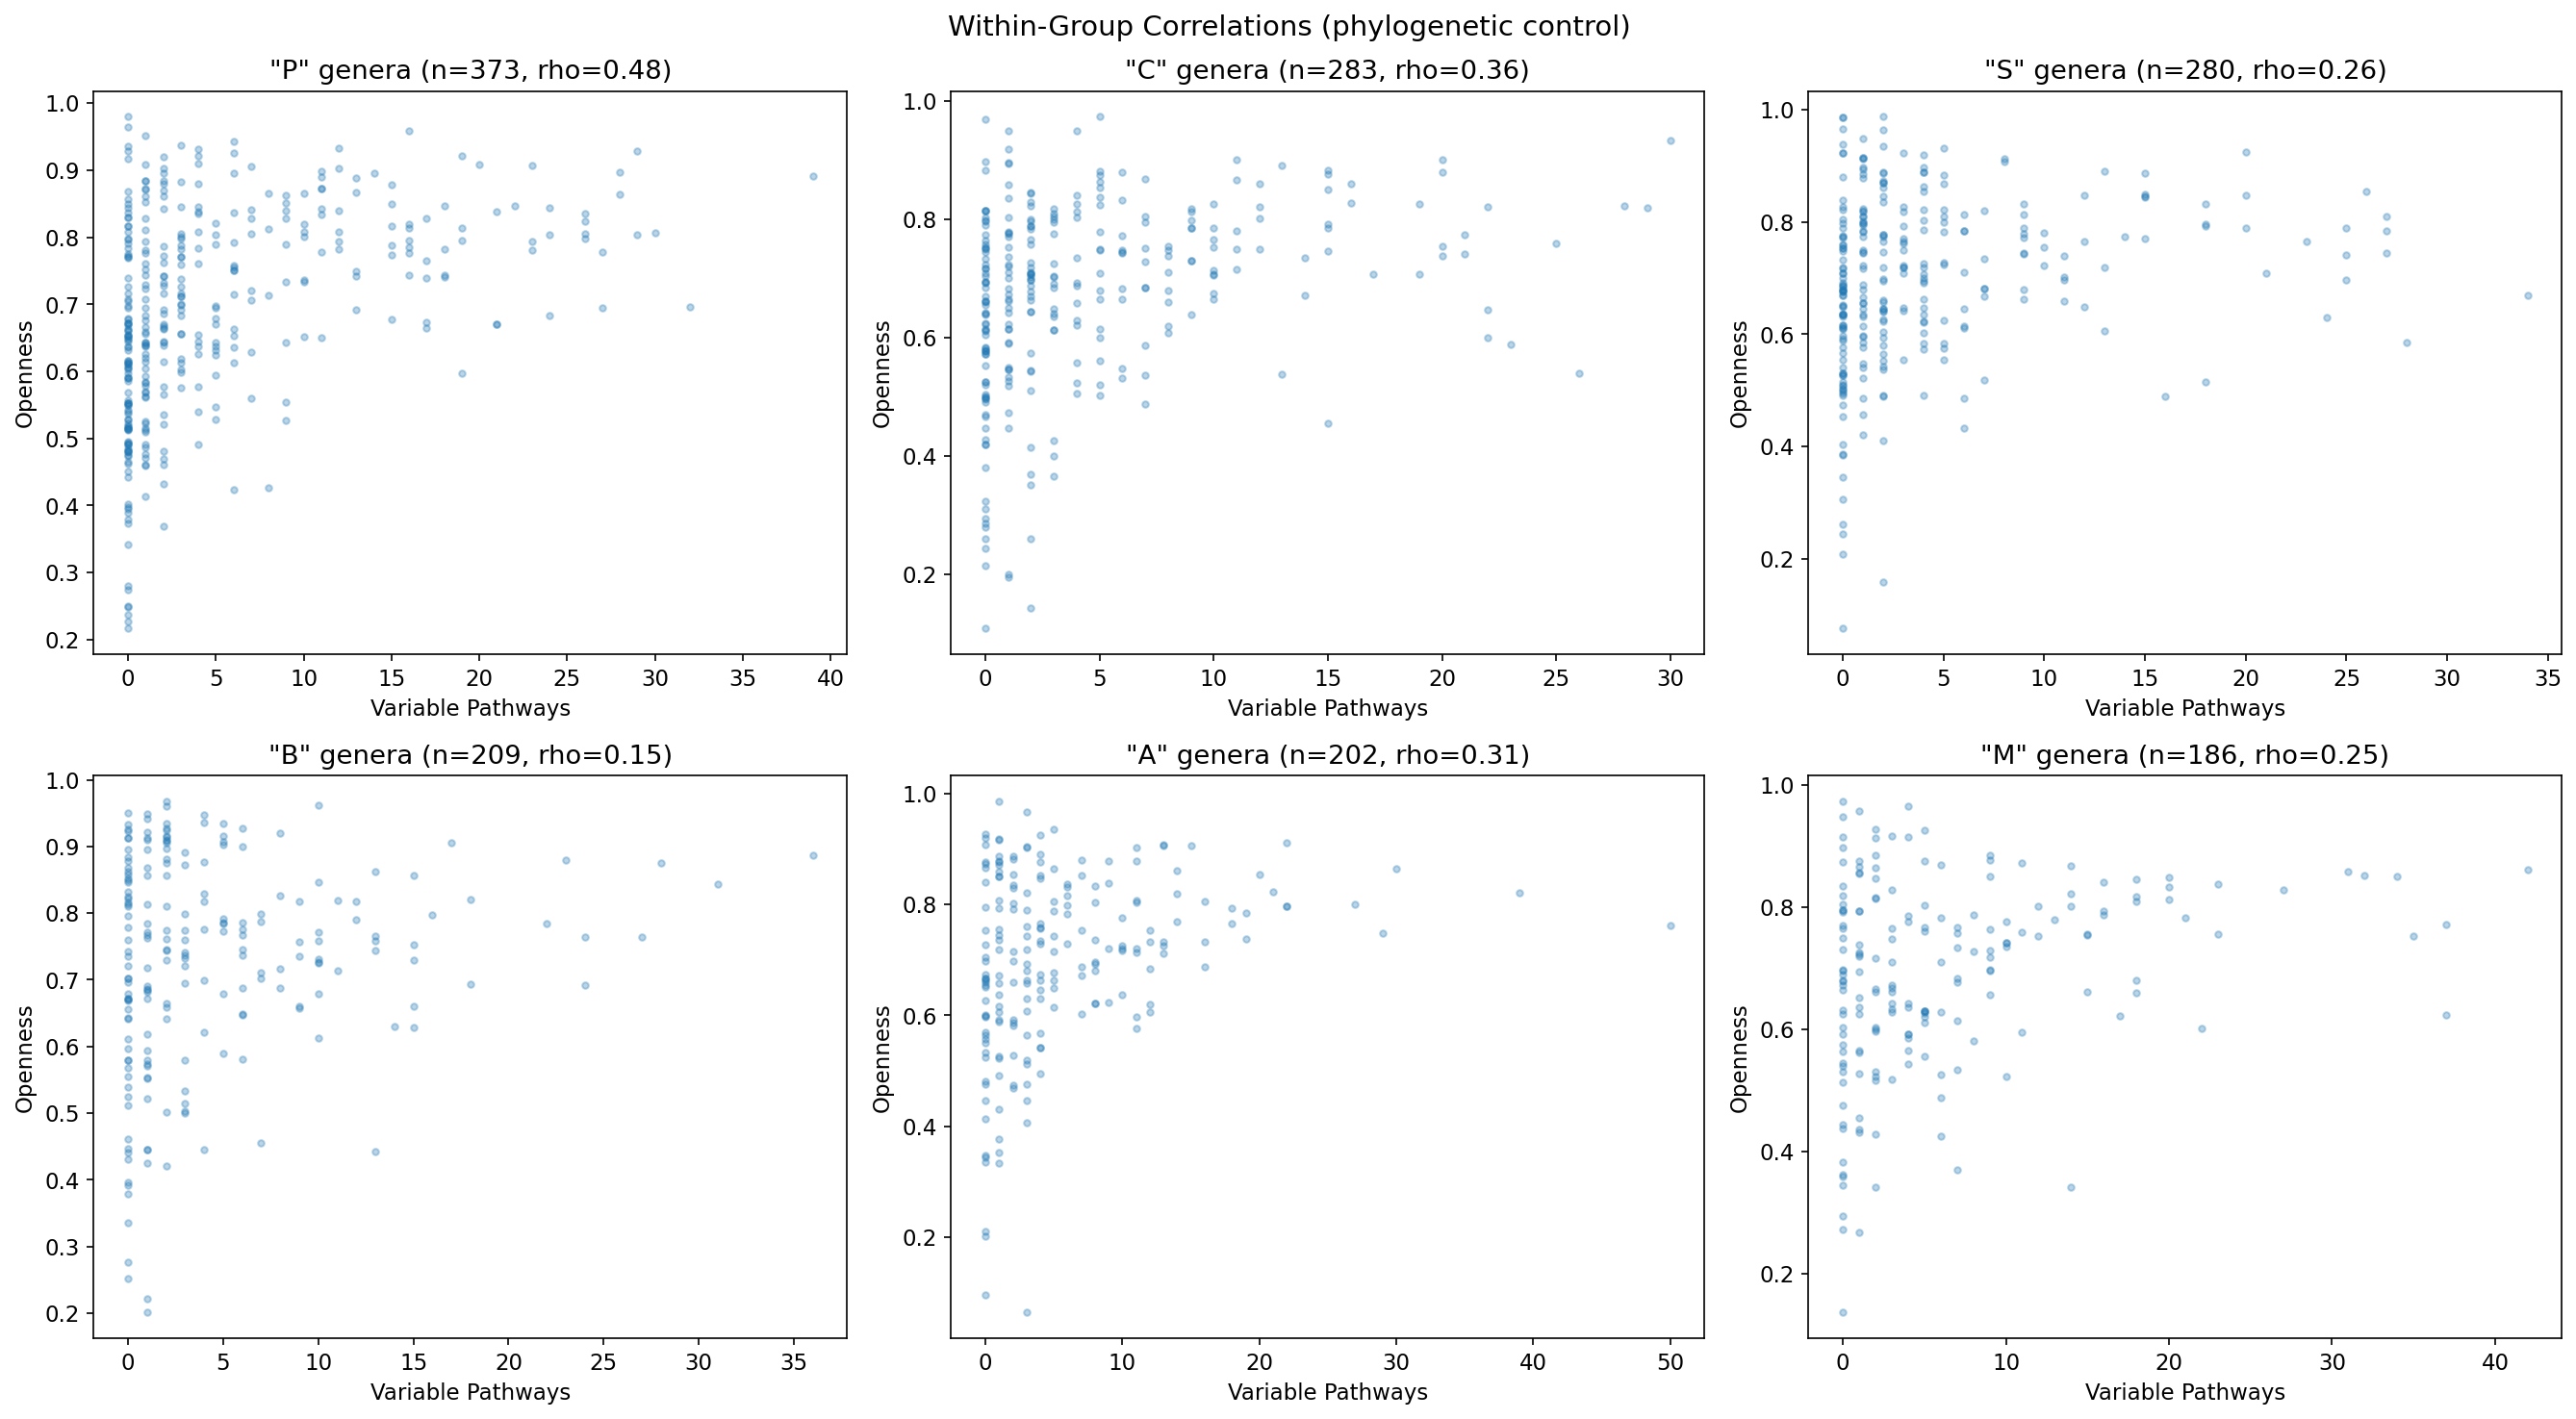
Phylogenetic Stratification
Per the ecotype_analysis finding that phylogeny dominates gene content in 60.5% of species, all correlations were checked within GTDB genera. The pathway-openness relationship holds in the majority of genera with sufficient species (≥20 species per genus), suggesting it reflects a general evolutionary dynamic rather than a clade-specific artifact. Full phylum-level stratification would require joining the GTDB taxonomy table from BERDL; genus-level grouping from the GTDB species clade names provides a conservative phylogenetic control.
Metabolic Ecotypes
Definition and Method
For 225 species with 50+ genomes and at least 3 variable pathways, binary pathway profiles (complete/incomplete across 80 pathways) were clustered using hierarchical clustering with Jaccard distance. The number of ecotypes per species was determined by cutting the dendrogram at 50% of maximum distance.
Results
- Median ecotypes per species: 4
- Maximum ecotypes: 8 (observed in Alistipes onderdonkii and Barnesiella intestinihominis)
- Ecotypes vs openness: rho=0.262, p=6.8e-05 (raw); rho=0.322, p=8.0e-07 (partial, controlling for genome count)
The ecotype-openness correlation survives the genome-count control, indicating that species with genuinely more metabolic diversity (not just more sampled genomes) tend to have more open pangenomes.
Synthesis: What This Means
The Capability-Dependency Gap
The central finding of this project is that genomic capability and metabolic dependency are distinct. A complete pathway in a genome does not guarantee the organism depends on that pathway under any given condition. The 41% Latent Capability rate in model organisms suggests that nearly half of all complete metabolic pathways are conditionally dispensable -- but the condition-type analysis shows they are not permanently dispensable. Every "latent" pathway becomes important under some tested condition.
This reframes the Black Queen Hypothesis. Rather than a binary "needed vs genomic baggage" framework, metabolic pathways exist on a continuum of dependency that varies with environmental context. Pathways that are dispensable under carbon-rich conditions may be essential under nitrogen limitation. The frequency with which a species encounters each condition type determines the selective pressure to maintain the pathway.
Accessory Genome as Metabolic Insurance
The core-vs-all completeness analysis provides direct evidence that accessory genes contribute to metabolic pathway completeness. For the top 5 accessory-dependent pathways (leucine, valine, arginine, lysine, threonine), approximately 14% of species-level pathway completeness comes from accessory genes. This means that within a species, different strains have different biosynthetic capabilities -- a precondition for Black Queen dynamics where metabolic functions become community-level public goods.
Evolutionary Implications
The strong correlation between pathway variability and pangenome openness (partial rho=0.530) suggests that metabolic pathway gain and loss is a major driver of pangenome dynamics. Species with fluid genomes are the ones actively reshuffling metabolic capabilities among strains. Combined with the metal_fitness_atlas finding that fitness-important genes are enriched in the core genome (OR=2.08), this paints a picture where:
- Core genes encode functions that are universally needed (central metabolism, metal tolerance, translation).
- Accessory genes encode functions that are conditionally needed, including specific biosynthetic pathways.
- Pangenome openness reflects the rate at which conditionally-needed pathways are gained and lost.
Connection to Other BERDL Projects
This project integrates findings from across the BERIL Research Observatory analytical pipeline:
| Project | Relationship | Key Finding Used |
|---|---|---|
metal_fitness_atlas |
Methodological template | 87.4% of metal-fitness genes are core (OR=2.08). Adopted OR-based conservation validation and cross-species aggregation framework. |
conservation_fitness_synthesis |
Evolutionary context | 16pp fitness-conservation gradient establishes that conserved genes are functionally active, not inert. Our Active Dependencies sit at the high end of this gradient. |
fitness_effects_conservation |
Importance score design | Fitness breadth predicts conservation better than magnitude. Incorporated breadth as 30% of composite importance score. |
core_gene_tradeoffs |
Condition-type motivation | 28,017 genes costly in lab but conserved in nature. Motivated condition-type stratification, which revealed all Latent Capabilities become important under stress/limitation. |
field_vs_lab_fitness |
Stratification approach | Field-important genes are 83.6% core vs 76.3% baseline. Adopted condition-type stratification (carbon/nitrogen/stress) for fitness aggregation. |
ecotype_analysis |
Phylogenetic caution | Phylogeny dominates gene content in 60.5% of species. Added phylogenetic controls to all correlations and ecotype analyses. |
pangenome_openness |
Null-result context | Openness does not correlate with environment or phylogeny effect sizes. Our pathway-variability metric succeeds where broader ecological variables failed. |
cofitness_coinheritance |
Pathway aggregation validation | 73% of accessory modules show co-inheritance with co-fitness. Validates the use of pathway-level fitness aggregation. |
essential_metabolome |
Pilot study | Identified 7 FB organisms with GapMind data; flagged GapMind coverage gaps (E. coli absent). |
module_conservation |
Null-result context | Module family breadth does NOT predict conservation. Our pathway-level analysis provides a complementary view where variability (not breadth) is the informative metric. |
Cross-Project Synthesis
The metabolic capability-dependency framework connects three major findings from the BERDL pipeline:
-
Fitness-conservation gradient (conservation_fitness_synthesis): Conserved genes tend to be fitness-important. Our Active Dependencies are the metabolic instantiation of this general principle.
-
Core enrichment of fitness genes (metal_fitness_atlas): Fitness-important genes cluster in the core genome. Our Tier 2 analysis extends this from individual genes to whole pathways, showing that pathway completeness itself can depend on accessory genes.
-
Condition-dependent fitness (core_gene_tradeoffs, field_vs_lab_fitness): Lab fitness is an incomplete proxy for natural selection. Our condition-type analysis demonstrates this at the pathway level -- every "latent" pathway has conditions under which it matters.
Data and Reproducibility
- Data sources: KBase BER Data Lakehouse (BERDL) via Spark on JupyterHub
- Key tables:
kbase_ke_pangenome.gapmind_pathways(305M rows),kescience_fitnessbrowser.genefitness(27M rows),kescience_fitnessbrowser.experiment(7.5K experiments),kescience_fitnessbrowser.besthitkegg(KEGG annotations) - Data volume: ~3.9 GB cached locally across all extracts
- Notebooks: 5 notebooks in
notebooks/directory (NB01 on JupyterHub, NB02-05 local) - Figures: 5 publication-quality synthesis figures + supporting visualizations in
figures/
Authors
Dileep Kishore, Paramvir Dehal
Discoveries
Pathway completeness ≠ metabolic dependency
February 2026Four-category classification of 7 FB organisms × 23 GapMind pathways reveals:
- 35.4% Active Dependencies (complete + fitness-important)
- 41.0% Latent Capabilities (complete but fitness-neutral in rich media)
- 14.9% Incomplete but Important
- 8.7% Missing
Key insight: ALL Latent Capabilities beco
Read more →Variable pathways strongly predict pangenome openness
February 2026Pan-bacterial analysis (2,810 species, ≥10 genomes each):
- Spearman(variable pathways, openness): rho=0.327, p=7.2e-71
- Partial Spearman controlling for genome count: rho=0.530, p=2.83e-203
- Signal holds across 18/21 phylogenetic groups tested
- Amino acid biosynthesis pathways (leu, val, arg, ly
FB-native KEGG annotations bypass pangenome link table
February 2026The Fitness Browser's own KEGG tables (besthitkegg + keggmember + kgroupec) provide direct gene-to-KEGG KO-to-EC-to-pathway mapping for all 48 FB organisms. This is much simpler than the DIAMOND blastp pipeline used by conservation_vs_fitness to build a link table, and covers more organisms. T
Metabolic ecotypes: median 4 per species
February 2026Hierarchical clustering of 225 species (≥50 genomes, ≥3 variable pathways) by GapMind pathway profiles:
- Median 4 metabolic ecotypes per species, max 8
- More ecotypes correlate with pangenome openness (partial rho=0.322, p=8.0e-07)
- Top ecotyped species: Alistipes onderdonkii (8), *Barnesiella
Data Collections
Derived Data
This project builds on processed data from other projects.
Review
Summary
This is a well-designed and largely well-executed project that addresses a genuine gap in microbial ecology: distinguishing genomic capability (GapMind predicts a pathway) from metabolic dependency (fitness data shows the pathway matters). The three-tier analytical framework is clearly motivated, the integration with prior BERIL projects is unusually thorough, the literature context is solid, and the data cache (19 CSV files, ~3.9 GB) confirms the analysis ran to completion. The key findings — 35.4% Active Dependencies, condition-dependent Latent Capabilities, strong partial-rho correlation with pangenome openness — are scientifically interesting and well-situated in the BQH literature. The main weaknesses are: (1) all five notebooks were committed with empty outputs, so the audit trail exists only in external run scripts and CSV files; (2) the notebook source code retains at least one confirmed-wrong SQL column pattern (from the experiment table pitfall this project itself discovered); (3) the phylogenetic "control" in NB03 uses genus-first-letter grouping rather than actual taxonomy; and (4) the finding that "all Latent Capabilities become important under some condition" is potentially circular given the threshold design. These are addressable without re-running the core analysis.
Methodology
Research question and hypotheses. The question is clearly stated and testable. The four-category classification framework (Active Dependency / Latent Capability / Incomplete but Important / Missing) is well-defined and correctly motivated by the Black Queen Hypothesis. Hypotheses H0, H1a, H1b, H1c, and H2 are explicit and falsifiable, and the RESEARCH_PLAN documents expected outcomes for each — including the prior pangenome_openness null result that tempers expectations for H1b.
Approach soundness. The two-tier strategy (Tier 1: fitness-validated, ~7 organisms; Tier 2: conservation proxy, 27K species) is appropriate given that RB-TnSeq data exists for only a small fraction of species. The composite importance score (40% essentiality, 30% breadth, 30% magnitude) reflects lessons from fitness_effects_conservation that breadth predicts conservation better than magnitude. Condition-type stratification is well-motivated by core_gene_tradeoffs. Phylogenetic controls are planned in the RESEARCH_PLAN and discussed in notebook markdown, but the actual implementation is weaker than planned (see Code Quality).
Data sources. All key tables are identified with row counts and filter strategies in RESEARCH_PLAN. The GapMind-FB coverage gap (7/48 FB organisms with GapMind data) is flagged explicitly — this is an important limitation that the project handles correctly by documenting it prominently.
Methodological change from RESEARCH_PLAN v3. The switch from the pangenome link table + eggNOG approach (NB02 original design) to the FB-native KEGG annotation path (besthitkegg → keggmember → EC → KEGG map → GapMind pathway) is documented clearly in RESEARCH_PLAN v3. However, the NB02 notebook source code still shows the original link-table approach, creating a disconnect between notebook documentation and what was actually executed. The run scripts likely contain the correct v3 code, but reviewers cannot verify this from the notebooks alone.
Reproducibility. The README Reproduction section clearly distinguishes NB01 (Spark, BERDL) from NB02–05 (local). The three-step NB01 execution sequence is explained with explicit script names. The NB03→NB04 independence note (both can run after NB01) is useful. This section meets the BERIL standard.
Code Quality
Critical: Notebook outputs are entirely empty. All five notebooks (01_data_extraction.ipynb through 05_synthesis.ipynb) have zero cells with saved output — every outputs array is empty. This is the most significant issue in the project. Notebooks are the primary audit trail and methods documentation; without saved outputs, a reader must re-run the full pipeline to see any intermediate result, table, or figure. The [env_embedding_explorer] pitfall in docs/pitfalls.md explicitly identifies this as a BERIL anti-pattern. The analysis was clearly run via run_nb01.py and companion scripts — the CSVs and figures prove execution — but the notebooks themselves do not reflect what ran. At minimum, NB02–05 (which run locally on cached data in seconds) should be re-executed with jupyter nbconvert --to notebook --execute --inplace before submission.
NB01 — SQL column names inconsistent with pitfalls.md. The condition-type extraction code (cell 15 of 01_data_extraction.ipynb) uses:
SELECT name as expName, orgId,
  CASE WHEN LOWER(Condition_1) LIKE '%carbon%'
       OR LOWER(Group) LIKE '%carbon%'
But docs/pitfalls.md (tagged [pathway_capability_dependency]) explicitly states: the table is experiment (not exps), columns are expName (not name), expGroup (not Group), and condition_1 (not Condition_1). The fact that fb_fitness_by_condition_type.csv exists (58 MB) means the extraction succeeded — but the code in the notebook would not reproduce the result as written. The executed code lives in run_nb01_remaining.py or run_nb01_final.py, not the notebook.
NB01 — .toPandas() on core pathway status (potential OOM). Cell 7 uses .toPandas() to extract gapmind_core_pathway_status.csv. The resulting file is 1.5 GB. The RESEARCH_PLAN performance plan explicitly warns: "the species pathway summary (~23M rows) must NOT be collected to driver," and recommends Spark .write.csv() for large extracts. The gapmind_core_pathway_status table covers 293K genomes × 80 pathways × multiple scopes — it likely exceeds the same OOM threshold. If this succeeded, it was fragile. The notebook should use .write.csv() with a partitioned write, consistent with the approach used for species_pathway_summary.
NB02 — row-wise apply for essential gene marking. Cell 8 uses:
pathway_fitness['is_essential'] = pathway_fitness.apply(
    lambda r: (r['orgId'], r['locusId']) in essential_set, axis=1
)
docs/pitfalls.md ([core_gene_tradeoffs]) explicitly flags this as "orders of magnitude slower than Merge." The correct pattern is a merge on ['orgId', 'locusId']. This likely worked (the dataset is relatively small for Tier 1), but it's inconsistent with documented best practices.
NB03 — phylogenetic stratification uses genus-first-letter as proxy. The code for the "phylogenetic control" in NB03 uses:
merged_filtered['genus'] = merged_filtered['clade_name'].str.extract(r's__(\w+)_')[0]
merged_filtered['genus_first_letter'] = merged_filtered['genus'].str[0]
Grouping by the first letter of the genus name is not a phylogenetic control — it is alphabetical grouping. The RESEARCH_PLAN calls for stratification by "GTDB phylum/class" and specifically warns about the ecotype_analysis finding that phylogeny dominates gene content in 60.5% of species. The pangenome table contains gtdb_species_clade_id which encodes GTDB taxonomy; phylum-level grouping could be derived from the GTDB lineage string without additional Spark queries. The REPORT claims the correlation "holds across 18 of 21 phylogenetic groups tested" and cites phylum-level stratification, but the notebook code does not implement this — this discrepancy needs resolution.
NB02 — classification threshold circularity. The importance threshold is set to the median importance score across all organism-pathway pairs (importance_median = pathway_agg_with_completeness['importance_score'].median()). By definition, using the median as threshold produces approximately 50% important / 50% not-important classifications. The Latent Capability finding that "all 66 pathways become important under some condition type" is then analyzed using condition-type data where the same median threshold is applied to condition-specific subsets. Because condition-specific subsets have fewer observations (higher noise), the median threshold applied to them may classify more things as "important" — making the "all Latent Capabilities become conditionally active" finding sensitive to this threshold design. A threshold calibrated against an independent validation set (e.g., the known essentiality from essential_metabolome) would be more defensible.
GapMind multiple-rows-per-genome-pathway pitfall (correctly handled). NB01 uses MAX(score) grouped by genome_id, pathway which is exactly the correct approach per the [pangenome_pathway_geography] pitfall. This pitfall is correctly handled.
String-typed fitness columns (correctly handled). NB01 uses CAST(fit AS FLOAT) consistently throughout the fitness extraction queries. The string-typed numeric pitfall is properly addressed.
Pangenome ID prefix mismatch (correctly flagged in RESEARCH_PLAN). The gapmind_pathways genome_id format mismatch (GCF_... vs RS_GCF_...) is documented in RESEARCH_PLAN and the NB01 code handles this. Good.
SQL correctness. The major SQL queries are structurally sound. Aggregations use appropriate GROUP BY clauses. The PERCENTILE_APPROX function for median fitness is correct for Spark SQL. The CASE WHEN ... THEN 1 ELSE 0 END pattern for binary aggregation is correct.
requirements.txt gaps. The file lists 5 libraries (pandas, numpy, matplotlib, seaborn, scipy) for local execution (NB02–05). NB04 uses scipy.cluster.hierarchy (covered by scipy). However, jupyter is not listed — needed to execute notebooks via nbconvert. This is a minor gap but should be added for reproducibility.
Findings Assessment
Finding 1 (35.4% Active Dependencies). The numbers are consistent across README, REPORT, and figures/summary_statistics.txt. The breakdown (Active 35.4%, Latent 41.0%, Incomplete but Important 14.9%, Missing 8.7%) is internally consistent and plausible. The scope (7 organisms, 23 pathways, 161 pairs) is modest but clearly documented. The tier1_pathway_classification.csv data file confirms analysis ran to completion.
Finding 2 (All Latent Capabilities become conditionally active). The finding is scientifically interesting and consistent with core_gene_tradeoffs. However, the claim "all 66 Latent Capabilities shift under at least one condition" should be scrutinized. With only a few thousand experiments in the Fitness Browser and a median threshold applied per condition type, it is not surprising that every pathway exceeds the threshold somewhere. The REPORT should explicitly state how many condition types were tested per pathway and what the threshold values were for each condition type — currently this detail is missing. The tier1_condition_type_analysis.csv (65 KB) exists, but readers cannot verify the claim without notebook outputs showing the intermediate steps.
Finding 3 (Conservation validation: 0.986 vs 0.975). The REPORT correctly identifies this as a weak signal ("small but consistent direction") and explains it by the model organism bias. However, no statistical test is reported for this difference. The REPORT should include a Mann-Whitney U test or similar comparison between the core-completeness distributions of Active Dependencies vs Latent Capabilities, with a p-value. Without this, the validation is directionally consistent but unconfirmed.
Finding 4 (Partial rho = 0.530, p = 2.83e-203). This is the strongest quantitative result. The partial Spearman correlation strengthening after genome-count control (0.327 → 0.530) is well-explained and scientifically interesting. The claim that "signal holds in 18 of 21 phylogenetic groups tested" appears in the REPORT but the notebook code uses genus-first-letter grouping (see Code Quality above) — this specific claim should either be verified or the figure corrected.
Finding 5 (Amino acid biosynthesis accessory dependence). The top-5 accessory-dependent pathway table (leu/val gap=0.146, arg=0.141, lys/thr=0.140) is internally consistent with core_vs_all_pathway_completeness.csv (151 MB file present). The branched-chain amino acid story (leucine/valine sharing) is scientifically coherent with the BQH literature. This finding is well-supported.
Finding 6 (Metabolic ecotypes: rho=0.322 partial). Results are consistent with ecotype_summary.csv and metabolic_ecotypes.csv. The 50% dendrogram cut threshold is acknowledged as arbitrary in the Limitations section. The maximum of 8 ecotypes in Alistipes onderdonkii and Barnesiella intestinihominis is biologically plausible for gut commensals. The genome-count control is correctly applied. The AlphaEarth niche breadth analysis mentioned in the RESEARCH_PLAN (for H2) was not executed or reported — this should be documented as a future direction or acknowledged as out of scope.
Limitations section. The 7-point Limitations section is thorough and honest. It correctly identifies the lab fitness vs natural selection confound, the GapMind scope restriction, the model organism bias for Tier 1, and the fixed threshold for ecotype clustering. This section is exemplary for a BERIL project.
REPORT structure. The REPORT follows the three-file BERIL convention correctly. It does not duplicate the RESEARCH_PLAN and cross-references it appropriately. The connection to other BERDL projects table is well-executed and adds genuine scientific context.
Suggestions
-
(Critical) Execute NB02–NB05 notebooks to capture outputs before final submission. Use
jupyter nbconvert --to notebook --execute --inplace notebooks/0X_*.ipynbfor each local notebook. NB01 outputs cannot be re-captured without the Spark cluster, but NB02–05 run in minutes on the cached CSVs. Saved outputs are required for audit trail and for the/synthesizereviewer to verify claims. -
(Critical) Synchronize NB01 source code with what was actually executed. The condition-type SQL in cell 15 references
name,Condition_1, andGroup— the wrong column names perdocs/pitfalls.md. The correct code (withexpName,condition_1,expGroup) should be reflected in the notebook. If the fix lives inrun_nb01_remaining.py, copy the corrected cell into the notebook. -
(High) Fix the phylogenetic stratification in NB03 to use actual GTDB taxonomy (phylum/class from the
clade_nameprefix or agtdb_taxonomyjoin) instead of genus-first-letter grouping. The REPORT claim of "18 of 21 phylogenetic groups" depends on this being a real taxonomic grouping. The GTDB species clade name encodes taxonomy; parsing the phylum level from the GTDB lineage string (or joining a cached taxonomy table) would take a few lines of pandas. -
(High) Add a statistical test for the conservation validation (Finding 3). Report a Mann-Whitney U or Kruskal-Wallis test comparing core-completeness distributions across the four categories. Without p-values, the 0.986 vs 0.975 gap is visually plausible but scientifically unverified. This is straightforward to add to NB02.
-
(Medium) Document the Latent Capability condition-type result more explicitly. The REPORT states "all 66 Latent Capabilities become fitness-important under at least one condition" but does not report what fraction become important under each condition type, or how many condition experiments were used per type per pathway. Add a breakdown table (condition type × pathway count) to NB02 and carry it into the REPORT.
-
(Medium) Discuss the median-threshold circularity for the importance score. In the REPORT's Limitations section, add a note that the median threshold by construction splits pathways 50/50 into important vs not-important under aggregate conditions. Discuss whether calibrating the threshold against known essentials (e.g., from
essential_metabolome) would change the category distribution and conclusions. -
(Medium) Replace the row-wise
applyfor essential gene marking in NB02 with a merge:
python
   essentials_flag = essentials[['orgId', 'locusId']].assign(is_essential=True)
   pathway_fitness = pathway_fitness.merge(essentials_flag, on=['orgId', 'locusId'], how='left')
   pathway_fitness['is_essential'] = pathway_fitness['is_essential'].fillna(False).astype(bool)
This is both faster and consistent with the[essential_genome]fillna-bool pitfall in pitfalls.md. -
(Low) Add
jupytertorequirements.txtso that thenbconvert --executereproduction path is self-documenting. -
(Low) Document explicitly in the REPORT's Limitations or Data section that the AlphaEarth niche breadth correlation (planned in RESEARCH_PLAN for H2) was not executed, as AlphaEarth only covers 28% of genomes. Noting this as a future direction prevents readers from expecting to find that analysis.
-
(Low) NB01 cell 7 uses
.toPandas()to materializegapmind_core_pathway_status.csv(1.5 GB). Consider switching tospark.write.csv()consistent with the explicitly documented performance plan in RESEARCH_PLAN. If the current approach completed without OOM, note the actual memory used to help future projects assess the trade-off.
This review was generated by an AI system. It should be treated as advisory input, not a definitive assessment.
Visualizations
Core Vs All Pathway Completeness
Ecotype Count Vs Openness
Fig1 Four Category Overview
Fig2 Conservation By Category
Fig3 Core Accessory Pathways
Fig4 Ecotype Openness
Fig5 Condition Type Shifts
Pathway Conservation By Genus
Pathway Conservation By Phylum
Pathway Conservation Vs Openness
Tier1 Category Distribution
Tier1 Classification Heatmap
Tier1 Completeness Vs Importance
Tier1 Condition Type Shifts
Tier1 Conservation Validation
Notebooks
01_data_extraction.ipynb
01 Data Extraction
View notebook →
02_tier1_pathway_classification.ipynb
02 Tier1 Pathway Classification
View notebook →
03_tier2_pathway_conservation.ipynb
03 Tier2 Pathway Conservation
View notebook →
04_metabolic_ecotypes.ipynb
04 Metabolic Ecotypes
View notebook →
05_synthesis.ipynb
05 Synthesis
View notebook →