Gene Conservation, Fitness, and the Architecture of Bacterial Genomes
CompletedResearch Question
How does a gene's importance for bacterial survival relate to its evolutionary conservation, and what does the conserved genome actually look like?
Research Plan
Hypothesis
A naive model predicts that core genes are "boring" housekeeping genes -- always needed, never costly. We hypothesize that the conserved genome is instead the most functionally active part of the genome, and that lab conditions are an impoverished proxy for natural selection pressures.
Approach
This is a synthesis project that draws on four upstream analysis projects:
| Project | What it does | Key result |
|---|---|---|
| conservation_vs_fitness | Link table + essential gene analysis | Essential genes 86% core (OR=1.56) |
| fitness_effects_conservation | Quantitative fitness spectrum | 16pp gradient, core = more burdensome |
| module_conservation | ICA modules vs pangenome | Module genes 86% core (OR=1.46) |
| core_gene_tradeoffs | Anatomy of the burden paradox | Trade-offs drive the paradox (OR=1.29) |
Analysis Strategy
- The Gradient: Quantify the fitness-conservation gradient from essential genes (82% core) to always-neutral genes (66% core) across 194,216 protein-coding genes and 43 diverse bacteria
- The Paradox: Test whether core genes are more or less likely to be burdens, have condition-specific effects, and show trade-off behavior
- The Resolution: Construct a selection-signature matrix crossing lab fitness cost with pangenome conservation to identify genes under purifying selection in natural environments
- The Architecture: Use ICA decomposition to identify co-regulated fitness modules and test their enrichment in core genes; dissect the burden paradox by functional category
Revision History
- v1 (2026-02): Migrated from README.md
Overview
This synthesis connects two large-scale datasets -- the Fitness Browser (RB-TnSeq mutant fitness data for ~194,000 genes across 43 bacteria) and the KBase pangenome (gene cluster conservation across 27,690 microbial species) -- to ask whether "important" means "conserved." It draws on four upstream analysis projects (conservation_vs_fitness, fitness_effects_conservation, module_conservation, core_gene_tradeoffs) to reveal that the conserved genome is the most functionally active part of the genome, not the most inert, and that lab conditions are an impoverished proxy for natural selection.
Key Findings
The Gradient
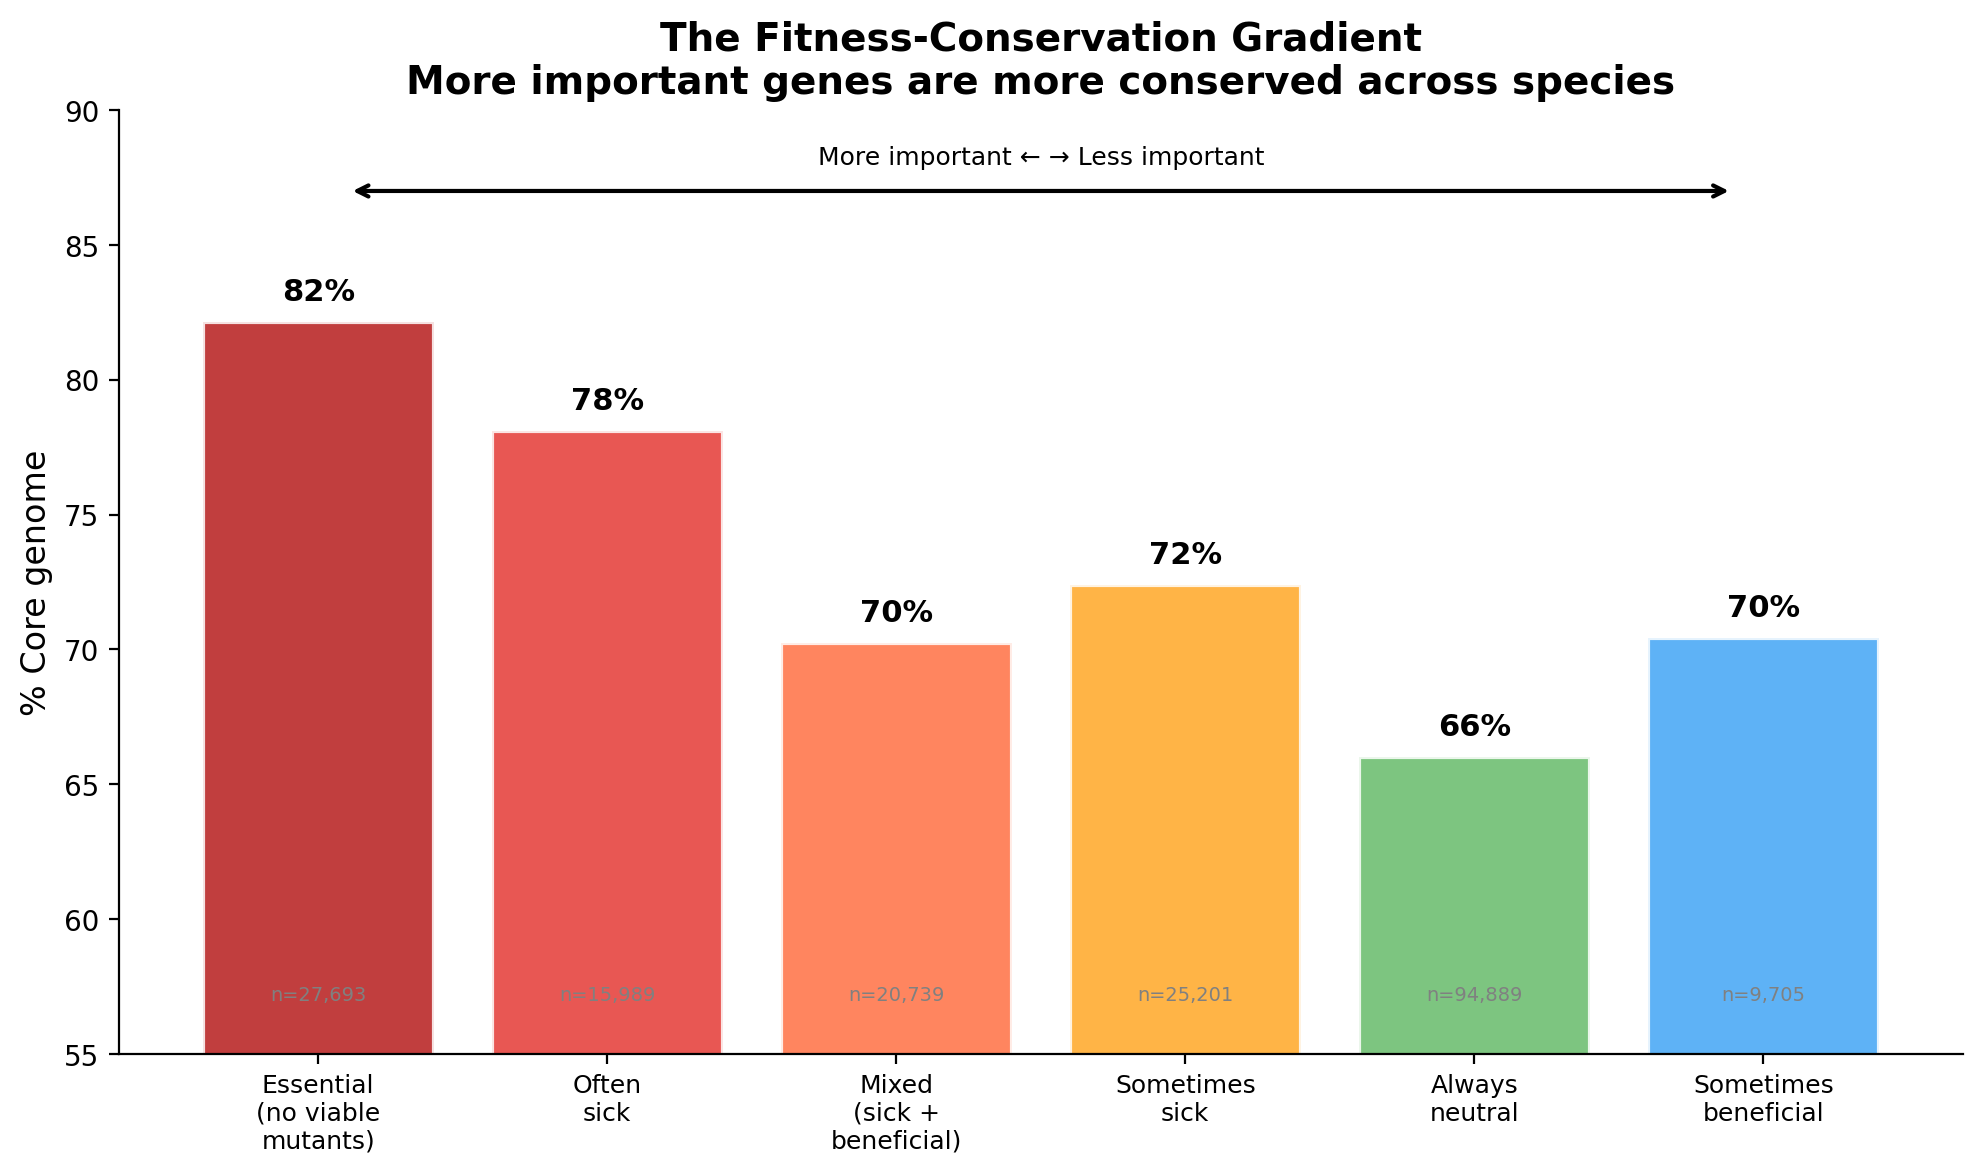
There is a clear, quantitative gradient from essential genes (82% core) to always-neutral genes (66% core). More important genes are more conserved -- but the effect is modest. Even genes with no detectable fitness effect in any experiment are 66% core. The gradient spans 194,216 protein-coding genes across 43 diverse bacteria, from archaea (Methanococcus) to plant pathogens (Ralstonia) to gut commensals (Bacteroides).
(Notebook: 01_summary_figures.ipynb)
The Paradox
A naive model predicts that core genes are "boring" housekeeping genes -- always needed, never costly. The data shows the opposite:
- Core genes are MORE likely to be burdens -- 24.4% show positive fitness when deleted (mutant grows better) vs 19.9% for accessory genes
- Core genes have MORE condition-specific effects -- genes with strong specific phenotypes are 1.78x more likely to be core
- Core genes are MORE likely to be trade-offs -- genes that are both important AND burdensome (depending on conditions) are 1.29x more likely core
The conserved genome is the most functionally active part of the genome, not the most inert.
(Notebook: 01_summary_figures.ipynb)
The Resolution
Lab conditions are an impoverished proxy for nature.
A gene that shows positive fitness when deleted in rich media may be essential for survival in soil, biofilm, host tissue, or any of the thousands of conditions bacteria face in their natural habitats. The lab captures the cost of maintaining these genes; the pangenome captures the evolutionary pressure to keep them.
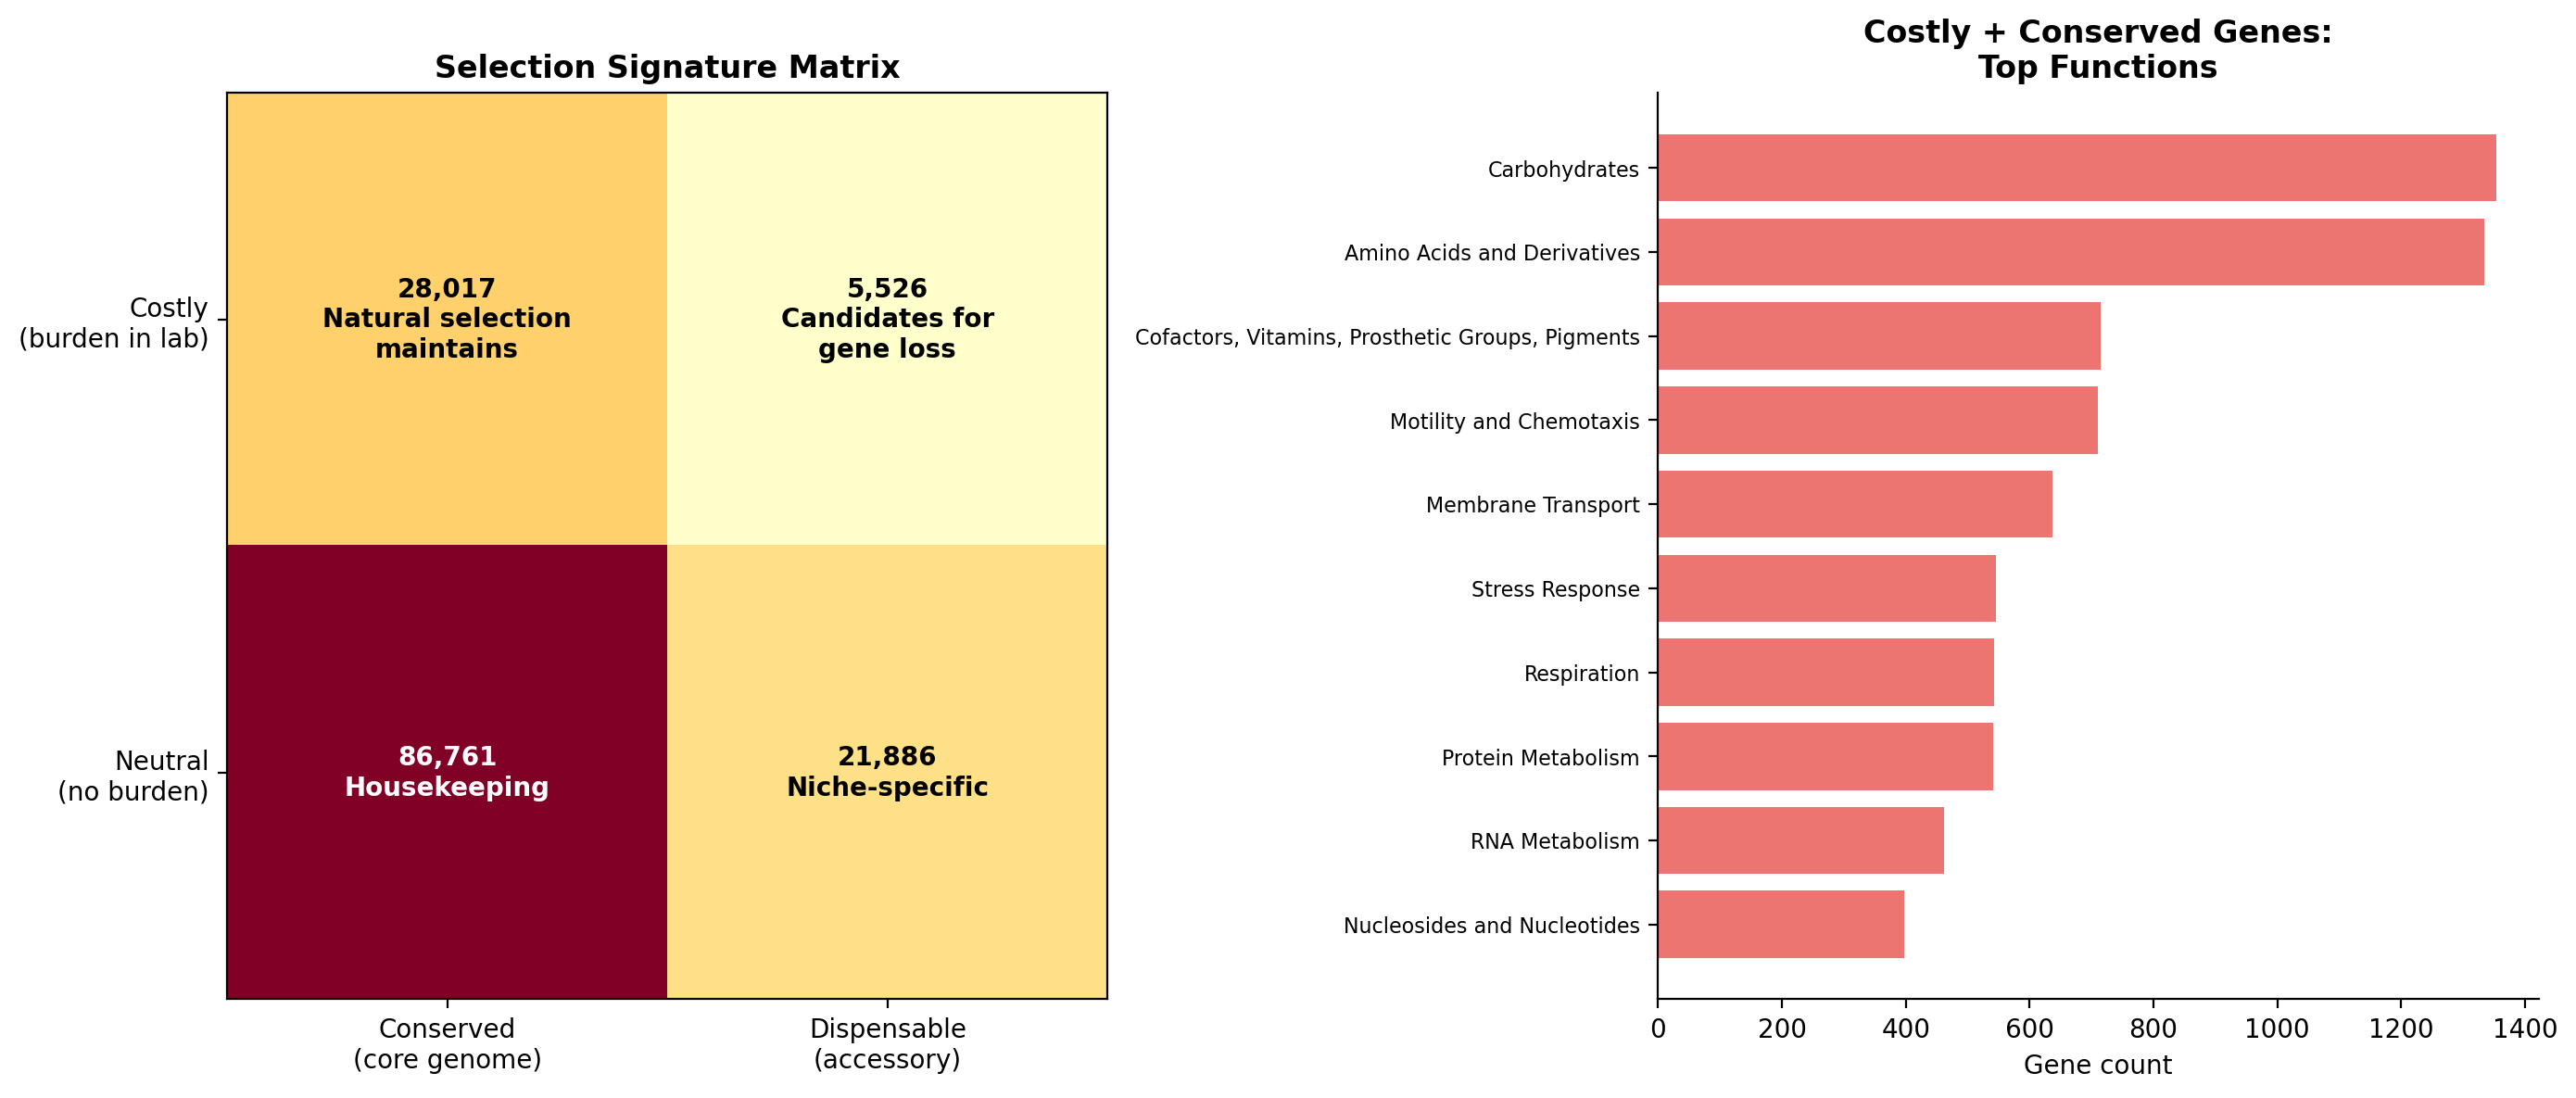
We quantified this with a selection-signature matrix. The 28,017 genes that are simultaneously costly in the lab AND conserved in the pangenome are the strongest evidence for purifying selection in natural environments -- nature maintains them despite their metabolic cost. The 5,526 genes that are costly AND dispensable are candidates for ongoing gene loss.
(Notebook: 01_summary_figures.ipynb)
The Architecture
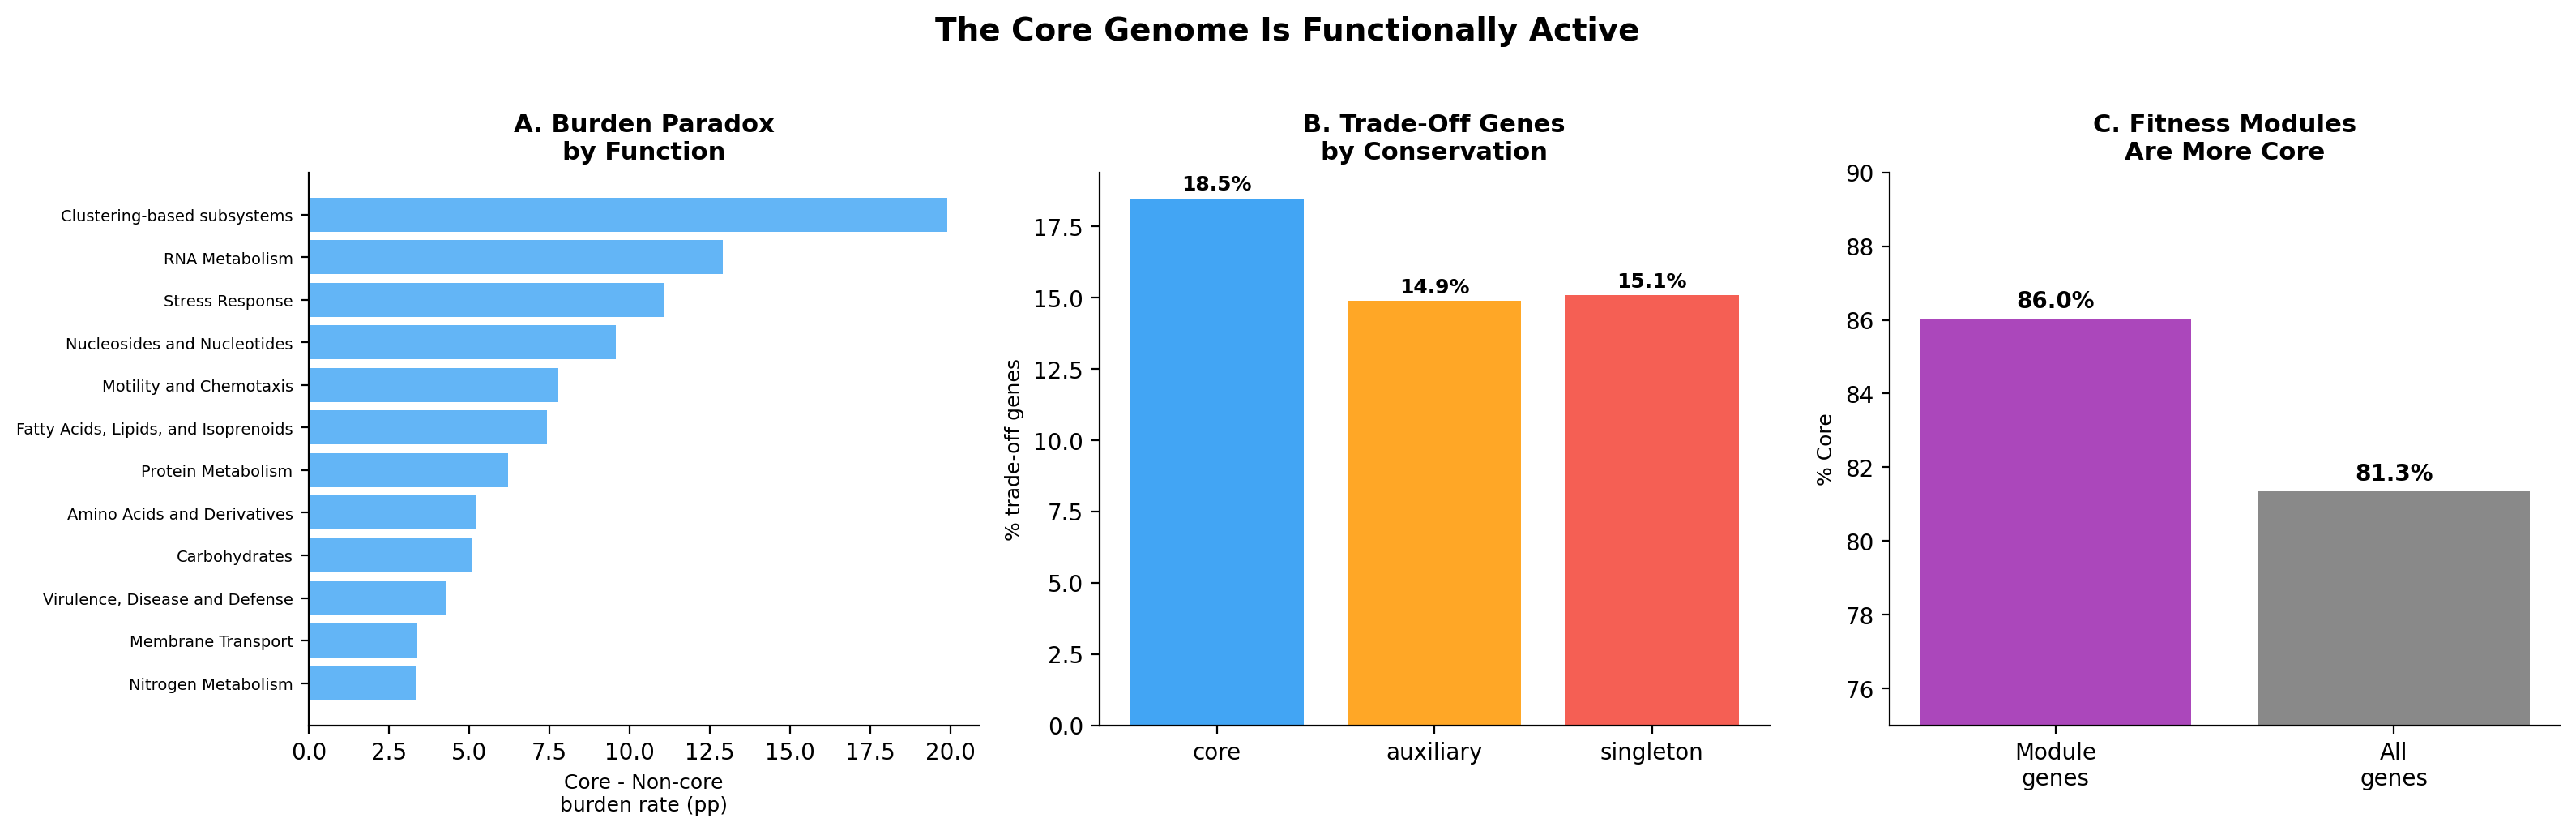
The core genome is not just a collection of individual essential genes -- it contains coordinated functional units. ICA decomposition identified 1,116 co-regulated fitness modules across 32 organisms. These modules are enriched in core genes (86% core vs 81.5% baseline, OR=1.46, p=1.6e-87). 59% of modules are >90% core genes.
The burden paradox is function-specific: motility and chemotaxis genes (+7.8pp core-burden excess), RNA metabolism (+12.9pp), and protein metabolism (+6.2pp) drive the effect. Cell wall genes reverse it -- non-core cell wall genes are MORE burdensome. This makes biological sense: flagella are energetically expensive but essential for chemotaxis in natural environments; ribosomal components are costly but required for rapid growth responses.
(Notebook: 01_summary_figures.ipynb)
Data
Sources
| Dataset | Description | Source |
|---|---|---|
| Fitness Browser | RB-TnSeq mutant fitness for ~194K genes across 43 bacteria | Price et al. (2018); upstream projects |
| KBase pangenome | Gene cluster conservation across 27,690 species | Parks et al. (2022); upstream projects |
| Upstream fitness stats | Per-gene fitness summary statistics | conservation_vs_fitness/data/, fitness_effects_conservation/data/ |
| ICA fitness modules | 1,116 co-regulated modules across 32 organisms | fitness_modules/data/modules/ |
Generated Data
This synthesis project does not generate new data files; all figures are produced from cached upstream data.
References
- Price MN et al. (2018). "Mutant phenotypes for thousands of bacterial genes of unknown function." Nature 557:503-509. PMID: 29769716
- Parks DH et al. (2022). "GTDB: an ongoing census of bacterial and archaeal diversity through a phylogenetically consistent, rank normalized and complete genome-based taxonomy." Nucleic Acids Res 50:D199-D207. PMID: 34520557
- Rosconi F et al. (2022). "A bacterial pan-genome makes gene essentiality strain-dependent and evolvable." Nat Microbiol 7:1580-1592.
- Hutchison CA 3rd et al. (2016). "Design and synthesis of a minimal bacterial genome." Science 351:aad6253.
What We Did Not Find
- Family breadth doesn't predict conservation: Module families spanning more organisms don't have higher core fractions (rho=-0.01, p=0.91). The baseline is already so high there's no room for a gradient.
- Accessory genes are NOT systematically burdensome: Contrary to the "streamlining" hypothesis, accessory genes are LESS costly than core genes, not more.
- Condition-specific doesn't mean niche-specific: Genes with strong condition-specific fitness effects are MORE likely core, not more accessory. Core genes simply have more detectable effects.
Open Questions
- The 5,526 costly + dispensable genes -- What are they? Mobile elements? Recently acquired genes on the way out? These are candidates for ongoing gene loss.
- Environmental context -- Do organisms from more variable environments have more trade-off genes in their core? Connecting lab fitness to AlphaEarth environmental data could bridge this gap.
- Cross-organism essential families -- Are there universally essential gene families across all 43 organisms?
- The 48 accessory modules -- What co-regulated functions live exclusively in the flexible genome?
Derived Data
This project builds on processed data from other projects.
Review
Summary
This is an ambitious and well-written cross-project synthesis that weaves four upstream analysis projects into a coherent narrative about the relationship between gene fitness importance and pangenome conservation. The writing is strong — the "gradient → paradox → resolution → architecture" narrative arc is compelling and scientifically sound. The three summary figures are effective and the selection-signature matrix is a genuinely useful conceptual framework. However, there is one critical issue: the numbers shown in Figure 1 (fitness_conservation_gradient.png) do not match the prose text or the upstream project tables, undermining the central quantitative claim. Additionally, the synthesis could benefit from a more explicit discussion of why different upstream projects report different core percentages for essential genes (82% vs 86%), and a few minor reproducibility gaps should be addressed.
Methodology
Narrative structure: The synthesis is organized around a clear conceptual progression — the gradient, the paradox, the resolution, the architecture — which is effective for a synthesis document. The research question is clearly stated and the four upstream projects are well-chosen to build the argument.
Accuracy of claims against upstream projects: Most numerical claims were verified against the upstream READMEs and are accurate:
- 24.4% burden rate for core vs 19.9% for accessory ✓ (from
fitness_effects_conservation) - Specific phenotype enrichment OR=1.78 ✓ (from
fitness_effects_conservation) - Trade-off enrichment OR=1.29 ✓ (from
core_gene_tradeoffs) - Selection signature matrix counts (28,017 and 5,526) ✓ (from
core_gene_tradeoffs) - 1,116 modules across 32 organisms ✓ (from
module_conservation) - Module gene enrichment 86% vs 81.5% baseline, OR=1.46 ✓ (from
module_conservation) - 59% of modules >90% core ✓ (from
module_conservation) - Family breadth rho=-0.01, p=0.91 ✓ (from
module_conservation, p=0.914, acceptable rounding) - Function-specific burden paradox values (+7.8pp motility, +12.9pp RNA, +6.2pp protein) ✓ (from
core_gene_tradeoffs)
Critical discrepancy — Figure 1 vs text: The prose in "The Gradient" section states "essential genes (82% core) to always-neutral genes (66% core)," consistent with the fitness_effects_conservation upstream table. However, the actual Figure 1 shows Essential at 86% and Always neutral at 78% — a much narrower gradient of ~8 percentage points rather than the claimed 16pp. The gene counts in the figure also differ from the upstream table (e.g., 80,462 always-neutral in figure vs 94,889 upstream). This appears to result from the notebook computing percentages only over the 168,624 successfully mapped genes, while the upstream project included all 194,216 genes (with unmapped genes falling disproportionately into accessory/singleton categories). This is the most important issue in the review — the figure and text tell different quantitative stories.
Internal inconsistency — 82% vs 86% essential core rate: The prose uses 82% (from fitness_effects_conservation, 43 organisms) while the methods table reports 86% (from conservation_vs_fitness, 33 organisms). Both are correct for their datasets, but the synthesis does not explain why these differ. The 82% figure includes essential genes that could not be mapped to pangenome clusters (treated as non-core by the fitness_effects_conservation project), while the 86% figure comes from only the 33 organisms with high mapping coverage. A footnote or parenthetical explaining this would prevent reader confusion.
Unverifiable claim: "27.4M fitness measurements across ~7,500 experiments" (line 68) — the 27.4M figure does not appear in any upstream project README and cannot be fact-checked from the available documentation.
Code Quality
Notebook (01_summary_figures.ipynb): The notebook is well-structured with clear markdown headers separating three figure-generation sections. All cells have saved outputs (text + images), making it fully readable without re-execution.
Data loading and merging (cell setup): The unified dataset construction is sound — essential genes are properly added with is_essential=True and appropriate NaN values for fitness columns. The Dyella79 exclusion is correctly applied. The merge with the link table uses a left join, appropriately retaining unmapped genes.
Fitness profile classification (cell setup): The profile assignment logic has a subtle issue — the order of assignments means that sometimes_sick will overwrite sometimes_beneficial for genes that are sick but not beneficial, which is correct. However, the often_sick threshold (n_sick / n_experiments > 0.1) can overwrite mixed for genes that are both frequently sick and beneficial. This is a design choice rather than a bug, but it means the "mixed" category is restricted to genes with <10% sick experiments, which differs from the upstream fitness_effects_conservation definitions. This likely contributes to the discrepancy between Figure 1 values and the upstream table.
Figure 3 Panel B (cell fig3): There is a code issue — ax_b is created at gs[1] and then ax_c is initially also created at gs[1] before being reassigned to gs[2]. The intermediate ax_b panel (Trade-Off Genes by Conservation) renders with overlapping x-axis labels in the output figure, making it partially illegible. The trade-off percentage values and x-axis category labels collide.
Performance note: Cell fig3 uses link_sub.apply(lambda r: ... in module_loci, axis=1) to check module membership — a row-wise apply on a potentially large DataFrame. This is flagged in docs/pitfalls.md ("Row-Wise Apply on Large DataFrames Is Orders of Magnitude Slower Than Merge"). A merge-based approach would be more efficient, though for a one-time figure-generation notebook this is acceptable.
Pitfall awareness: The notebook correctly handles string-typed columns by loading data from pre-processed TSV files rather than querying Spark directly. The Dyella79 exclusion (documented pitfall) is properly applied.
Findings Assessment
Conclusions are well-supported — with the caveat of the Figure 1 discrepancy, the narrative claims are accurately traced to upstream projects. The synthesis adds genuine value by connecting four separate analyses into a unified argument.
The "paradox + resolution" framing is effective: The observation that core genes are more burdensome is genuinely surprising, and the resolution (lab conditions as impoverished proxy) is well-argued and supported by the selection-signature matrix.
"What We Didn't Find" section is valuable: Reporting null results (family breadth doesn't predict conservation, accessory genes are not systematically burdensome) demonstrates scientific rigor and prevents readers from over-interpreting the positive findings.
Open Questions are well-chosen: The four open questions are specific, testable, and naturally follow from the findings. The suggestion to connect to AlphaEarth environmental data is particularly promising.
Limitations partially acknowledged: The synthesis relies on the upstream projects' limitations sections rather than restating them. This is reasonable for a synthesis, but a brief note about the key limitation (lab conditions capture only a fraction of natural environments) would strengthen the "Resolution" section — this is mentioned but could be more prominent.
Visualizations:
- Figure 1 (gradient): Effective color scheme and layout, clear labels, but the quantitative values contradict the text (critical issue).
- Figure 2 (selection signature): The 2x2 matrix is an excellent conceptual contribution. The companion bar chart of top functions adds useful detail.
- Figure 3 (core genome active): Panel A (burden by function) is informative. Panel B (trade-off by conservation) has rendering issues with overlapping labels. Panel C (module enrichment) is clear. The suptitle overlaps slightly with the panel titles.
Suggestions
-
[Critical] Reconcile Figure 1 with the prose text. The figure shows essential genes at 86% core and always-neutral at 78%, while the text says 82% and 66% respectively. Either regenerate the figure to match the upstream
fitness_effects_conservationnumbers (by including unmapped genes in the denominator, and ensuring profile classification matches the upstream definitions), or update the prose to match the figure values. The former is recommended, as the 16pp gradient is the more noteworthy finding and aligns with the upstream analysis that controlled for mapping coverage. -
[Important] Explain the 82% vs 86% essential gene core rate. Add a brief note (in "The Gradient" or "Methods") explaining that the 82% figure includes all 43 organisms and counts unmapped essential genes as non-core, while the 86% figure from
conservation_vs_fitnessuses 33 organisms with high mapping coverage. This resolves the apparent contradiction between the prose and the methods table. -
[Important] Fix Figure 3 Panel B rendering. The trade-off gene bar chart has overlapping x-axis labels ("core", "auxiliary", "singleton") that collide with the percentage annotations. Increase figure height or adjust label positioning.
-
[Minor] Add a Reproduction section. The synthesis has a
requirements.txt(good) but no reproduction instructions in the README. A brief section explaining that the notebook requires upstream project data fromconservation_vs_fitness,fitness_effects_conservation,fitness_modules, andcore_gene_tradeoffs— and that it runs locally (no Spark) — would complete the reproducibility picture. -
[Minor] Verify the "27.4M fitness measurements" claim. This figure does not appear in any upstream project README. Either verify it from the data or cite the source (e.g., Price et al. 2018).
-
[Minor] Replace row-wise apply with merge in Figure 3. Cell
fig3usesdf.apply(lambda r: ... in set, axis=1)for module membership lookup. Perdocs/pitfalls.md, this should be replaced with a merge for better performance, though this is low priority for a figure-generation notebook. -
[Nice-to-have] Add a data/ directory or note its intentional absence. Unlike the upstream projects, this synthesis has no
data/directory. A brief note in the README (or a symlink) explaining that all data comes from upstream projects would clarify the project structure.
This review was generated by an AI system. It should be treated as advisory input, not a definitive assessment.
Visualizations
Core Genome Active
Fitness Conservation Gradient
Selection Signature