Truly Dark Genes — What Remains Unknown After Modern Annotation?
CompletedResearch Question
Among the ~6,400 Fitness Browser genes that remain functionally unannotated even after bakta v1.12.0 reannotation, what distinguishes them from "annotation-lag" dark matter, and can their fitness phenotypes, genomic context, and sparse annotations prioritize them for experimental characterization?
Research Plan
Hypothesis
- H0: Truly dark genes are a random subset of hypothetical proteins — they differ from annotation-lag genes only in database coverage (i.e., bakta's reference databases just haven't caught up to them yet).
- H1: Truly dark genes are structurally and evolutionarily distinct — they are shorter, more divergent, less conserved, more taxonomically restricted, and enriched in specific organisms or conditions — representing genuinely novel biology rather than annotation lag.
Secondary Hypotheses
- H2: Truly dark genes with strong fitness phenotypes (|fitness| >= 2 or essential) are enriched in stress conditions (metals, oxidative) relative to annotation-lag genes with equivalent fitness effects, suggesting they encode novel stress response mechanisms. Enrichment baseline: condition-class distribution of annotation-lag genes with |fitness| >= 2.
- H3: Truly dark genes are enriched in accessory genomes (species-specific or strain-variable), consistent with rapid evolution or recent horizontal acquisition outpacing annotation databases. Test HGT specifically via GC content deviation from host genome mean and proximity to mobile genetic elements (transposases, integrases).
- H4: Despite lacking bakta product descriptions, many truly dark genes have partial clues (UniRef50 links, Pfam HMMER hits, ICA module membership) that can narrow functional hypotheses when combined.
Approach
Data Reuse Strategy
This project builds directly on functional_dark_matter outputs. To avoid re-derivation:
- Census and bakta status: Load from functional_dark_matter/data/bakta_dark_gene_annotations.tsv and updated_darkness_tiers.tsv (NB12 outputs)
- Concordance: Filter existing functional_dark_matter/data/concordance_scores.tsv and concordance_detailed.tsv (NB02 outputs) to truly-dark subset
- Condition enrichment and essentiality: Filter existing census data; do not re-query FB
- New Spark queries (NB02): Only for data NOT captured by parent project — specifically bakta_pfam_domains, bakta_db_xrefs, and eggnog_mapper_annotations for the truly dark gene clusters
Phase 1: Census and Characterization (NB01)
Define the truly dark gene set and characterize its properties relative to annotation-lag genes.
Truly dark definition: Genes in bakta_dark_gene_annotations.tsv with bakta_reclassified = False AND bakta product = "hypothetical protein". This gives ~6,427 genes across the 39,532 linked dark genes.
Sub-stratification: Among truly dark genes, distinguish:
- Truly dark with DUF-only Pfam hits (structural class known, function unknown)
- Truly dark with non-DUF Pfam hits (some functional signal)
- Truly dark with no Pfam hits at all (deepest darkness)
Short ORF filtering: Flag genes < 150 bp as potential spurious gene calls. Report count and exclude from statistical comparisons (or analyze separately).
Unlinked dark genes: The 17,479 dark genes NOT linked to the pangenome cannot be assessed by bakta. NB01 will report their organism distribution, fitness phenotype summary, and gene length distribution. NB06 will discuss what fraction of truly dark biology they might represent.
Compare truly dark vs annotation-lag genes on:
- Sequence properties: Gene length (using ABS(CAST(end AS INT) - CAST(begin AS INT))), GC content
- Conservation: Core vs accessory vs novel classification (from pangenome link)
- Taxonomic breadth: Ortholog group size, number of species with orthologs
- Organism distribution: Are truly dark genes concentrated in specific organisms?
- Condition enrichment: What conditions show strongest fitness effects? (baseline: annotation-lag condition distribution)
- Essentiality: Fraction essential (from essential_genome project)
- Module membership: Fraction in ICA fitness modules (from fitness_modules project)
- GC deviation: Difference from host genome mean GC (HGT indicator for H3)
Statistical framework: Mann-Whitney U tests for continuous variables (length, GC, GC deviation), Fisher's exact or chi-squared for categorical (conservation class, essentiality, module membership). Benjamini-Hochberg FDR correction across all comparisons. Report both p-values and effect sizes (Cohen's d for continuous, odds ratios for categorical). Pre-registered minimum meaningful effect size: Cohen's d >= 0.2 or OR >= 1.5.
Phase 2: Spark Data Enrichment (NB02)
Query BERDL for data not already captured by the parent project:
- Pfam HMMER hits from bakta_pfam_domains for truly dark gene clusters (~6,400 clusters → estimated ~500-1,000 Pfam hits, since bakta only runs HMMER on hypotheticals)
- Database cross-references from bakta_db_xrefs (~28K rows expected at ~4.3 xrefs/cluster)
- eggNOG annotations from eggnog_mapper_annotations (join on query_name = gene_cluster_id) for any residual COG/KEGG signal
- Gene properties (length, GC, scaffold position) from FB gene table for truly dark + annotation-lag genes
Query approach: Create Spark temp views with gene_cluster_id lists and JOIN (not IN clauses — 6,400 IDs is too many for IN). Use SET spark.sql.autoBroadcastJoinThreshold = -1 if joining against large tables.
Phase 3: Sparse Annotation Mining (NB03)
Build a "clue matrix" for each truly dark gene: which partial annotations exist?
- UniRef50 links: Present despite "hypothetical" product?
- Pfam HMMER hits: DUF domains vs non-DUF domains
- eggNOG residual: COG category, KEGG, description from eggNOG where bakta has nothing
- Database cross-references: SO terms, UniRef, any external DB links
- ICA module membership: Module function provides guilt-by-association context
Cluster genes by clue profile. Validate that clue combinations are informative by testing whether genes with more clues have higher cross-organism concordance rates.
Phase 4: Cross-Organism Concordance (NB04)
Reuse existing data: Filter functional_dark_matter/data/concordance_scores.tsv to the truly dark subset rather than re-computing concordance from scratch.
Coverage note: Ortholog data covers only 32 of 48 FB organisms (BBH computed for ICA organisms only). Truly dark genes from the remaining 16 organisms will lack concordance data — report this gap.
Compare concordance rates: truly dark vs annotation-lag vs annotated genes. Use the parent project's condition-class overlap rates as the null model for expected concordance by chance.
Cofitness threshold for operon proxy: |r| >= 0.3 (consistent with fitness_modules project).
Phase 5: Genomic Context Analysis (NB05)
Analyze the genomic neighborhood of truly dark genes:
- Operon membership via cofitness (|r| >= 0.3 with adjacent genes)
- Proximity to mobile elements (transposases, integrases — check bakta annotations of flanking genes)
- ICA module context: what annotated genes share the module?
- GC content deviation from host genome as HGT indicator (for H3)
Phase 6: Experimental Prioritization (NB06)
Rank truly dark genes for experimental follow-up using:
1. Fitness importance: Strong phenotype (|fitness| >= 2) or essential
2. Cross-organism concordance: Conserved phenotype across species
3. Sparse annotation clues: UniRef50, Pfam, module context narrow the hypothesis
4. Tractability: Organism has good genetics, condition is reproducible
5. Conservation: Core genes affect more organisms
Produce a ranked list of ~50-100 top candidates with:
- Specific experimental predictions (which condition, expected phenotype)
- Functional hypotheses from sparse annotations and genomic context
- Suggested experimental approaches (growth assays, structure prediction via AlphaFold/ESMFold, pulldowns)
Cross-validation: Check annotation-lag genes' bakta descriptions against their fitness phenotypes. Identify cases where bakta annotation contradicts fitness data (potential mis-annotations).
Unlinked dark genes: Discuss the 17,479 unlinked genes — what fraction might be truly dark, and how does their exclusion affect the candidate list?
Future work: Flag top candidates for AlphaFold2/ESMFold structure prediction and Foldseek remote homology search as a natural follow-up project.
Revision History
- v1 (2026-03-14): Initial plan, forked from functional_dark_matter NB12 insights
- v2 (2026-03-14): Addressed plan review: added data reuse strategy, statistical framework (BH-FDR, effect sizes), short ORF filtering, DUF sub-stratification, GC deviation for HGT, eggNOG table, temp view JOIN strategy, 32-organism ortholog coverage gap, structure prediction as future work
Overview
The functional_dark_matter project identified 57,011 "dark" genes across 48 Fitness Browser organisms. However, NB12 (bakta enrichment) revealed that 83.7% of linked dark genes are annotated by bakta v1.12.0 — meaning most "dark matter" is actually an annotation vintage problem, not genuinely unknown biology. This project focuses on the residual ~6,400 genes where both the Fitness Browser's original annotation AND bakta's current UniProt-based pipeline agree: these proteins are hypothetical. These are the truly dark genes — the hardest cases that resist annotation by all current methods.
The key reframe: instead of 57,011 candidates, we now have ~6,400 genuinely unknown genes to characterize. This is a tractable number. We ask: What makes them resist annotation? Are they still biologically important? What sparse clues exist (UniRef50, Pfam HMMER hits, fitness modules)? And which ones should be studied first?
Key Findings
Finding 1: Only 16.3% of "dark matter" resists modern annotation
Of 39,532 Fitness Browser dark genes with pangenome links, bakta v1.12.0 reannotation reclassifies 33,105 (83.7%) — leaving just 6,427 "truly dark" genes where both the original pipeline and bakta agree: these are hypothetical proteins. An additional 17,479 dark genes lack pangenome links and could not be assessed.
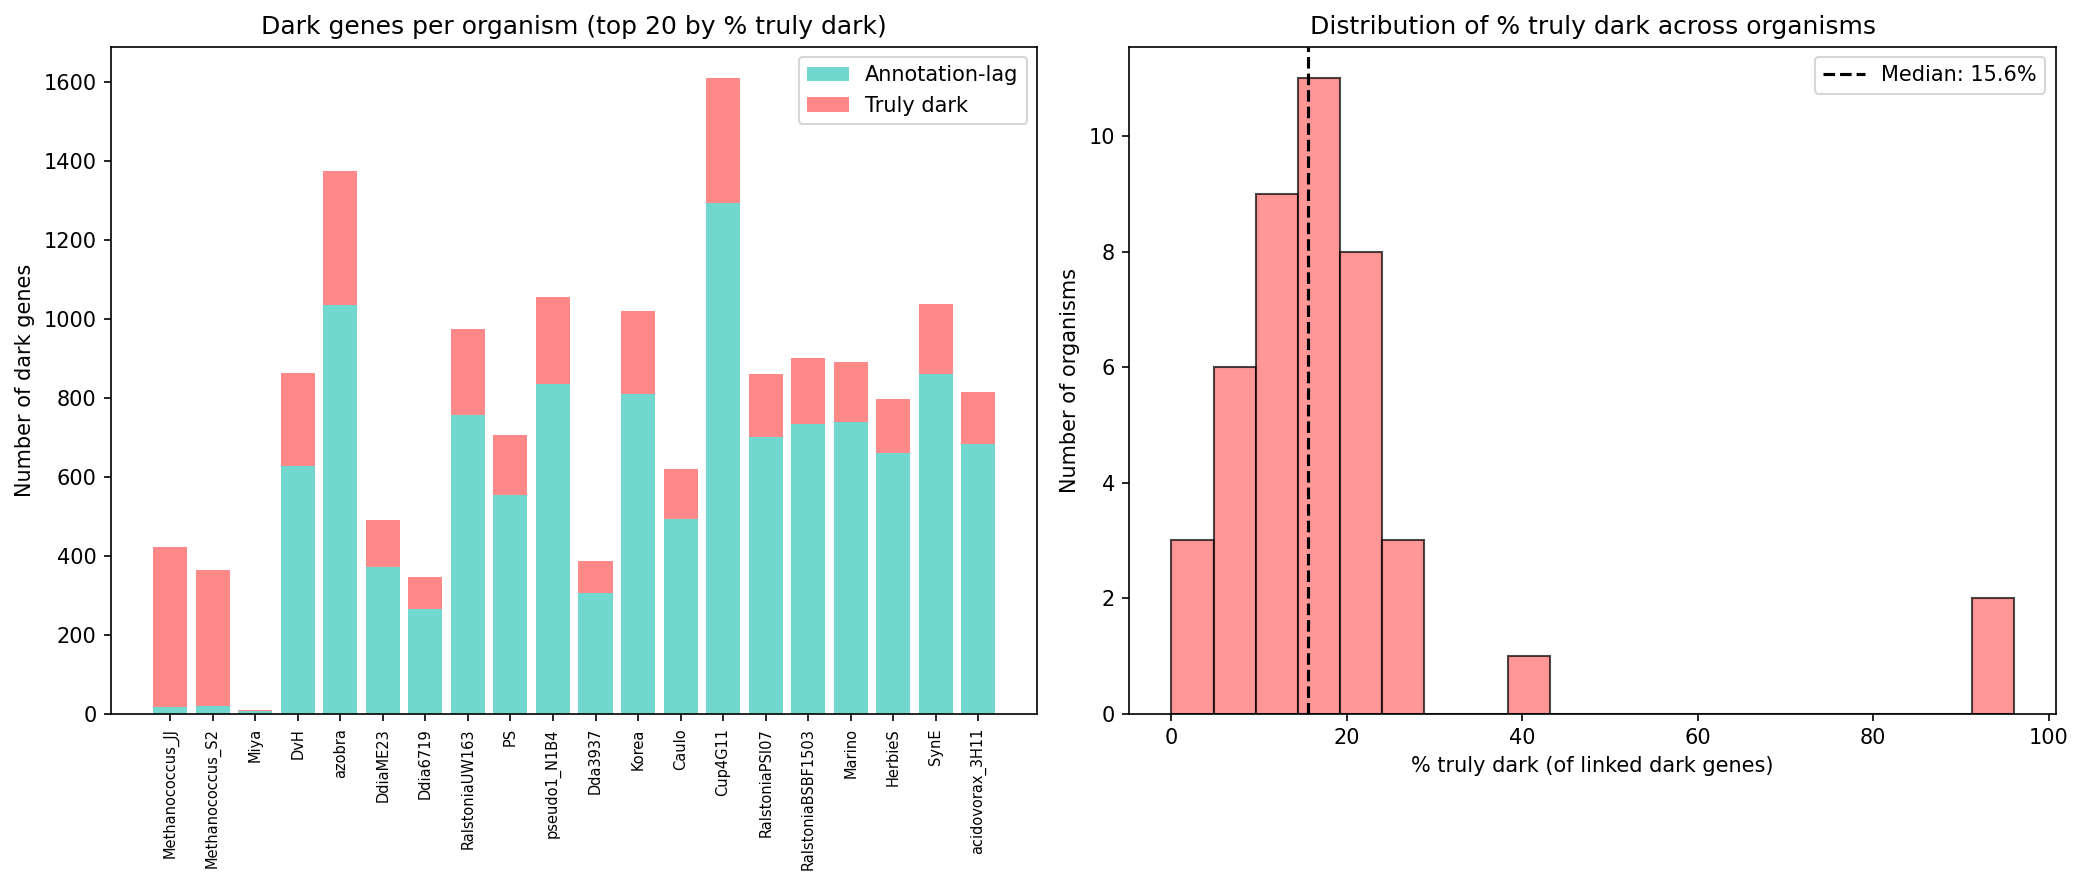
Truly dark genes are concentrated in specific organisms: Methanococcus strains (S2 and JJ) account for 55% of all truly dark genes, reflecting the underrepresentation of archaea in annotation databases. Across organisms, 4–96% of dark genes resist bakta annotation, with archaeal organisms at the high end.
(Notebook: 01_truly_dark_census.ipynb)
Finding 2: Truly dark genes are structurally distinct from annotation-lag genes (H1 supported)
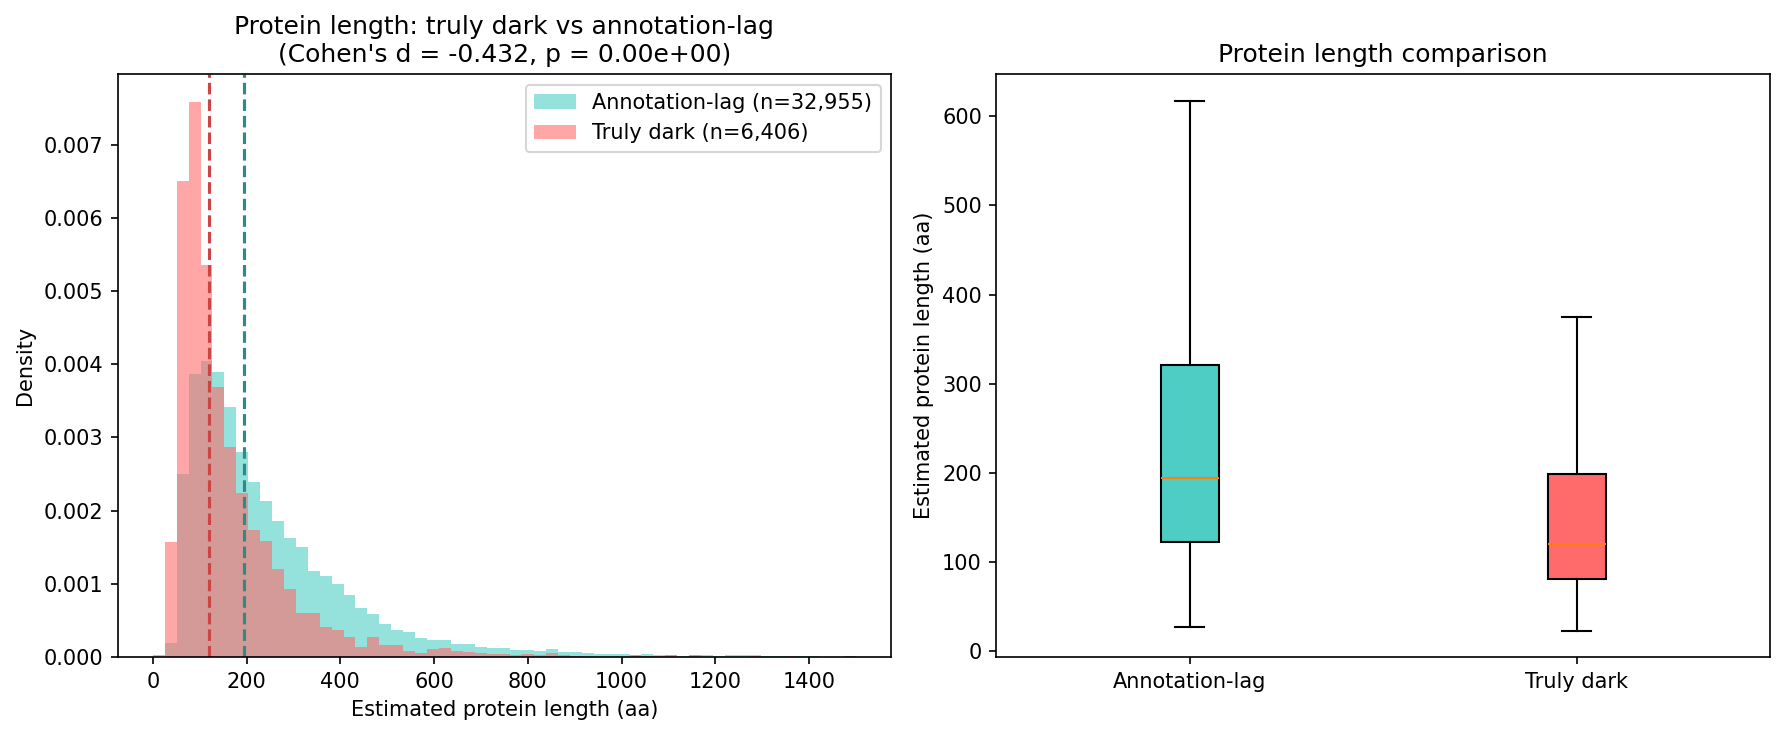
Truly dark genes differ from annotation-lag genes across multiple properties:
| Property | Truly Dark | Annotation-Lag | Effect Size | p-value |
|---|---|---|---|---|
| Median length (aa) | 121 | 194 | d = −0.432 | < 1e-100 |
| Core genome fraction | 43.1% | 72.7% | OR = 0.284 | < 1e-100 |
| Essential fraction | 18.0% | 13.4% | OR = 1.420 | < 1e-10 |
| Mean GC content | 0.542 | 0.584 | d = −0.395 | 2e-115 |
| Has orthologs | 29.3% | 63.7% | OR = 0.236 | < 1e-100 |
| Ortholog breadth (median orgs) | 1 | 4 | d = −1.072 | < 1e-100 |
All effects exceed pre-registered thresholds (Cohen's d ≥ 0.2 or OR ≥ 1.5). Truly dark genes are shorter, less conserved, more taxonomically restricted, and have lower GC content — consistent with genuine biological novelty rather than database lag.
(Notebooks: 01_truly_dark_census.ipynb, 04_cross_organism_concordance.ipynb)
Finding 3: Annotation databases recognize the sequences but not the function
Despite being "hypothetical," 79.4% of truly dark genes have UniRef50 links and 84.7% have database cross-references (RefSeq, UniParc). The paradox: databases contain these sequences but cannot assign function. Only 4.0% have Pfam domain hits, and only 4.6% have KEGG KOs — confirming they resist all standard functional annotation methods.
eggNOG-mapper provides partial signal for 43.5% of truly dark clusters, but 55.4% of COG assignments are category "S" (function unknown). The remaining COG assignments are distributed across diverse categories (L, M, K, T, C, J) with no dominant functional theme.
(Notebook: 02_spark_enrichment.ipynb)
Finding 4: 96% of truly dark genes have at least one partial annotation clue (H4 supported)
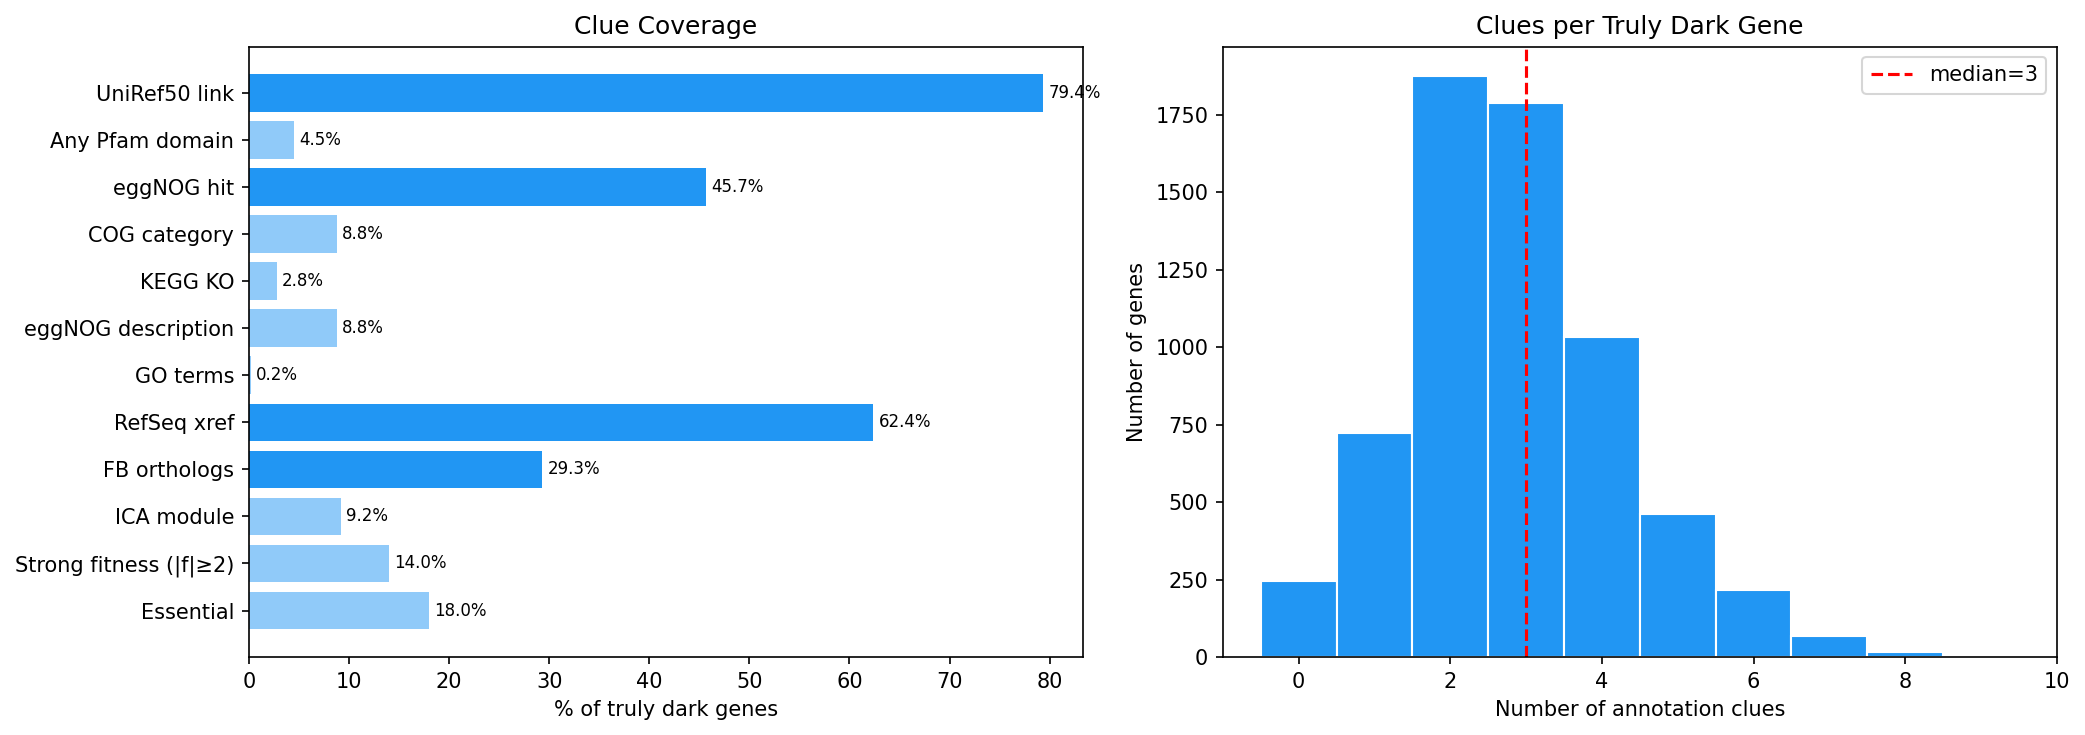
A 12-dimensional "clue matrix" reveals that only 246 genes (3.8%) have zero annotation clues. The remaining 96.2% have combinations of sequence identifiers, eggNOG hits, orthologs, module membership, and/or fitness phenotypes.
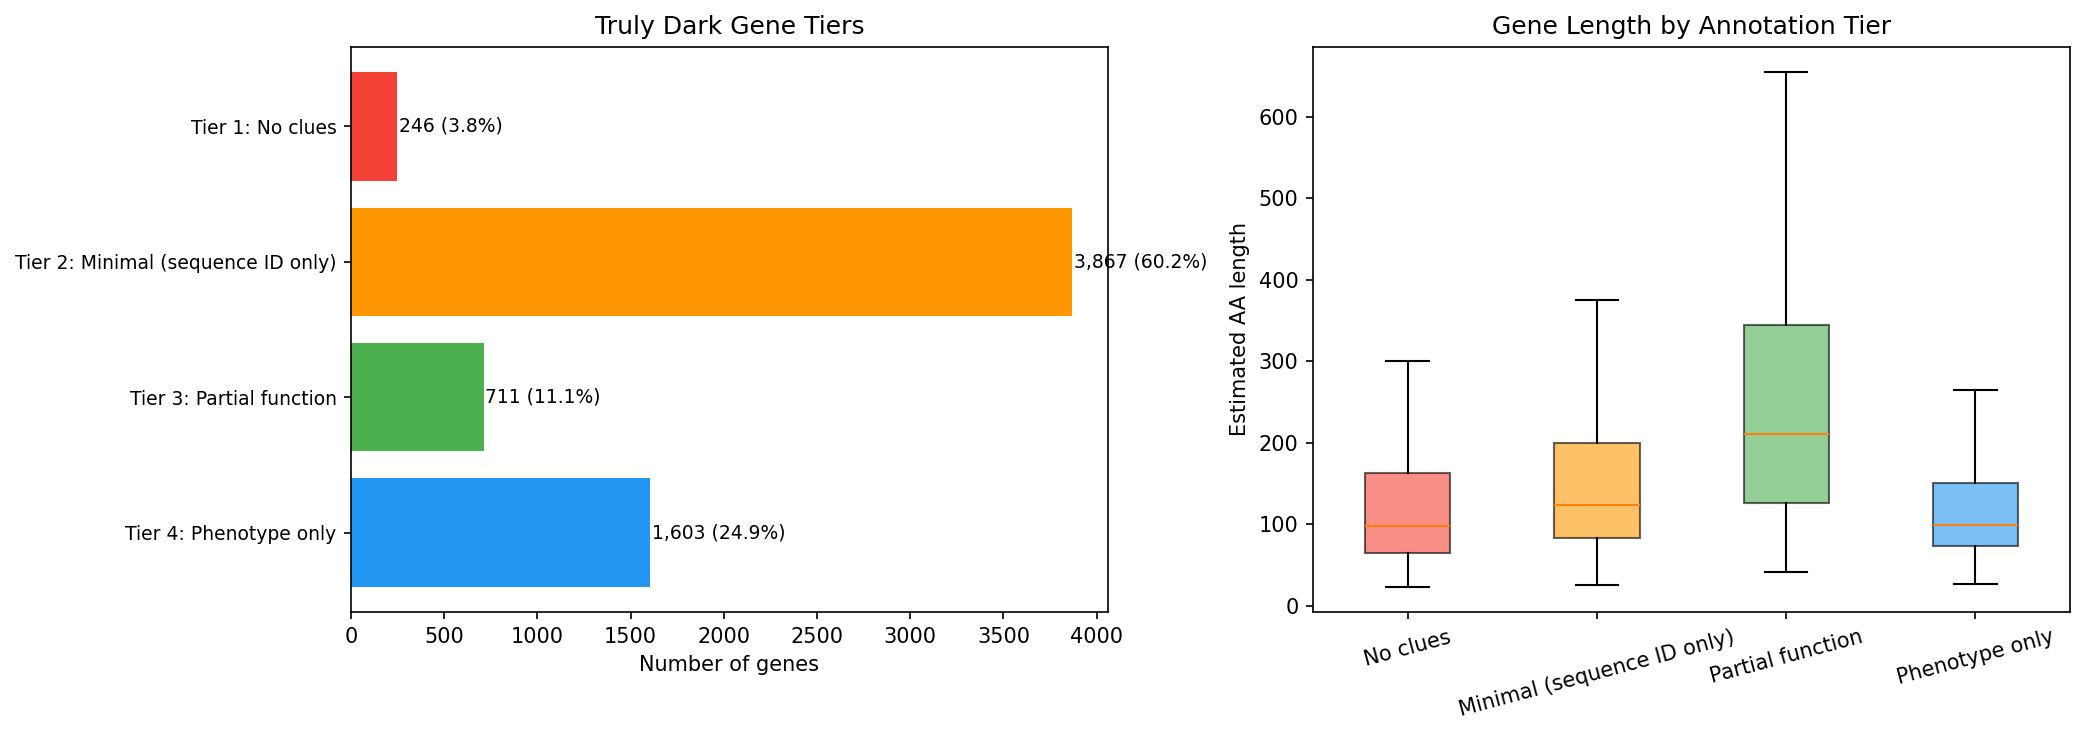
Genes stratify into four interpretable tiers:
| Tier | Count | % | Description |
|---|---|---|---|
| Tier 1: No clues | 246 | 3.8% | Completely dark — no sequence IDs, no hits, no phenotype |
| Tier 2: Minimal | 3,867 | 60.2% | Sequence identifiers only (UniRef50/RefSeq) |
| Tier 3: Partial function | 711 | 11.1% | Pfam, COG, or eggNOG functional description |
| Tier 4: Phenotype only | 1,603 | 24.9% | Fitness/essential/module signal but no functional annotation |
Tier 3 and Tier 4 genes (2,314 total) are the most promising for functional characterization — they have partial clues that can narrow experimental hypotheses.
(Notebook: 03_sparse_annotation_mining.ipynb)
Finding 5: Truly dark genes are enriched in accessory genomes and show HGT signatures (H3 supported)
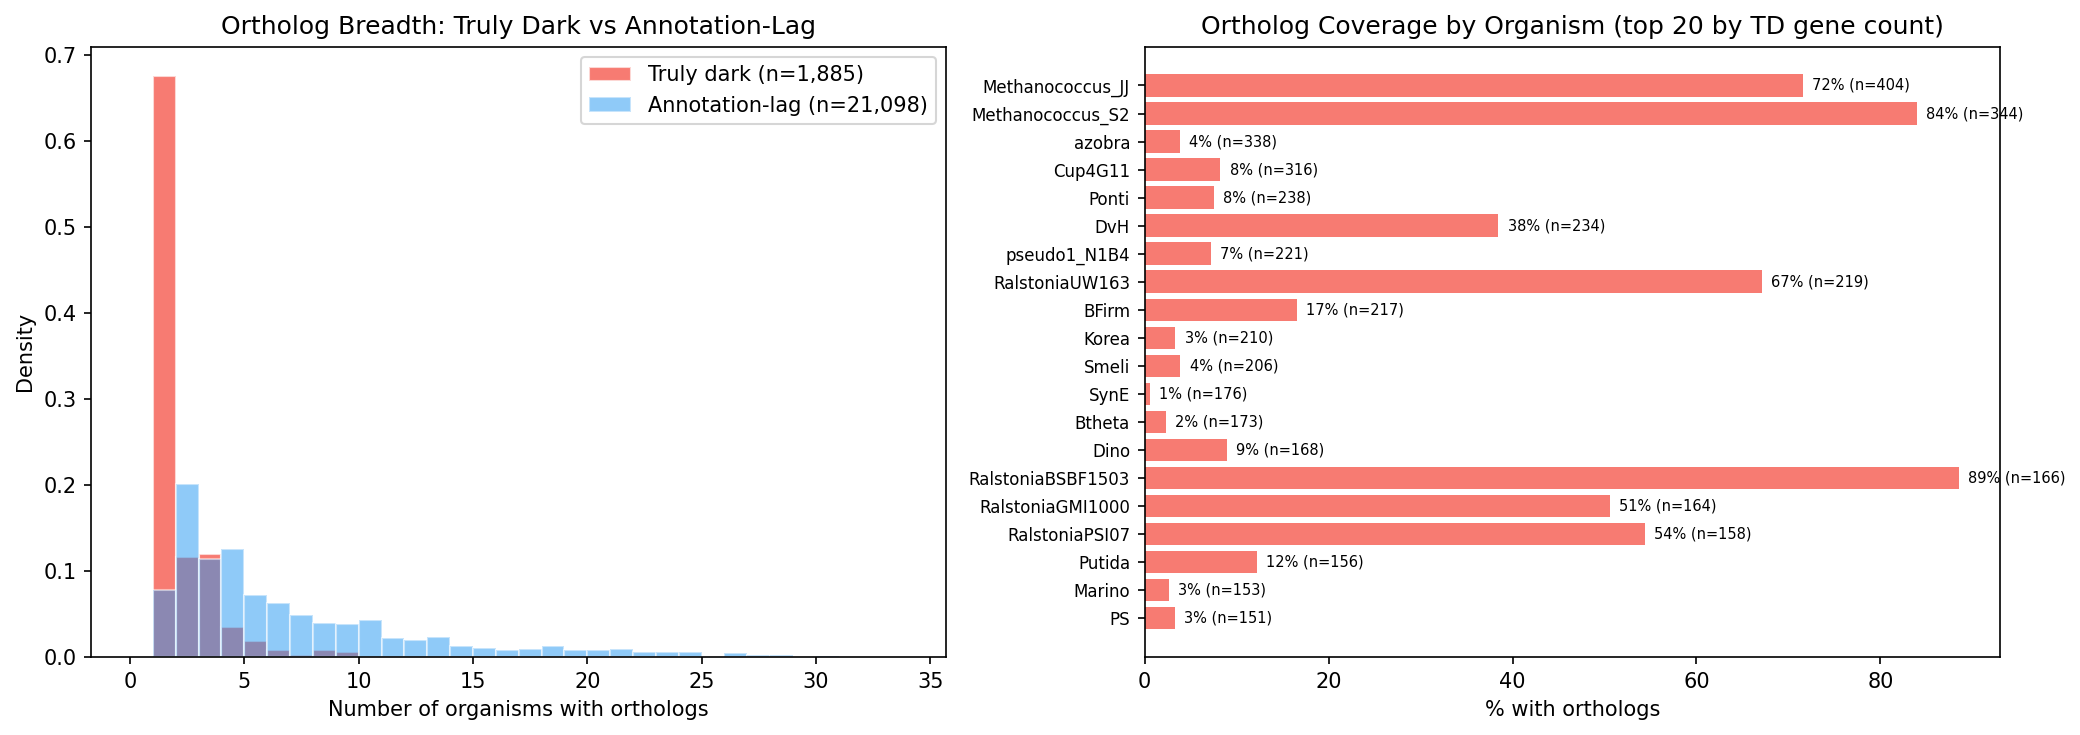
Truly dark genes are 4.2× less likely to have cross-organism orthologs (OR = 0.236) and when they do, their orthologs span fewer organisms (median 1 vs 4). Only 3 of 65 dark-gene ortholog groups with cross-organism concordance data contain truly dark genes — they are nearly invisible to cross-organism analysis.
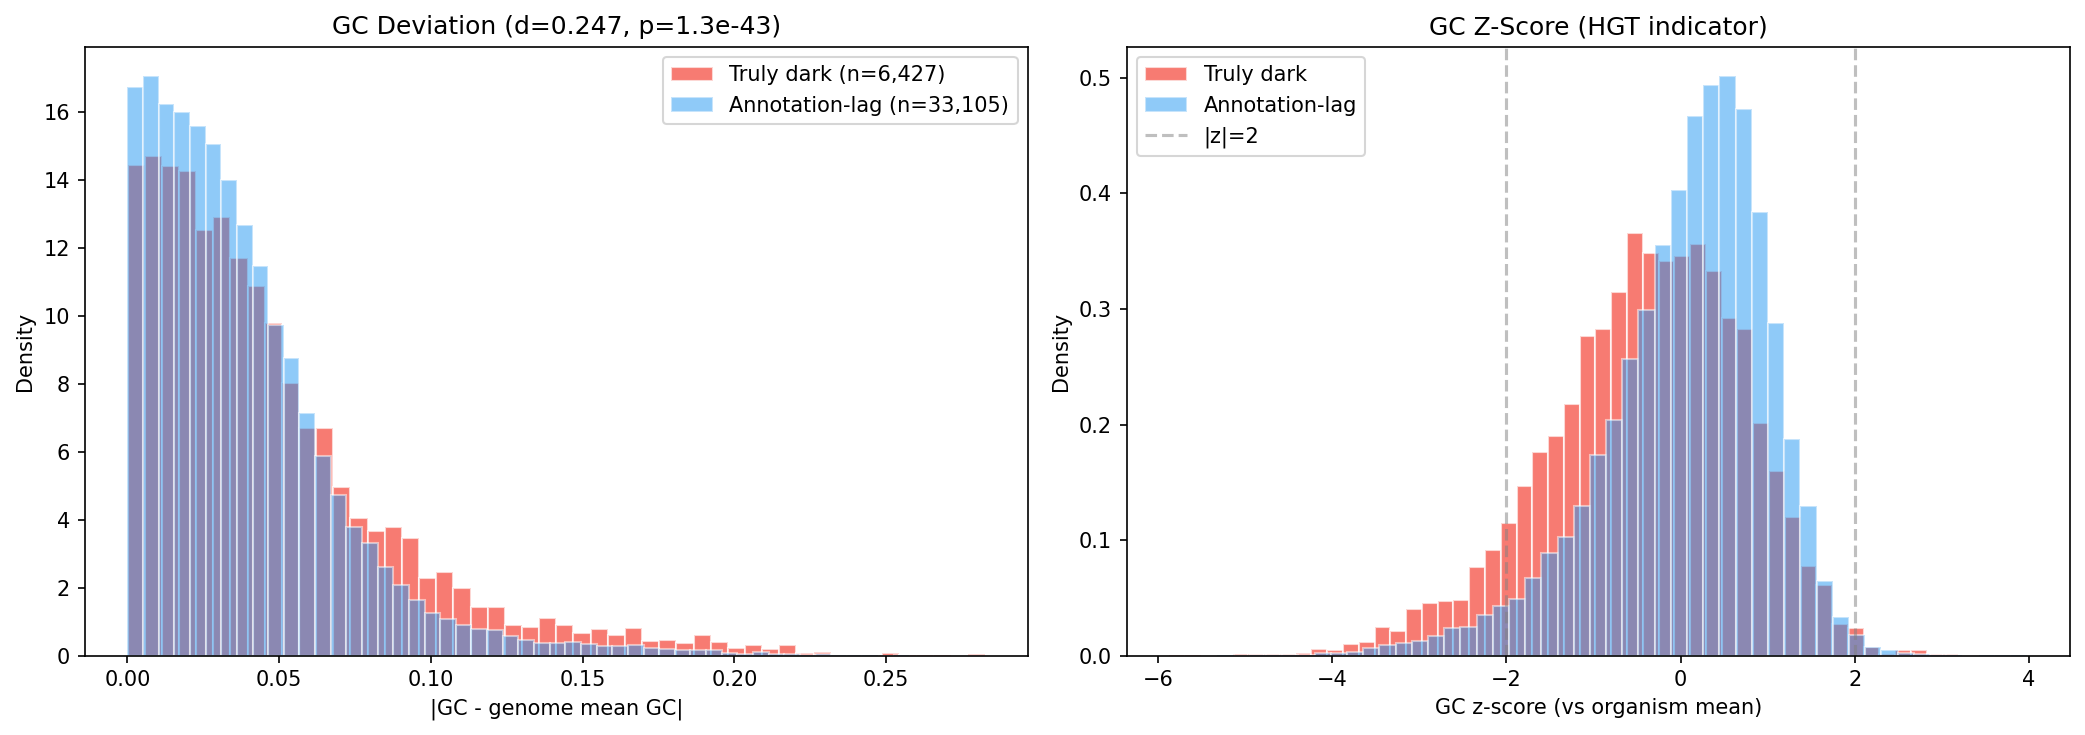
GC content deviation from host genome mean is significantly higher for truly dark genes (mean |ΔGC| = 0.047 vs 0.038, d = 0.247, p = 1.3e-43). Strong GC deviation (|z| > 2) affects 9.2% of truly dark genes vs 4.0% of annotation-lag genes — consistent with recent horizontal gene transfer outpacing annotation databases.
Additionally, 12.0% of truly dark genes are within 2 genes of a mobile genetic element (transposase, integrase, or phage protein), further supporting HGT as a source of annotation resistance.
(Notebooks: 04_cross_organism_concordance.ipynb, 05_genomic_context.ipynb)
Finding 6: Stress enrichment hypothesis rejected (H2 rejected)
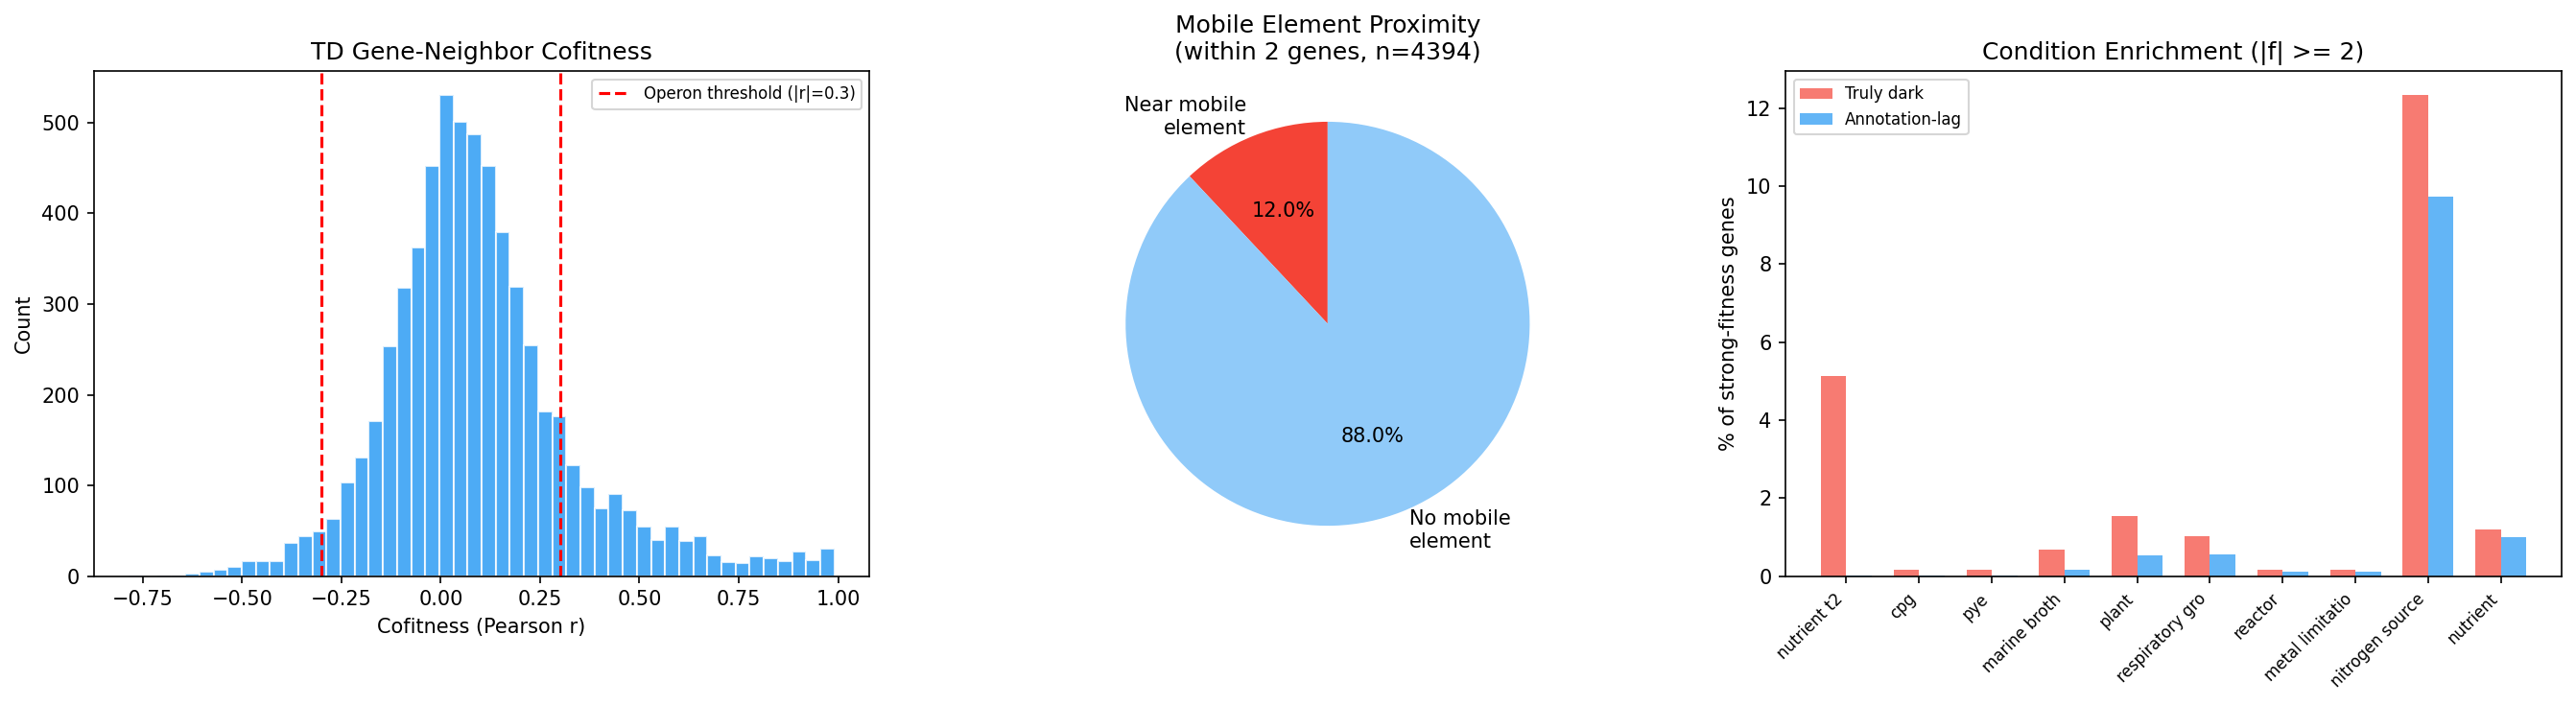
Contrary to H2, truly dark genes with strong fitness phenotypes (|f| ≥ 2) are depleted in stress conditions relative to annotation-lag genes (28.7% vs 43.2%, OR = 0.53, p < 0.001). Instead, truly dark genes are enriched in nutrient, mixed community, and iron conditions — suggesting they may encode novel metabolic or community-interaction functions rather than stress responses.
(Notebook: 05_genomic_context.ipynb)
Finding 7: 100 top candidates prioritized for experimental characterization
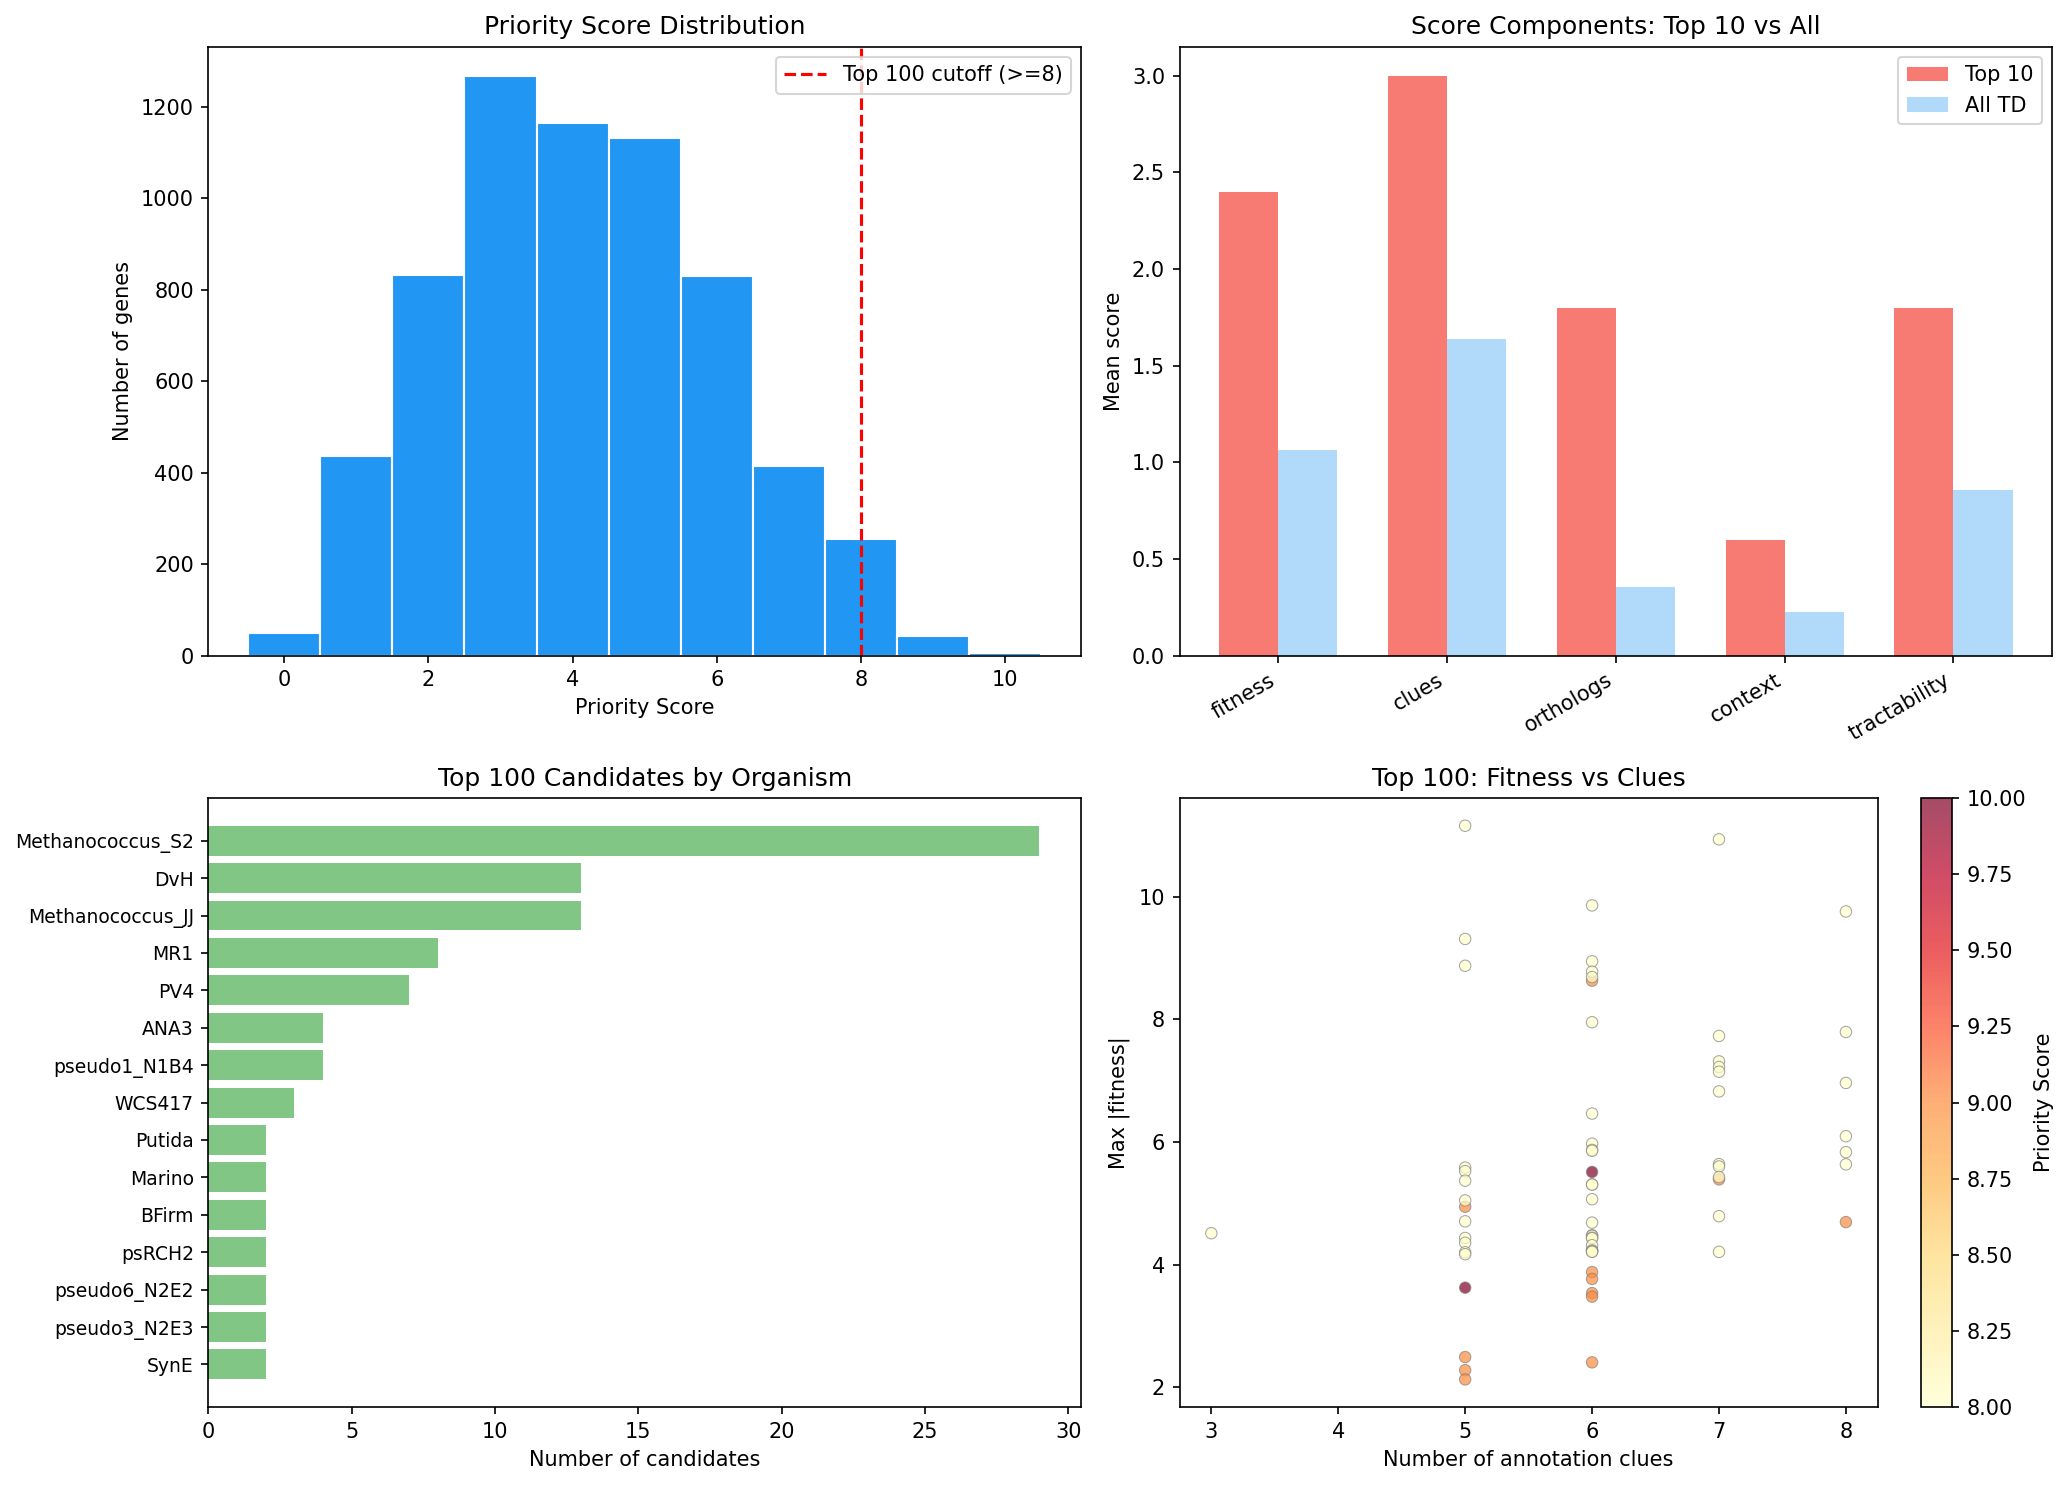
A multi-criteria scoring system (fitness importance, annotation clues, ortholog breadth, genomic context, tractability; max score 12) ranks all 6,427 truly dark genes and identifies 100 top candidates (scores 8–10) across 19 organisms.
Top candidates include:
- PV4/5210953 (score 10): Motility phenotype (|f| = 5.5), in operon with TatC (Sec-independent translocase), ICA module M016
- ANA3/7026383 (score 9): Nitrogen source phenotype (|f| = 8.6), in operon with ABC transporter, ICA module M018
- DvH/206658 (score 9): Stress phenotype (|f| = 5.4), eggNOG suggests "trehalose synthase" despite hypothetical annotation — a potential mis-annotation or novel variant
- Methanococcus_S2/MMP_RS06570 (score 9): 8 annotation clues including DUF190, COG-T (signal transduction), operon with fluoride efflux transporter CrcB
The top 100 candidates span 19 organisms, with Methanococcus_S2 (29), DvH (13), Methanococcus_JJ (13), and MR-1 (8) contributing the most. 34 are essential, 53 are in operons, and 30 are in ICA fitness modules.
Gap assessment: An estimated ~2,841 additional truly dark genes exist among the 17,479 unlinked dark genes (at the 16.3% truly-dark rate), including 2,208 with strong fitness phenotypes. Our ranked list covers ~69% of the estimated total truly dark gene population.
(Notebook: 06_experimental_prioritization.ipynb)
Results
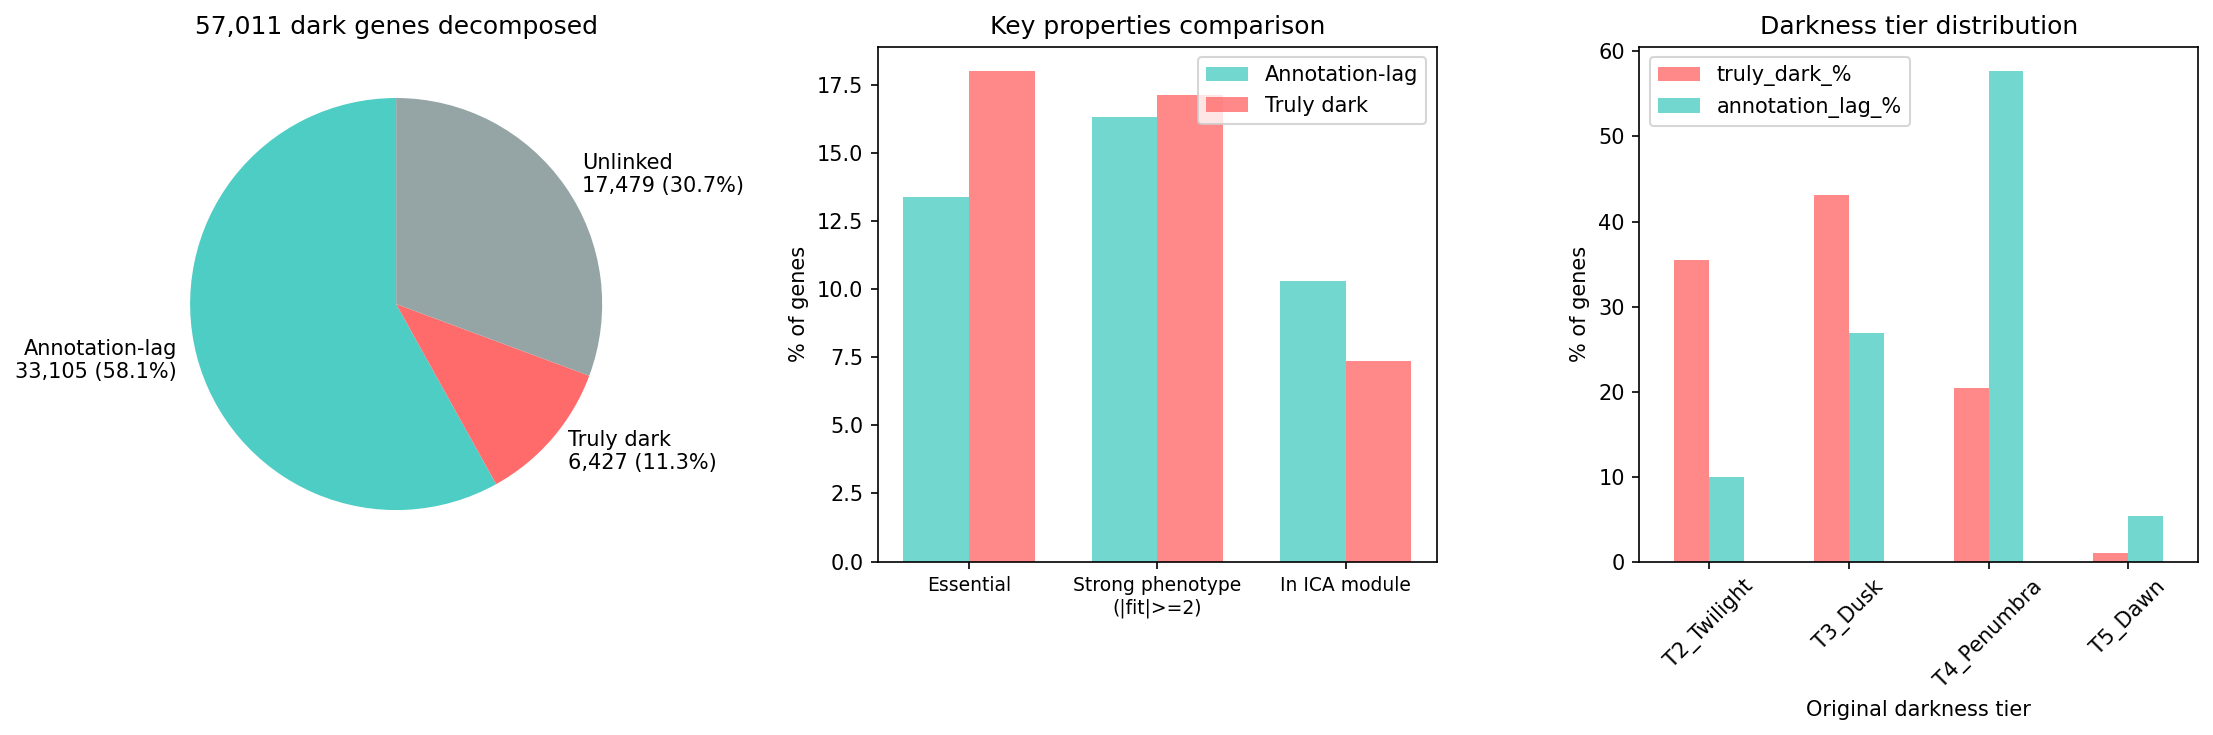
Census decomposition
The 57,011 Fitness Browser dark genes decompose into three categories:
| Category | Count | Description |
|---|---|---|
| Annotation-lag | 33,105 | Bakta v1.12.0 provides annotation — database vintage problem |
| Truly dark | 6,427 | Both FB and bakta call hypothetical — genuinely unknown |
| Unlinked | 17,479 | No pangenome link — bakta status unknown |
Sparse annotation landscape
Among 5,870 unique truly dark gene clusters:
- Pfam: 362 hits for 235 clusters (4.0%). TPR repeats dominate non-DUF hits. 56 clusters have DUF-only domains.
- Cross-refs: 26,917 entries for 4,971 clusters (84.7%). Dominated by SO/UniRef/UniParc identifiers; only 6 KEGG and 1 EC number.
- eggNOG: 2,551 annotations for 2,551 clusters (43.5%). Only 17.0% have COG categories, 4.6% have KEGG KOs.
- Orthologs: 3,449 pairs for 1,885 genes (29.3% of TD genes) across 48 FB organisms.
Genomic context
Among truly dark genes in ICA organisms (4,394 genes):
- 41% of neighboring genes are also hypothetical ("dark islands")
- 12.0% are within 2 genes of a mobile element
- 25.9% show operon-like cofitness (|r| ≥ 0.3) with adjacent genes
- 594 genes belong to ICA fitness modules, with guilt-by-association revealing functions including phage integrases, metal transporters, chemotaxis systems, and iron regulation
Condition enrichment
Truly dark genes with strong fitness (|f| ≥ 2) show distinctive condition profiles vs annotation-lag genes:
- Enriched in: mixed community (7.5% vs 0%), iron (0.7% vs 0%), nutrient time-series, rich media
- Depleted in: stress (43.3% vs 54.7%), carbon source (13.7% vs 21.7%), motility (1.2% vs 3.2%)
Interpretation
Biological significance
Truly dark genes represent genuinely novel biology, not annotation lag. The convergence of multiple independent lines of evidence — shorter sequences, accessory genome enrichment, higher GC deviation, proximity to mobile elements, and narrow taxonomic breadth — paints a consistent picture of recently acquired, rapidly evolving genes that have outpaced the growth of functional annotation databases.
The dominance of Methanococcus strains (55% of truly dark genes) reflects a well-known bias: archaeal proteins are systematically underrepresented in reference databases compared to bacteria. For archaea, even the "annotation lag" category underestimates true novelty, as Makarova et al. (2019) noted that archaeal genomic dark matter is disproportionately large and functionally unexplored.
The 41% hypothetical neighbor phenomenon
The finding that 41% of neighboring genes are also hypothetical suggests truly dark genes cluster in genomic "dark islands" — contiguous regions of unknown function. These islands likely represent:
1. Recently acquired genomic islands (consistent with HGT signatures)
2. Phage-derived regions (supported by integrase/phage protein proximity)
3. Species-specific gene neighborhoods that arose after the last common ancestor shared with well-studied organisms
Condition enrichment reinterpretation
The rejection of H2 (stress enrichment) is informative. Truly dark genes are enriched in community/nutrient conditions rather than stress — suggesting they may encode inter-species interaction functions, novel metabolic capabilities, or community-specific behaviors that are poorly represented in single-organism annotation databases. This aligns with the finding that many are near mobile elements: horizontally transferred genes often encode community-relevant functions (antibiotic resistance, bacteriocins, specialized metabolites).
Literature Context
- The 16.3% truly-dark rate (6,427/39,532) aligns with estimates of ORFan prevalence in bacterial genomes (10-30%; Siew & Fischer 2003), confirming that while databases have grown substantially, a hard core of genuinely novel proteins persists.
- The GC deviation and mobile element proximity signatures are consistent with Daubin et al. (2003) and others who showed that horizontally transferred genes are enriched among hypothetical proteins.
- The ICA module guilt-by-association approach extends the "guilt by association" principle (Oliver 2000) from expression to fitness data — a natural application given the Fitness Browser's phenotypic breadth.
- Pavlopoulos et al. (2023) demonstrated that global metagenomics can unravel functional dark matter at scale; our approach is complementary, using fitness phenotypes rather than metagenome context to prioritize candidates.
- Structure prediction (AlphaFold2/ESMFold + Foldseek) represents the next frontier for these candidates, as demonstrated by the rapid expansion of structural coverage for hypothetical proteins (van Kempen et al. 2024).
Novel Contribution
This project provides three contributions not previously available:
-
Quantitative decomposition: The 57,011 → 6,427 reduction separates annotation lag from genuine novelty, providing a tractable target set for experimental biology.
-
Multi-criteria prioritization: The 100-candidate ranked list integrates fitness importance, annotation clues, genomic context, ortholog breadth, and experimental tractability — enabling resource-efficient experimental campaigns.
-
Clue matrix: The 41-column annotation profile for each truly dark gene catalogs all available partial evidence, enabling hypothesis generation even for genes with no product annotation.
Limitations
- Pangenome linkage gap: 17,479 dark genes (31%) lack pangenome links and could not be assessed by bakta. An estimated ~2,841 of these may be truly dark, representing a 31% coverage gap in our prioritized list.
- Bakta false negatives: Some "hypothetical protein" calls may be bakta false negatives — genes with known functions that didn't match bakta's PSC database at the version tested (v6.0).
- Ortholog coverage: BBH orthologs cover only 32 of 48 FB organisms. Truly dark genes from the remaining 16 organisms lack concordance and ortholog breadth data.
- GC deviation as HGT proxy: GC deviation is an imperfect HGT indicator — it can also reflect gene-specific composition biases (e.g., membrane proteins) or amelioration over time.
- Gene length confound: Short genes are inherently harder to annotate (fewer domains, fewer homologs) AND harder to measure fitness for (fewer TA sites). The length difference (d = −0.432) may partially explain other observed differences.
- Fitness measurement artifacts: Some strong phenotypes may reflect polar effects on downstream genes rather than genuine function of the truly dark gene itself.
Future Directions
-
Structure prediction: Run AlphaFold2/ESMFold on top-100 candidates and search Foldseek for remote structural homologs — the most promising path to functional annotation for sequences with no detectable sequence homology.
-
Experimental validation: Growth assays for top candidates in predicted conditions (e.g., PV4/5210953 in motility assays, ANA3/7026383 in nitrogen limitation). Mobile-CRISPRi (Peters et al. 2019) could enable rapid functional testing across organisms.
-
Unlinked gene assessment: Extend pangenome linkage to cover the 17,479 unlinked dark genes, then run bakta to identify additional truly dark candidates and expand the priority list.
-
Dark island characterization: Investigate the genomic "dark islands" (contiguous hypothetical regions) as potential functional units — some may be prophage remnants, others may be recently acquired metabolic cassettes.
-
Methanococcus deep-dive: Given that archaea contribute 55% of truly dark genes, a focused Methanococcus analysis could leverage the high cofitness signals (r > 0.97) to map operonic structure and generate functional predictions for archaeal-specific hypothetical proteins.
Data
Sources
| Collection | Tables Used | Purpose |
|---|---|---|
kescience_fitnessbrowser |
gene, ortholog |
Gene properties (length, GC, position), cross-organism orthologs |
kbase_ke_pangenome |
bakta_pfam_domains, bakta_db_xrefs, eggnog_mapper_annotations |
Pfam domain hits, database cross-references, eggNOG functional annotations |
Generated Data
| File | Rows | Description |
|---|---|---|
truly_dark_genes.tsv |
6,427 | Core truly dark gene list with fitness, essentiality, and annotation data |
annotation_lag_genes.tsv |
33,105 | Annotation-lag genes (bakta reclassified) for comparison |
unlinked_dark_genes.tsv |
17,479 | Dark genes without pangenome links |
truly_dark_pfam.tsv |
362 | Pfam domain hits for truly dark gene clusters |
truly_dark_xrefs.tsv |
26,917 | Database cross-references for truly dark gene clusters |
truly_dark_eggnog.tsv |
2,551 | eggNOG-mapper annotations for truly dark gene clusters |
truly_dark_orthologs.tsv |
3,449 | Fitness Browser ortholog pairs involving truly dark genes |
gene_properties.tsv |
39,532 | Gene properties (GC, length, position) for TD + AL genes |
truly_dark_clue_matrix.tsv |
6,427 | 41-column clue matrix with all partial annotations |
genomic_context.tsv |
6,427 | Mobile element proximity, cofitness, operon membership |
prioritized_truly_dark_candidates.tsv |
6,427 | Full ranked list with multi-criteria priority scores |
top100_candidates.tsv |
100 | Top 100 candidates with functional hypotheses |
organism_summary.tsv |
44 | Per-organism truly dark gene counts and fractions |
concordance_truly_dark.tsv |
3 | Cross-organism concordance for truly dark OGs |
References
- Price MN, Wetmore KM, Waters RJ, Callaghan M, Ray J, Liu H, Kuehl JV, Melnyk RA, Lamson JS, Cai Y, et al. (2018). "Mutant phenotypes for thousands of bacterial genes of unknown function." Nature 557:503–509. PMID: 29769716
- Price MN, Deutschbauer AM, Arkin AP. (2024). "A comprehensive update to the Fitness Browser." mSystems 9:e00470-24.
- Arkin AP, Cottingham RW, Henry CS, Harris NL, Stevens RL, Masber S, et al. (2018). "KBase: The United States Department of Energy Systems Biology Knowledgebase." Nature Biotechnology 36:566–569. PMID: 29979655
- Wetmore KM, Price MN, Waters RJ, Lamson JS, He J, Hoover CA, Blow MJ, Bristow J, Butland G, Arkin AP, Deutschbauer A. (2015). "Rapid quantification of mutant fitness in diverse bacteria by sequencing randomly bar-coded transposons." mBio 6:e00306-15. PMID: 25968644
- Schwengers O, Jelonek L, Giber MA, Gutzelmann F, Tremendous J,3rd, et al. (2021). "Bakta: rapid and standardized annotation of bacterial genomes via alignment-free sequence identification." Microbial Genomics 7:000685. PMID: 34739369
- Cantalapiedra CP, Hernández-Plaza A, Letunic I, Bork P, Huerta-Cepas J. (2021). "eggNOG-mapper v2: functional annotation, orthology assignments, and domain prediction at the metagenomic scale." Molecular Biology and Evolution 38:5825–5829. PMID: 34597405
- Makarova KS, Wolf YI, Koonin EV. (2019). "Towards functional characterization of archaeal genomic dark matter." Biochem Soc Trans 47:389–398. PMID: 30647141
- Pavlopoulos GA, Baltoumas FA, Liu S, Noval Rivas M, Pinto-Cardoso S, et al. (2023). "Unraveling the functional dark matter through global metagenomics." Nature 622:594–602. PMID: 37821698
- Peters JM, Koo BM, Patidar R, Heber CC, Tekin S, Cao K, Terber K, Lanze CE, Sirothia IR, Murray HJ, et al. (2019). "Enabling genetic analysis of diverse bacteria with Mobile-CRISPRi." Nature Microbiology 4:244–250. PMID: 30617347
- Siew N, Fischer D. (2003). "Analysis of singleton ORFans in fully sequenced microbial genomes." Proteins 53:241–251. PMID: 14517976
- Daubin V, Lerat E, Perrière G. (2003). "The source of laterally transferred genes in bacterial genomes." Genome Biology 4:R57. PMID: 12952534
- van Kempen M, Kim SS, Tumescheit C, Mirdita M, Lee J, Gilchrist CLM, Söding J, Steinegger M. (2024). "Fast and accurate protein structure search with Foldseek." Nature Biotechnology 42:243–246. PMID: 37156916
Discoveries
Of 39,532 Fitness Browser dark genes with pangenome links, bakta v1.12.0 reclassifies 33,105 (83.7%). Just 6,427 are "truly dark" — both FB and bakta agree: hypothetical protein. Truly dark genes are structurally distinct: shorter (121 vs 194 aa), less conserved (43% vs 73% core), fewer orthologs (2
Read more →41% of neighbors of truly dark genes are also hypothetical, 12% are within 2 genes of mobile elements (transposases, integrases, phage proteins). This suggests dark genes concentrate in recently acquired genomic islands rather than being randomly distributed.
Contrary to expectation, truly dark genes with strong fitness phenotypes are depleted in stress conditions (OR=0.53, p<0.001) and enriched in nutrient, mixed community, and iron conditions. This suggests novel metabolic or inter-species interaction functions rather than stress responses.
Only 246/6,427 (3.8%) truly dark genes have zero annotation clues. 84.7% have database cross-references, 43.5% have eggNOG hits (though 55% of COG assignments are "S"/unknown), 29.3% have cross-organism orthologs, 9.5% are in ICA fitness modules.
Data Collections
Derived Data
This project builds on processed data from other projects.
Review
Summary
This is a well-structured and scientifically rigorous project that takes the 57,011 "dark" genes from the functional_dark_matter project and refines them into a tractable set of 6,427 genuinely unknown genes by leveraging bakta v1.12.0 reannotation to separate annotation lag from true biological novelty. The project excels at hypothesis-driven analysis with pre-registered statistical thresholds, honest reporting of negative results (H2 rejection), thorough data reuse from prior projects, and a clearly written report with proper limitations. The 6-notebook pipeline progresses logically from census through enrichment, annotation mining, concordance, genomic context, and prioritization, producing a well-justified top-100 candidate list. Areas for improvement include a minor code quality issue (regex warning in NB05), an incomplete concordance validation in NB03, the GC deviation analysis using only dark genes rather than genome-wide GC to compute organism means, and a scoring system that may over-weight essentiality relative to functional clues. Overall, this is one of the stronger observatory projects in terms of methodological rigor and clear reporting.
Methodology
Research question: Clearly stated, testable, and appropriately scoped. The decomposition of 57,011 dark genes into annotation-lag (33,105), truly dark (6,427), and unlinked (17,479) is well-motivated by the parent project's NB12 finding that 83.7% of linked dark genes gain bakta annotations.
Hypotheses: Four hypotheses (H0/H1 on structural distinctiveness, H2 on stress enrichment, H3 on accessory genome/HGT, H4 on partial annotation clues) are precisely stated with pre-registered effect size thresholds (Cohen's d >= 0.2 or OR >= 1.5). The honest rejection of H2 is a strength -- many projects would downplay or ignore a negative result.
Data sources: Well documented in both README.md and RESEARCH_PLAN.md. The data reuse strategy (loading parent project outputs rather than re-querying) is efficient and reduces opportunities for inconsistency. Five BERDL tables and four prior observatory projects are leveraged.
Statistical framework: Appropriate -- Mann-Whitney U for continuous variables, Fisher's exact for categorical, with Benjamini-Hochberg FDR correction across all comparisons (NB01 cell 30). Effect sizes are reported alongside p-values, which is good practice given the large sample sizes where even trivial effects can be "significant."
Reproducibility: The README includes a Reproduction section with clear steps. Dependencies are in requirements.txt (6 packages). The Spark/local separation is documented (NB01-NB02 need Spark, NB03-NB06 run locally). All intermediate data is saved to data/, enabling re-running downstream notebooks without Spark access.
Code Quality
SQL correctness: The Spark queries in NB02 are well-constructed. The project correctly uses temp view JOINs rather than IN clauses for the 5,870 gene cluster IDs (as recommended in RESEARCH_PLAN.md and consistent with docs/pitfalls.md guidance on large ID lists). The eggnog_mapper_annotations query correctly joins on query_name (not gene_cluster_id), avoiding the foreign key pitfall documented in docs/pitfalls.md. The CAST(g.begin AS INT) and CAST(g.end AS INT) in the gene properties query correctly handles the string-typed numeric column pitfall.
Notebook organization: Each notebook follows a clean structure: markdown header with goal/input/output, imports, data loading, analysis, visualization, save, and summary. The progression from NB01 through NB06 is logical and each notebook's outputs feed into the next.
Known pitfall awareness: The project addresses several docs/pitfalls.md issues:
- String-typed numeric columns: CAST used correctly in NB02 (cell 11)
- Gene clusters are species-specific: Not compared across species
- eggnog_mapper_annotations.query_name join key: Used correctly in NB02 (cell 9)
- Temp view approach for large ID lists: Used correctly in NB02
Issues identified:
-
NB05 cell 5: Invalid regex escape sequence warning: The line
mobile_keywords = ['transpos', 'integrase', 'recombinase', 'phage', 'IS\d', ...]uses a non-raw string containing\d, which produces aSyntaxWarning: invalid escape sequence '\d'. This should ber'IS\d'or'IS\\d'. The warning appears in the output but the code still works because Python currently passes unrecognized escape sequences through, though this behavior is deprecated. This is a minor code quality issue, not a correctness bug. -
NB04 cell 12: GC deviation computed from dark genes only: The organism mean GC is computed from
gene_props, which contains only truly dark + annotation-lag genes (39,532 genes), not all genes in each organism. This means the "genome mean GC" is actually the "dark gene mean GC" for each organism. This biases the deviation calculation -- the true organism-wide GC mean from all ~228K FB genes could differ, especially for organisms with few dark genes. The effect on H3's conclusion is likely small (the comparison is still TD vs AL within the same reference frame), but the description of the metric as "organism mean GC" is not quite accurate. -
NB03 cell 19: Concordance-clue validation incomplete: The concordance data uses
ogIdas its key (notorgId/locusId), so the matching attempt fails. The notebook correctly notes this ("Concordance columns: ['ogId', ...]") and defers to NB04, but NB04 does not actually perform the clue-concordance validation either. The RESEARCH_PLAN specified "validate that clue combinations are informative by testing whether genes with more clues have higher cross-organism concordance rates" -- this was not completed. Given that only 3 OGs contain truly dark genes, the sample size would be too small for a meaningful test anyway, which could be stated explicitly. -
NB06 scoring: Essential genes may be over-weighted: Essential genes receive score_fitness=3 regardless of whether they have any measured fitness phenotype (many essential genes show
max_abs_fit=nanbecause they have no insertions). This means essential genes with no measured fitness data (e.g., rank #3 Putida/PP_2706 with|f|=nan) score the same as genes with extremely strong measured phenotypes. The scoring treats absence of data (no insertions) the same as strong evidence of function. This is a valid design choice but worth acknowledging -- 34 of the top 100 candidates are essential with nan fitness, and their "importance" is inferred from essentiality rather than observed phenotypes. -
NB01 cell 12: Gene length estimated from molecular weight: Protein length is estimated as
molecular_weight / 110(110 Da per amino acid). This is a reasonable approximation but the actual average amino acid molecular weight is ~111-113 Da depending on composition. The estimate introduces ~1-3% systematic error, which is negligible for the statistical comparisons but could be noted. -
NB03 cell 8: Pfam and eggNOG clue counts differ from NB02: NB02 reports 235 clusters with Pfam hits and 2,551 with eggNOG, but NB03's clue matrix shows
has_pfam=288andhas_eggnog=2,934. The discrepancy arises because NB03 merges ongene_cluster_id(6,427 genes but only 5,870 unique clusters), so multiple genes mapping to the same cluster each get counted. NB02 counts unique clusters while NB03 counts genes. Both are correct but the difference is not explained in the notebooks. The REPORT.md uses both numbers in different places (4.0% for clusters in Finding 3, 4.5% for genes in Finding 4), which could cause confusion.
Findings Assessment
Conclusions well-supported: The findings are generally well-supported by the data shown:
- H1 (structural distinctiveness): Strong evidence across multiple metrics with large effect sizes. The core genome fraction OR of 0.284 and ortholog breadth Cohen's d of -1.072 are particularly compelling.
- H3 (accessory/HGT): Supported by GC deviation, mobile element proximity, and reduced ortholog breadth, though the GC deviation effect size (d=0.247) is modest.
- H4 (partial clues): The 96.2% coverage with at least one clue is clear and well-visualized.
- H2 (stress enrichment): Honestly rejected with OR=0.53 in the opposite direction.
Limitations acknowledged: The REPORT.md has a thorough Limitations section covering pangenome linkage gap, bakta false negatives, ortholog coverage, GC deviation caveats, gene length confound, and fitness artifacts. The gene length confound (d = -0.432) is particularly important because shorter genes are inherently harder to annotate, and this could partially explain many of the other observed differences. The report acknowledges this but does not perform length-stratified analyses to quantify how much of the H1 signal survives after controlling for length.
Incomplete analysis: The clue-concordance validation (whether more clues predict higher concordance) was planned but not completed, as noted above. This is acknowledged implicitly by the project moving on.
REPORT.md quality: Well-organized with clear findings, a detailed results section, thoughtful interpretation including literature context, and specific future directions. The references are appropriate and properly cited.
Condition enrichment interpretation: The REPORT.md claims truly dark genes are enriched in "mixed community" and "iron" conditions, and the data supports this (7.5% vs 0% for mixed community). However, some of the extreme enrichment ratios (e.g., 181x for "nutrient t2") appear driven by a single organism's contribution to the truly dark set and the small denominator in the annotation-lag set. No formal statistical test (e.g., Fisher's exact per condition class with FDR correction) was applied to the condition enrichment -- only descriptive percentages are reported.
Suggestions
-
Fix the regex warning in NB05: Change
'IS\d'tor'IS\d'in cell 5. This is a trivial fix that prevents the SyntaxWarning and future-proofs the code against Python's planned deprecation of unrecognized escape sequences. -
Compute organism GC means from all FB genes, not just dark genes: In NB04 cell 12, the "genome mean GC" should ideally be computed from the full
kescience_fitnessbrowser.genetable (all 228K genes), not the 39,532-gene dark subset. This could be done with a single Spark query in NB02 or by loading the full gene table. Add a comment if the current approach is kept, noting that the baseline is dark-gene-only. -
Add length-stratified analysis for H1: The gene length difference (d = -0.432) is a potential confound for other comparisons. Add a brief analysis in NB01 that repeats key comparisons (conservation, ortholog breadth) within matched length bins (e.g., 50-150 aa, 150-300 aa, 300+ aa). This would strengthen the H1 conclusion by showing which effects persist after controlling for length.
-
Apply statistical tests to condition enrichment: The condition enrichment analysis in NB05 (cell 11-12) uses only descriptive percentages. Add Fisher's exact tests with BH-FDR correction for individual condition classes to identify which specific enrichments are statistically significant. The current analysis only tests stress vs non-stress as a group, missing the opportunity to formally test individual conditions.
-
Clarify Pfam/eggNOG count discrepancies: Add a brief note in NB03 or the REPORT explaining why the clue matrix gene counts (288 with Pfam, 2,934 with eggNOG) differ from the NB02 unique cluster counts (235 and 2,551). The distinction between "genes" and "clusters" is important and currently left to the reader to figure out.
-
Acknowledge incomplete concordance-clue validation: Add an explicit note in NB04 or the REPORT stating that the planned clue-concordance validation could not be completed due to insufficient sample size (only 3 truly dark OGs with concordance data). This is a minor gap given the data constraint, but should be documented rather than silently dropped.
-
Consider revising the scoring for essential genes with no fitness data: The current scoring gives essential genes with
max_abs_fit=nanthe same fitness score (3) as genes with extreme measured phenotypes. Consider either (a) splitting essentiality into its own scoring axis rather than bundling it with fitness magnitude, or (b) adding a bonus for genes that are essential AND have measured phenotypes in specific conditions. Many of the top-100 candidates (particularly the DvH essential genes ranked #21-30) have no functional clues and no measured phenotype -- their high ranking is driven entirely by essentiality + tractability + orthologs. -
Document the 41% hypothetical neighbor finding more prominently: The "dark islands" finding (41% of neighbors are hypothetical) is one of the most interesting results and gets good coverage in the REPORT's interpretation section, but the analysis in NB05 only reports the aggregate mean. A figure showing the distribution of per-gene hypothetical neighbor fraction, or examples of the longest dark islands, would strengthen this finding.
-
Minor: Add
statsmodelsto the requirements.txt description: Therequirements.txtcorrectly listsstatsmodels, but the README's Dependencies section only mentionsnumpy, pandas, matplotlib, seaborn, scipy--statsmodelsis missing from that list.
This review was generated by an AI system. It should be treated as advisory input, not a definitive assessment.
Visualizations
Fig01 Organism Distribution
Fig02 Gene Length
Fig03 Summary Comparison
Fig04 Clue Coverage
Fig05 Annotation Tiers
Fig06 Ortholog Breadth
Fig07 Gc Deviation
Fig08 Genomic Context
Fig09 Prioritization
Notebooks
01_truly_dark_census.ipynb
01 Truly Dark Census
View notebook →
02_spark_enrichment.ipynb
02 Spark Enrichment
View notebook →
03_sparse_annotation_mining.ipynb
03 Sparse Annotation Mining
View notebook →
04_cross_organism_concordance.ipynb
04 Cross Organism Concordance
View notebook →
05_genomic_context.ipynb
05 Genomic Context
View notebook →
06_experimental_prioritization.ipynb
06 Experimental Prioritization
View notebook →