The 5,526 Costly + Dispensable Genes
CompletedResearch Question
What characterizes genes that are simultaneously burdensome (fitness improves when deleted) and not conserved in the pangenome? Are they mobile elements, recent acquisitions, degraded pathways, or something else?
Overview
The core_gene_tradeoffs project identified a 2x2 selection signature matrix of 142,190 genes: 28,017 are "costly + conserved" (maintained by natural selection despite lab-measured burden), while 5,526 are "costly + dispensable" (burdensome AND not in the core genome). This project characterizes the 5,526 costly+dispensable genes to determine whether they represent recent horizontal acquisitions, degrading ancestral functions, or mobile genetic elements. The analysis uses functional annotation enrichment (SEED, KEGG), ortholog breadth across 48 organisms, gene length distributions, and per-organism variation. See REPORT.md for full findings and interpretation.
Key Findings
Costly+Dispensable Genes Are Mobile Genetic Elements
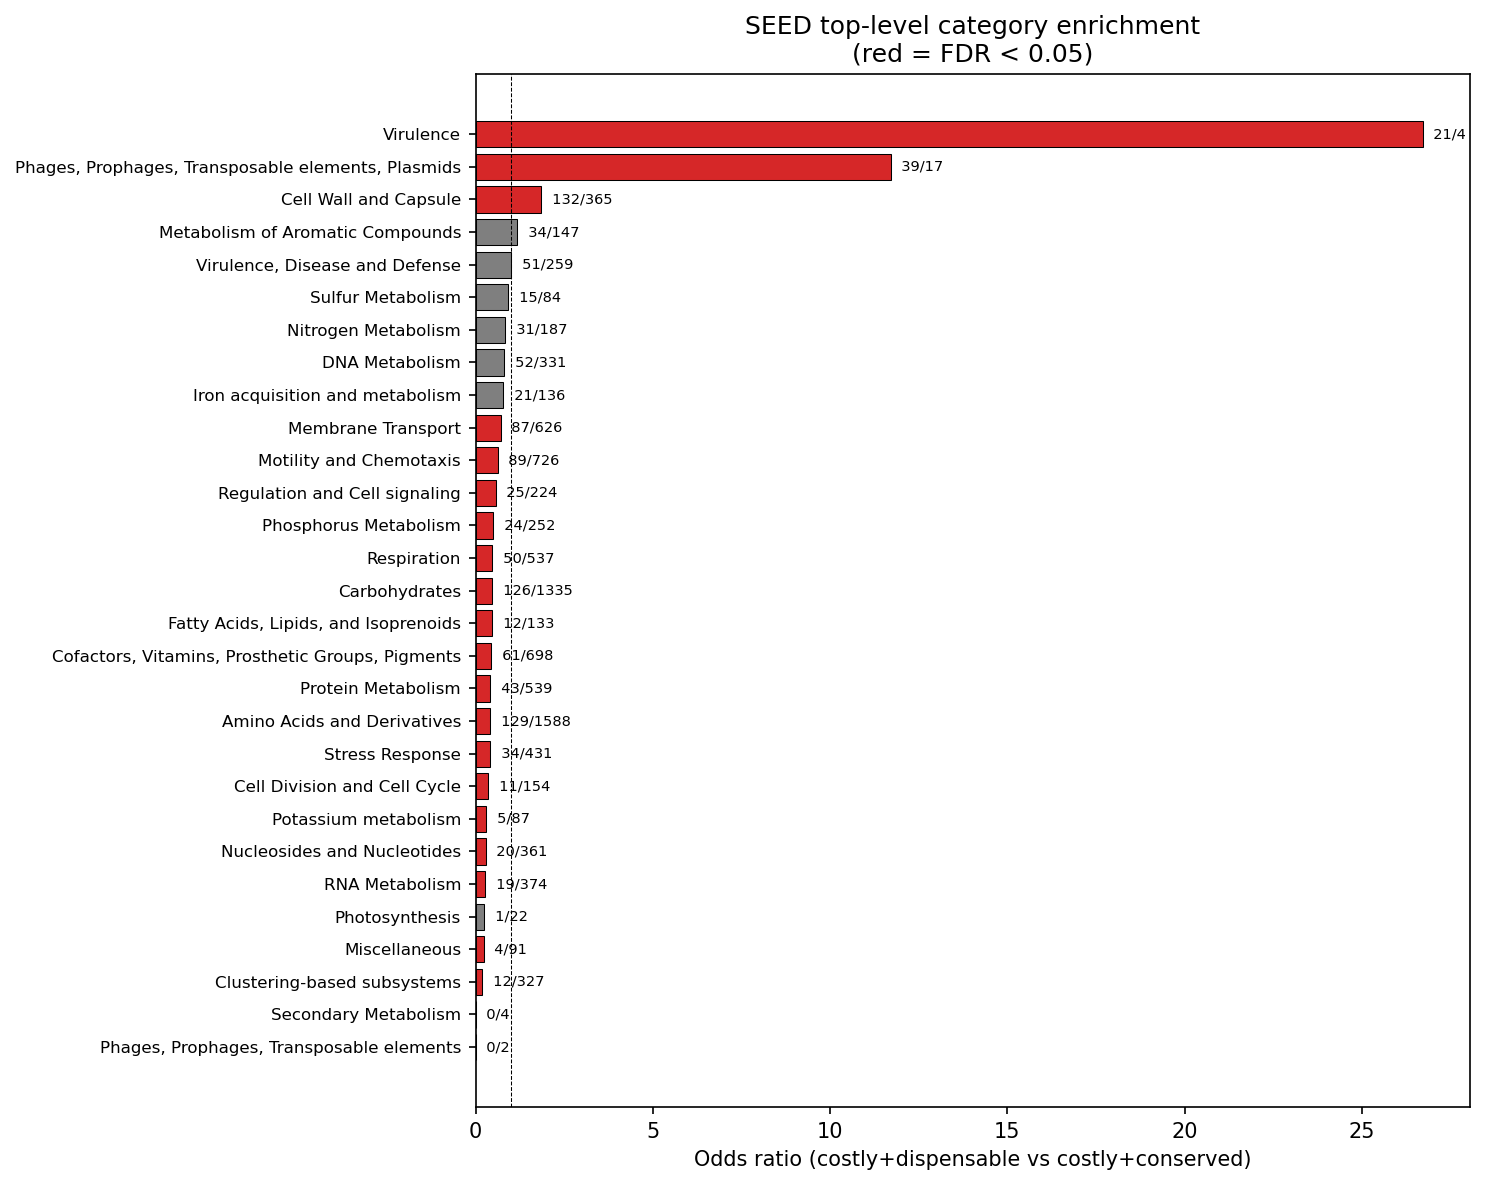
The 5,526 costly+dispensable genes are overwhelmingly associated with mobile genetic elements. They are 7.45x more likely to contain mobile element keywords in their descriptions (transposase, integrase, phage, IS element, recombinase, prophage; OR=7.45, p=4.6e-71). SEED functional enrichment confirms this: the "Phages, Prophages, Transposable elements, Plasmids" category is 11.7x enriched (FDR=1.3e-17) and "Virulence" is 26.7x enriched (FDR=5.6e-14, though based on small counts: 21 vs 4 genes) in costly+dispensable vs costly+conserved genes.
(Notebook: 02_functional_characterization.ipynb)
They Are Poorly Characterized Recent Acquisitions
Costly+dispensable genes have the hallmarks of recently acquired DNA:
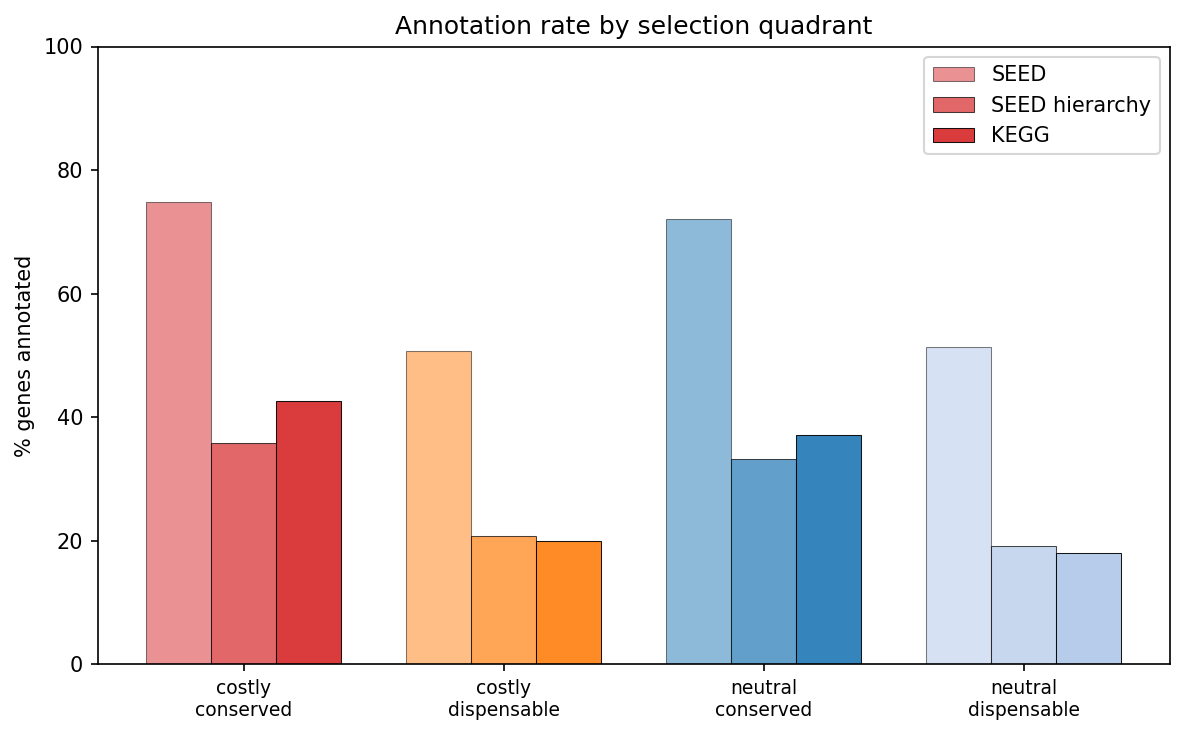
- Poorly annotated: 50.8% have SEED annotations vs 74.9% for costly+conserved; only 20.0% have KEGG annotations vs 42.7%
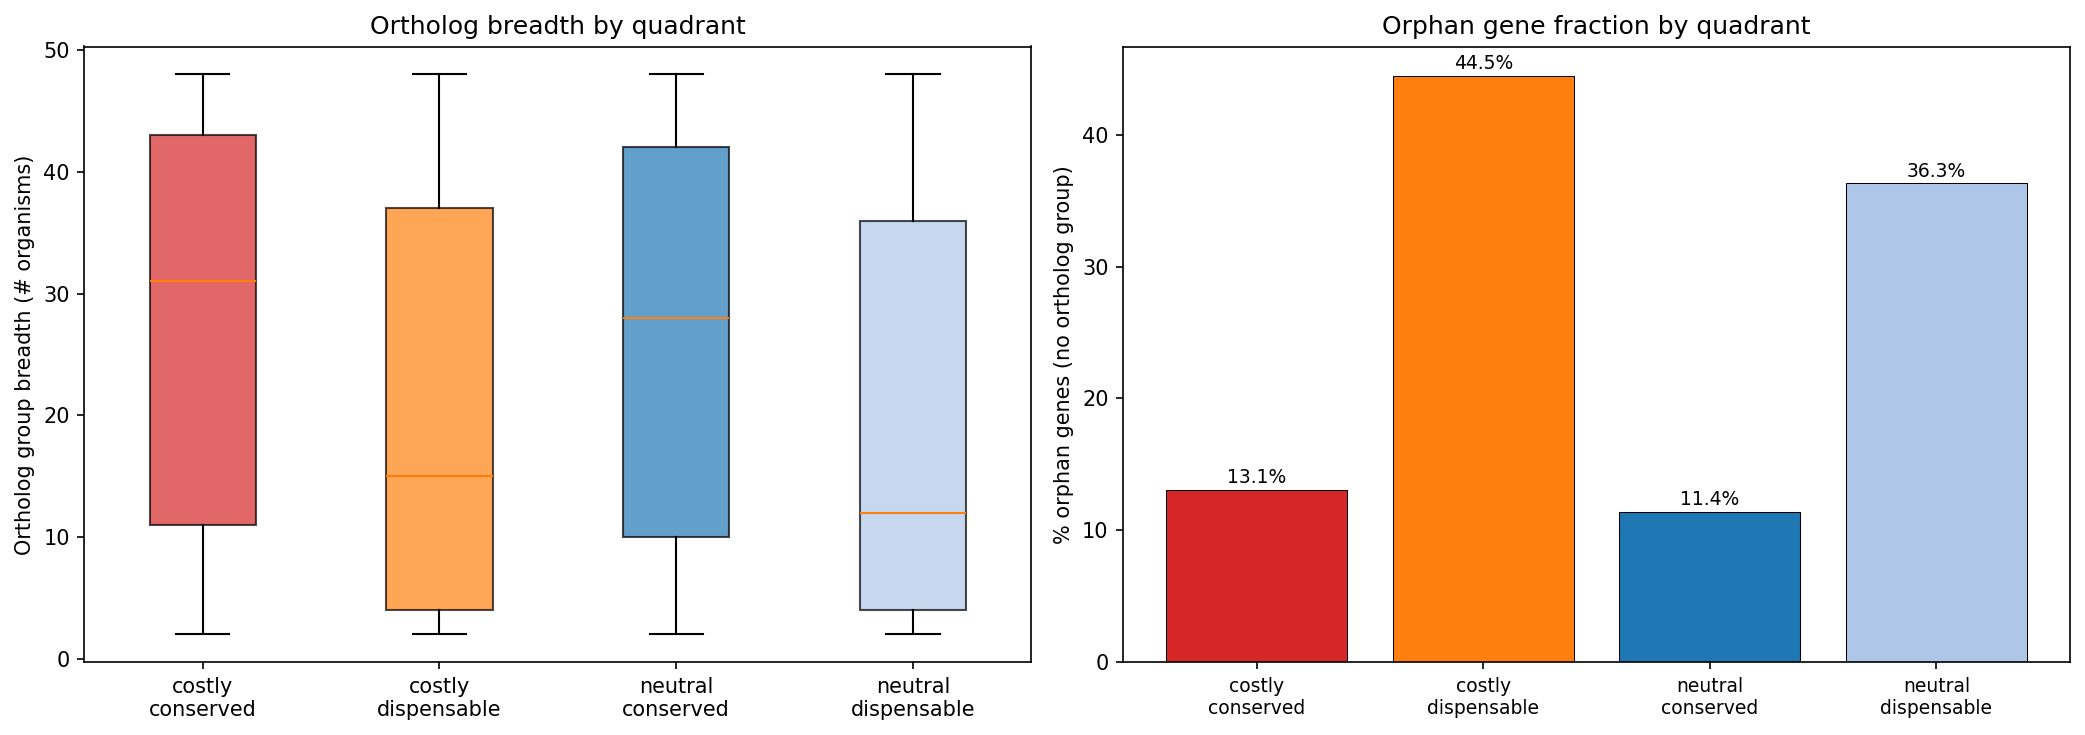
- Taxonomically restricted: 44.5% are orphan genes (no ortholog group) vs 13.1% for costly+conserved
- Narrow ortholog breadth: Median 15 organisms share the OG vs 31 for costly+conserved (Mann-Whitney p=4.0e-99, rank-biserial r=0.233)
- High singleton fraction: 24.2% are singletons (found in only 1 genome); no costly+conserved genes are singletons. Note: this is partly structural since core genes cannot be singletons by definition. Within the dispensable category, costly genes are only slightly more likely to be singletons than neutral genes (OR=1.09, p=0.02)
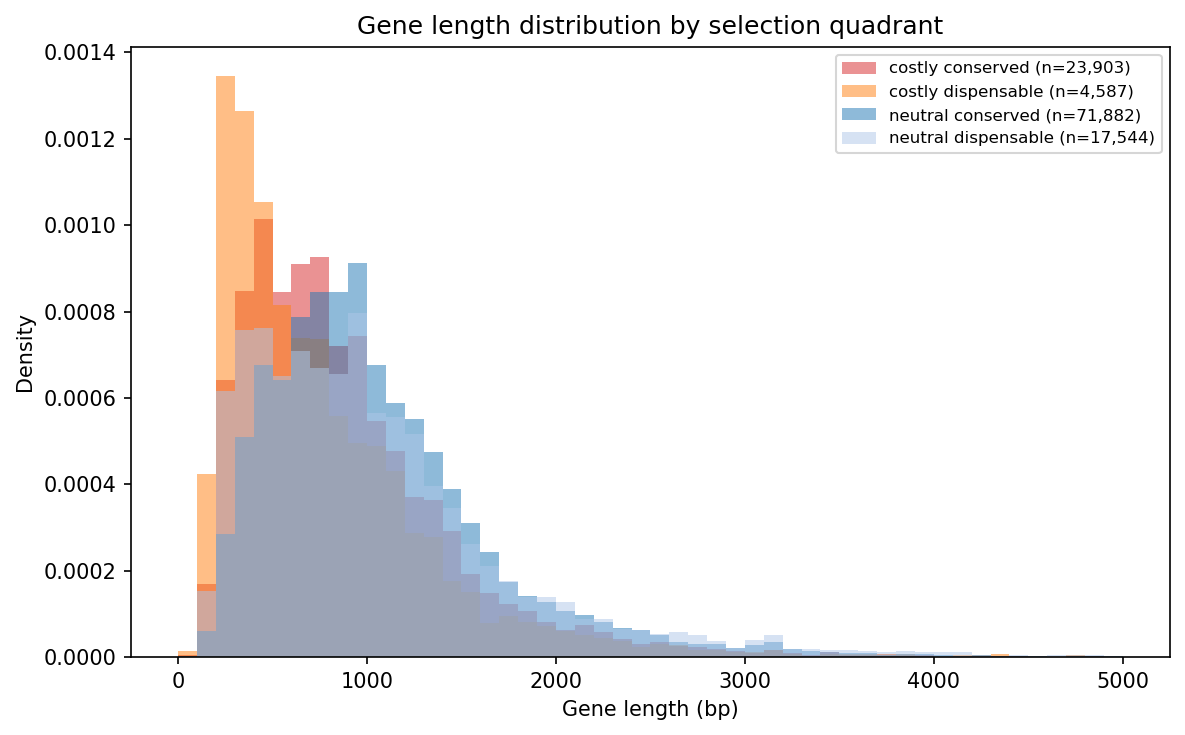
- Shorter: Median 615 bp vs 765 bp for costly+conserved (p=4.2e-75, rank-biserial r=0.170), consistent with IS elements and gene fragments
(Notebook: 02_functional_characterization.ipynb, 03_evolutionary_context.ipynb)
Core Metabolism Is Depleted
14 SEED top-level categories are significantly depleted in costly+dispensable genes (FDR < 0.05), including Protein Metabolism, Respiration, Carbohydrates, Amino Acids, Cofactors/Vitamins, Motility, Stress Response, and RNA Metabolism. These core cellular functions are maintained in the costly+conserved quadrant -- genes whose lab-measured burden is offset by natural selection in the environment.
(Notebook: 02_functional_characterization.ipynb)
Pseudomonas stutzeri RCH2 Is an Outlier
psRCH2 contributes 21.5% of its genes as costly+dispensable -- far above the next organism (B. thetaiotaomicron at 14.0%). This suggests a recent mobile element invasion or genomic expansion specific to this strain.
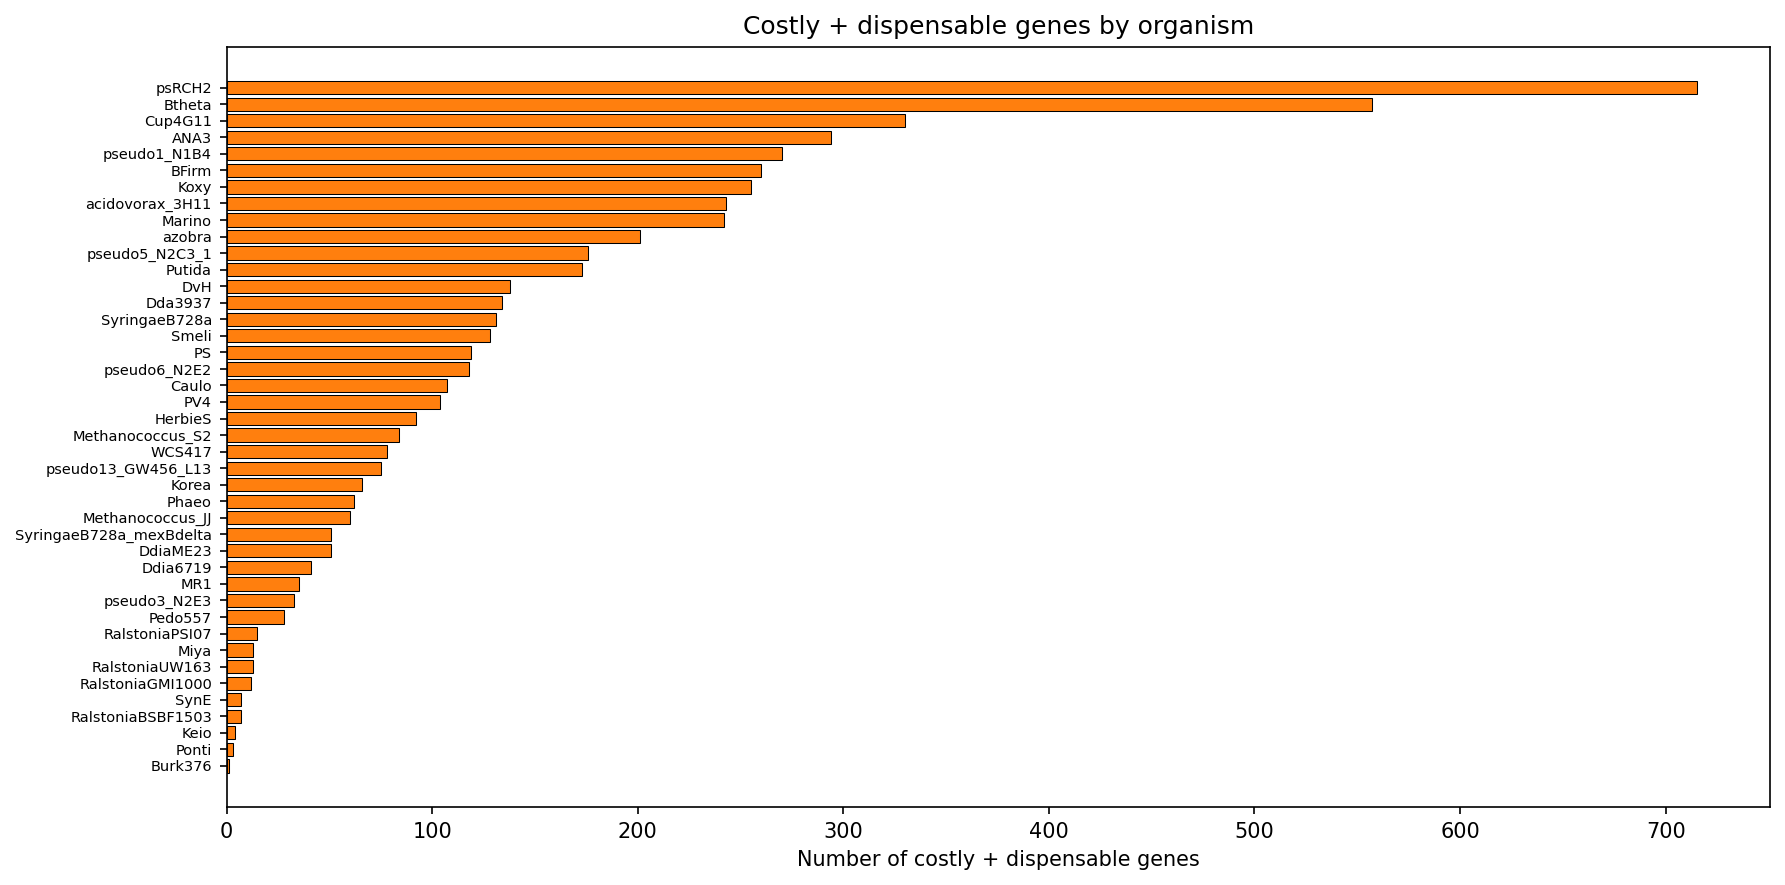
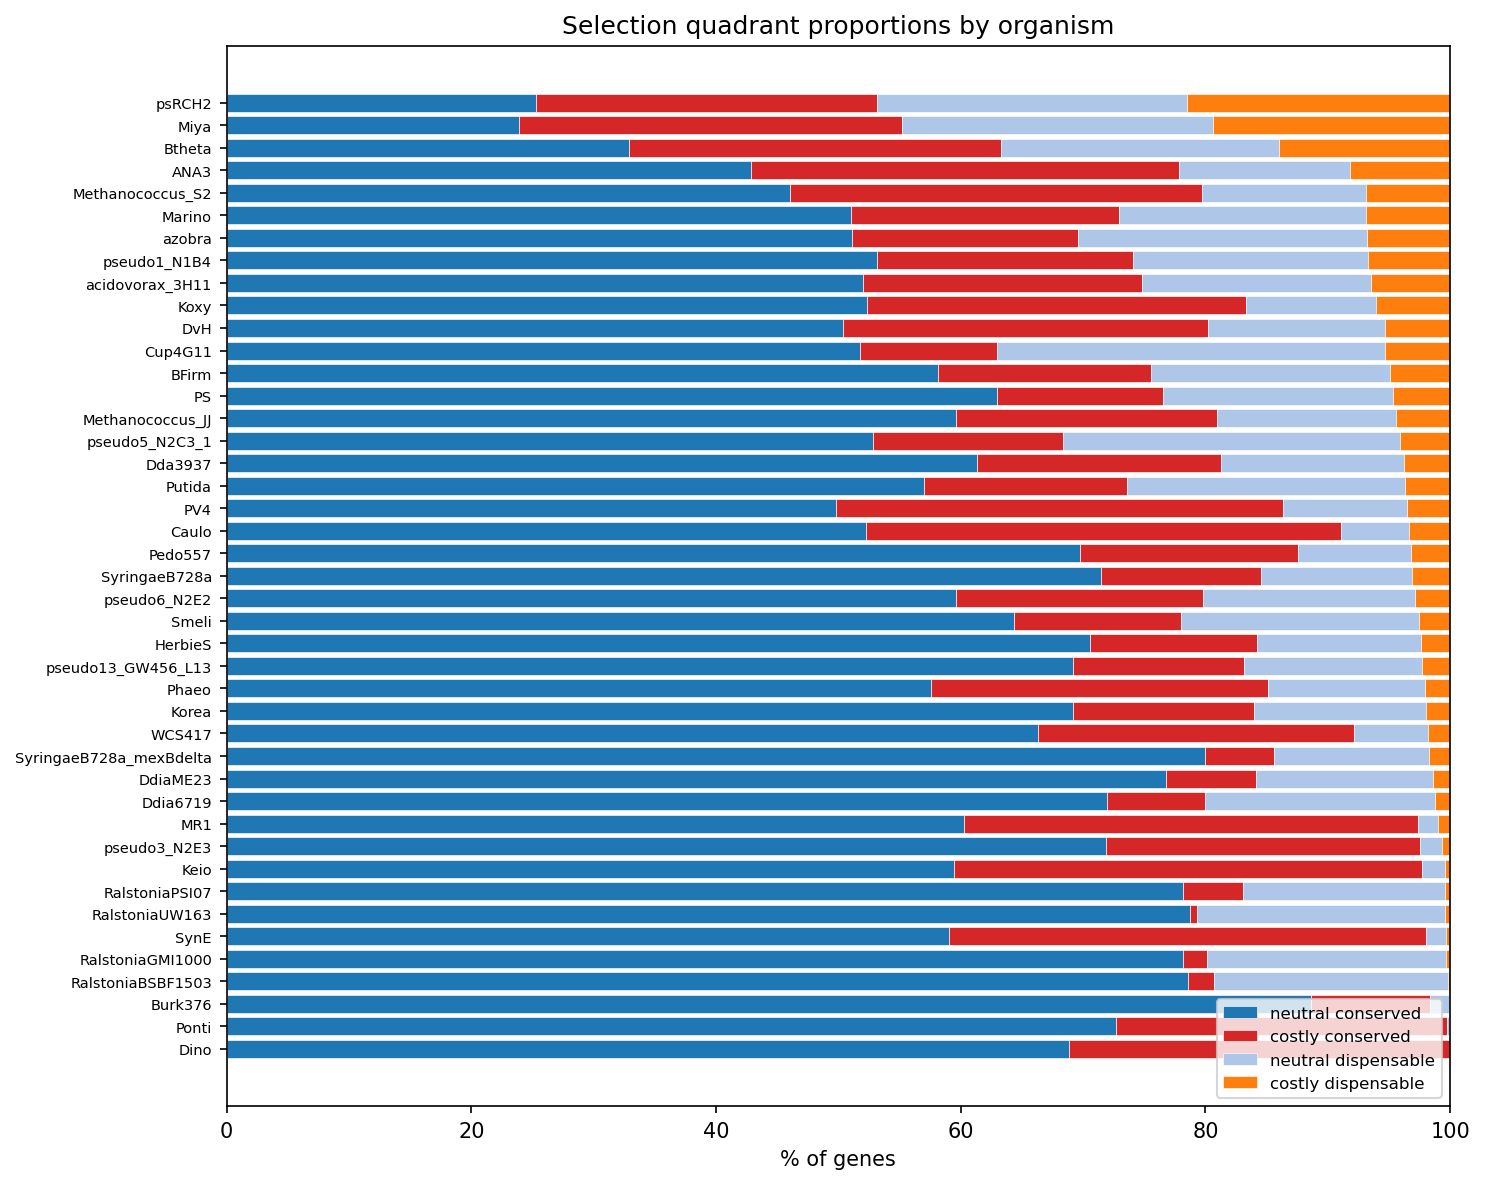
(Notebook: 03_evolutionary_context.ipynb)
Costly+Dispensable Genes Still Have Condition-Specific Effects
Despite being burdensome and non-conserved, 14.1% of costly+dispensable genes have condition-specific phenotypes (vs 16.7% for costly+conserved). This is much higher than neutral+dispensable genes (2.7%), suggesting these genes are not inert -- they can affect fitness under specific conditions, which may slow their loss from the genome.
(Notebook: 01_define_quadrants.ipynb)
Interpretation
The costly+dispensable genes represent the genomic debris of horizontal gene transfer -- insertion sequences, prophage remnants, transposases, and defense systems that impose metabolic cost on their host and are not conserved across the species pangenome. Their profile matches the predictions for recently acquired selfish genetic elements:
- Mobile element enrichment (H1 confirmed): 7.45x enrichment for mobile element keywords, with Phage/Transposon/Plasmid category 11.7x overrepresented
- Narrow taxonomic distribution (H2 confirmed): Half the ortholog breadth, 3.4x more orphan genes, high singleton fraction
- Short, poorly annotated genes (H3 confirmed): 20% shorter (r=0.170), 24pp less likely to have SEED annotations
- Specific functional depletion (H4 confirmed): Core metabolism categories systematically depleted
These genes are candidates for ongoing gene loss -- they've been acquired via HGT but impose sufficient cost that they will likely be purged from the genome over evolutionary time unless they provide a selective advantage in specific environments. The fact that 14.1% still have condition-specific phenotypes suggests a subset may persist if those conditions are encountered frequently enough.
The contrast with the 28,017 costly+conserved genes is instructive. Costly+conserved genes are enriched in core metabolism (Protein Metabolism, Respiration, Motility) -- functions that are energetically expensive but maintained by purifying selection because they're essential in natural environments not captured by lab experiments. The lab reveals the cost; the pangenome reveals the selection.
Literature Context
- Morris et al. (2012) proposed the Black Queen Hypothesis: costly genes can be lost when their functions are provided as public goods by community members. Our costly+dispensable genes are candidates for this process, though they are predominantly selfish elements rather than metabolic genes -- they may represent an earlier stage where the gene hasn't yet been lost despite its cost.
- Price et al. (2018) generated the Fitness Browser data used here, showing that mutant fitness data can assign phenotypes to genes of unknown function. Our analysis adds pangenome conservation to identify which of these phenotypic genes are evolutionary stable vs transient.
- Rosconi et al. (2022) demonstrated that gene essentiality is strain-dependent in S. pneumoniae, with the accessory genome modulating which genes are required. Our finding that 14.1% of costly+dispensable genes have condition-specific phenotypes parallels this -- even non-conserved genes can be conditionally important.
- Armitage et al. (2025) documented extreme pseudogenization and gene loss in symbiotic cyanobacteria, showing that genome degradation accompanies relaxed selection. The costly+dispensable genes in our free-living organisms may represent early stages of this degradation process.
Novel Contribution
This is the first systematic characterization of genes that are simultaneously burdensome (fitness improves when deleted) and not conserved in the pangenome. While mobile element burden has been studied in individual organisms, the cross-organism scale (142,190 genes across 43 bacteria) and the pangenome dimension are new. The finding that costly+dispensable genes are almost exclusively mobile element debris -- rather than degrading metabolic pathways -- narrows the biological interpretation and suggests that HGT-mediated genome expansion is the primary source of costly non-conserved genes in bacteria.
Limitations
- "Burden" is defined as max_fit > 1 in any experiment -- a single experiment can classify a gene as burdensome, making this sensitive to noise in the fitness data
- SEED/KEGG annotations cover only 56-79% of genes; the unannotated fraction may have different functional profiles
- The pangenome core/auxiliary classification is binary; a quantitative measure (fraction of genomes carrying the gene) would provide more resolution
- The 90% identity DIAMOND threshold for FB-pangenome linking may miss recently acquired genes with low sequence similarity
- psRCH2's extreme outlier status (21.5% costly+dispensable) may reflect strain-specific genomic features rather than a general pattern
- Ortholog group assignment uses BBH across 48 organisms; genes with orthologs outside this set would be misclassified as orphans
- Condition-specific phenotype data is biased toward lab-testable conditions
Future Directions
- Characterize psRCH2 outlier: Investigate why Pseudomonas stutzeri RCH2 has 21.5% costly+dispensable genes -- is this due to a recent phage invasion, IS element expansion, or genomic island acquisition?
- Genomic context analysis: Determine whether costly+dispensable genes cluster in genomic islands, near tRNA genes, or at scaffold edges -- hallmarks of HGT
- Temporal dynamics: For organisms with multiple sequenced strains, track whether costly+dispensable genes are being lost over evolutionary time (present in some strains but absent in close relatives)
- Community context: Using ENIGMA CORAL community composition data, test whether organisms with more costly+dispensable genes tend to co-occur with organisms that could provide the lost functions (Black Queen Hypothesis test)
- Quantitative conservation: Replace binary core/accessory with the fraction of species genomes carrying each gene cluster, to distinguish "almost core" from "rare accessory"
Data
Sources
| BERDL Collection | Tables Used | Purpose |
|---|---|---|
kescience_fitnessbrowser |
genefitness, gene, exps |
Per-gene fitness values, gene metadata, experiment descriptions |
kbase_ke_pangenome |
gene_cluster, gene_genecluster_junction, eggnog_mapper_annotations |
Pangenome gene clusters, gene-to-cluster mappings, functional annotations |
Generated Data
| File | Rows | Description |
|---|---|---|
data/gene_quadrants.tsv |
142,190 | Genes with fitness stats, conservation status, and quadrant assignment |
References
- Morris JJ et al. (2012). "The Black Queen Hypothesis: evolution of dependencies through adaptive gene loss." mBio 3:e00036-12. PMID: 22448042
- Price MN et al. (2018). "Mutant phenotypes for thousands of bacterial genes of unknown function." Nature 557:503-509. PMID: 29769716
- Rosconi F et al. (2022). "A bacterial pan-genome makes gene essentiality strain-dependent and evolvable." Nat Microbiol 7:1580-1592. PMID: 36097170
- Armitage DW et al. (2025). "Adaptive pangenomic remodeling in the Azolla cyanobiont." ISME J. PMID: 40728316
Data Collections
Derived Data
This project builds on processed data from other projects.
Review
Summary
This is one of the strongest projects in the observatory. It asks a crisp, well-motivated question — what characterizes genes that are simultaneously burdensome and not conserved? — and answers it convincingly with convergent evidence from functional annotation enrichment, ortholog breadth, gene length, and singleton analysis. The three-notebook pipeline is logically structured, fully reproducible from cached data without Spark, and all notebooks include saved outputs (text tables and figures). The REPORT.md is exemplary: thorough findings, explicit hypothesis testing (H1–H4 all addressed), an unusually detailed limitations section, well-chosen literature context, and concrete future directions. The central finding — that costly+dispensable genes are overwhelmingly mobile genetic element debris rather than degrading metabolic pathways — is a clean, interpretable result. Areas for improvement are minor: the annotation rate numbers in REPORT.md don't exactly match the notebook outputs, the singleton enrichment is partly structural, and a few additional analyses could further strengthen the interpretation.
Methodology
Research question and hypotheses: Clearly stated and testable. The four hypotheses (H1–H4) are specific, each addressed by dedicated analyses, and the null hypothesis (H0) is explicitly defined. The RESEARCH_PLAN.md is among the best-structured in the observatory.
Data sources: Thoroughly documented in both README.md and RESEARCH_PLAN.md with source project, expected row counts, and key columns for each upstream dataset. The query strategy clearly states no Spark is needed.
Approach: The 2×2 selection signature matrix (costly/neutral × conserved/dispensable) is a natural and effective framework. Fisher exact tests with BH-FDR correction are appropriate for categorical enrichment. Mann-Whitney U tests are appropriate for the non-normal continuous comparisons (ortholog breadth, gene length). Effect sizes (rank-biserial correlation) are reported for both Mann-Whitney tests — a commendable practice given the large sample sizes.
Reproducibility: Excellent. The README includes a complete ## Reproduction section with exact nbconvert commands, notes that all data is pre-cached (no Spark needed), and provides a requirements.txt. All three notebooks have saved outputs (text tables and inline figures), so results are fully visible without re-execution. The pipeline is linear (NB01 → NB02/NB03) with a single intermediate data file (gene_quadrants.tsv).
Known pitfalls addressed: The RESEARCH_PLAN.md documents four relevant pitfalls from docs/pitfalls.md (string booleans in is_core/is_auxiliary, essential gene exclusion, fillna(False) dtype, mixed gene column types). NB01 cell-3 implements all four correctly: .map({'True': True, 'False': False}).astype(bool) for boolean conversion and dtype={'gene': str} for the gene column. The fillna(False).astype(bool) pattern is used as the fallback path.
Code Quality
NB01 (Define Quadrants): Clean and correct. The quadrant counts exactly match expectations (28,017 / 5,526 / 86,761 / 21,886 / total 142,190). The assign_quadrant function uses row-wise .apply(), which docs/pitfalls.md flags as slow for large DataFrames, but at 142K rows this is not a practical issue. The gene metadata merge is a left join that preserves the correct row count. Output file saved as TSV with all columns documented.
NB02 (Functional Characterization): Well-constructed. The SEED annotation merge correctly deduplicates before joining (drop_duplicates(subset=['orgId', 'locusId'], keep='first')) and asserts no row inflation (assert len(genes_seed) == len(genes)). The enrichment analysis in cell-9 computes Fisher exact tests for all 29 SEED top-level categories with BH-FDR correction — the methodology is sound. The mobile element keyword analysis (cell-12) uses an appropriate set of keywords and correctly operates on the original genes DataFrame. One minor note: the keyword list includes IS\\d as a regex pattern, which is good for catching IS element names like "IS3", "IS200", etc.
NB03 (Evolutionary Context): Clean and correct. The ortholog breadth analysis properly distinguishes between genes with and without OG assignments (orphans). The singleton analysis includes a thoughtful note that the CD-vs-CC comparison is structurally determined (core genes cannot be singletons by definition) and provides the more informative within-dispensable comparison (costly vs neutral dispensable: OR=1.09, p=0.02). Both Mann-Whitney tests report rank-biserial correlation as an effect size measure. The specific phenotype analysis adds a valuable dimension.
Statistical methods: Appropriate throughout. Fisher exact tests with BH-FDR for categorical enrichment, Mann-Whitney U for non-parametric continuous comparisons, rank-biserial correlation for effect sizes. The singleton structural confound is correctly identified and handled.
Findings Assessment
Conclusions supported by data: All four hypotheses are supported by convergent evidence. The 7.45x mobile element keyword enrichment (OR=7.45, p=4.6e-71) and the SEED category enrichments (Phage/Transposon 11.7x, Virulence 26.7x) are strong and consistent. The ortholog breadth difference (median 15 vs 31, r=0.233) and orphan gene fraction (44.5% vs 13.1%) consistently support the "recent acquisition" interpretation. The gene length difference (median 615 vs 765 bp, r=0.170) is consistent with IS elements and gene fragments.
Minor numeric discrepancies in REPORT.md: The REPORT.md states "55% vs 79%" for SEED annotation rates (rounding of 50.8% and 74.9% from NB02) and "OR=7.4" for the Phage/Transposon SEED category (the notebook shows OR=11.7 for "Phages, Prophages, Transposable elements, Plasmids" and 26.7 for "Virulence"). The REPORT.md text stating "7.4x enriched (FDR=1.5e-15)" for the Phage category doesn't match the notebook's OR=11.7 / FDR=1.26e-17. These appear to be from an earlier notebook run or a transcription error. The direction and conclusion are unaffected, but the exact numbers should be reconciled.
Limitations acknowledged: The REPORT.md has an unusually thorough limitations section covering seven specific concerns: noise sensitivity of max_fit > 1, annotation coverage gaps, binary core/auxiliary classification, DIAMOND threshold effects, the psRCH2 outlier, ortholog scope, and condition-specific phenotype bias. This is exemplary.
Visualizations: Six figures are generated and saved, covering all major analysis dimensions. They are clear, properly labeled, and use a consistent color scheme across notebooks. The SEED enrichment forest plot effectively communicates both direction and magnitude.
Literature context: Four references cited with full bibliographic details, PMIDs, and DOIs. The references.md documents search queries used to find them. The connections to the Black Queen Hypothesis, selfish genetic elements, and strain-dependent essentiality are well-drawn.
Suggestions
-
Reconcile REPORT.md numbers with notebook outputs (moderate impact): Several statistics in REPORT.md don't exactly match the notebook outputs. SEED annotation rates are reported as "55% vs 79%" but notebooks show 50.8% vs 74.9%. The Phage/Transposon SEED enrichment is reported as "OR=7.4, FDR=1.5e-15" but the notebook shows OR=11.7, FDR=1.26e-17. Either the REPORT was written from an earlier run or the numbers were rounded inconsistently. A pass through the REPORT.md to verify all quoted statistics against the current notebook outputs would ensure accuracy.
-
Clarify the "Virulence" SEED category enrichment (minor impact): The REPORT.md highlights the Virulence category as 29.9x enriched — but the notebook shows this is based on only 21 vs 4 genes (cell-9). While the Fisher exact test is valid for small counts, such a high odds ratio from few observations is fragile. Adding a note about the small sample size would help readers calibrate the strength of this specific finding versus the more robust Phage/Transposon enrichment (39 vs 17 genes).
-
Consider comparing costly+dispensable to neutral+dispensable, not just costly+conserved (minor impact): The primary comparison throughout is costly+dispensable vs costly+conserved. While this isolates the effect of conservation status within costly genes, comparing costly+dispensable to neutral+dispensable would isolate the effect of burden within dispensable genes. NB03 does this for singletons (OR=1.09, p=0.02) — extending this to functional enrichment and ortholog breadth would help distinguish features of "dispensable genes in general" from features specific to "costly dispensable genes."
-
Document the Miya organism outlier (minor impact): Miya (67 genes total, 19.4% costly+dispensable) has the second-highest percentage after psRCH2, but with a very small gene count that suggests it may be an incomplete dataset or a small genome. A brief note would help readers assess whether this is a meaningful biological signal or a sample size artifact.
-
Add a summary figure combining key dimensions (nice-to-have): A single multi-panel figure or radar chart comparing the four quadrants across all dimensions (annotation rate, mobile element %, orphan fraction, median OG breadth, median gene length, % with specific phenotypes) would provide a useful visual abstract. This could serve as Figure 1 in a potential publication.
-
Consider genomic clustering analysis (nice-to-have, noted in future directions): As the REPORT.md already suggests, testing whether costly+dispensable genes cluster near scaffold edges, tRNA genes, or in consecutive runs would strengthen the mobile element / genomic island interpretation. If scaffold position data is available in the upstream datasets, this could be a high-value addition.
This review was generated by an AI system. It should be treated as advisory input, not a definitive assessment.
Visualizations
Fig Annotation Rate
Fig Gene Length
Fig Organism Distribution
Fig Ortholog Breadth
Fig Per Organism
Fig Seed Enrichment