Fitness Modules x Pangenome Conservation
CompletedResearch Question
Are ICA fitness modules enriched in core pangenome genes, and do cross-organism module families map to the core genome?
Research Plan
Hypothesis
The fitness_modules project identified 1,116 co-regulated gene modules across 32 bacteria via ICA decomposition of RB-TnSeq data, then aligned them into 156 cross-organism module families. The conservation_vs_fitness project linked FB genes to pangenome clusters with conservation status. We hypothesize that functionally coherent gene groups (modules) preferentially reside in the conserved core genome, and that module families spanning more organisms will have higher core fractions.
Approach
- Merge module membership data with pangenome conservation status across 29 overlapping organisms
- Compute per-module conservation composition (% core / auxiliary / singleton)
- Classify modules as core (>90% core genes), mixed (50-90%), or accessory (<50%)
- Test whether module families spanning more organisms have higher core fractions
- Check whether essential genes appear in modules (they shouldn't -- ICA requires fitness data)
Revision History
- v1 (2026-02): Migrated from README.md
Overview
This project connects ICA fitness modules (1,116 co-regulated gene modules across 32 bacteria) with pangenome conservation status to ask whether functionally coherent gene groups preferentially reside in the conserved core genome. It finds that module genes are enriched in core (+4.5pp over baseline), most modules are predominantly core, but module family breadth across organisms does not predict conservation -- a surprising null result explained by the high baseline core rate.
Key Findings
Module Genes Are More Core Than Average
- Module genes: 86.0% core vs all genes: 81.5% (+4.5 percentage points)
- Genes assigned to ICA modules are co-regulated functional units, and they skew toward the conserved core genome
(Notebook: 01_module_conservation.ipynb)
Most Modules Are Core
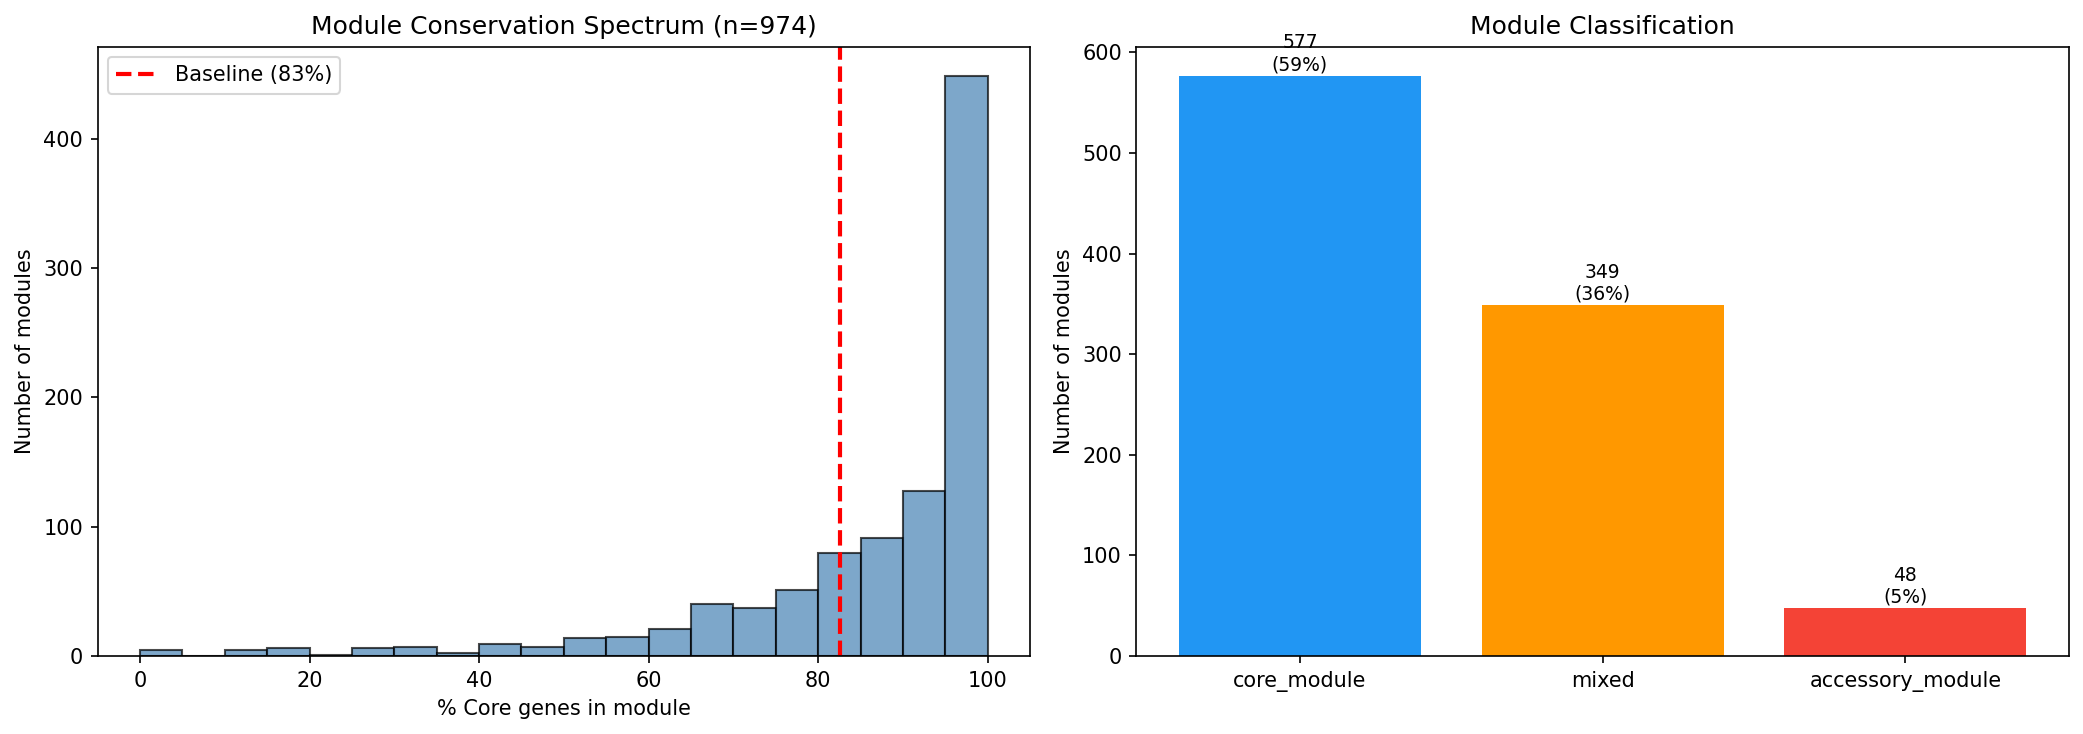
Of 974 modules with >=3 mapped genes:
- 577 (59%) are core modules (>90% core genes)
- 349 (36%) are mixed modules (50-90% core)
- 48 (5%) are accessory modules (<50% core)
The median module is 93.4% core. Most co-regulated fitness response units are embedded in the conserved genome.
(Notebook: 01_module_conservation.ipynb)
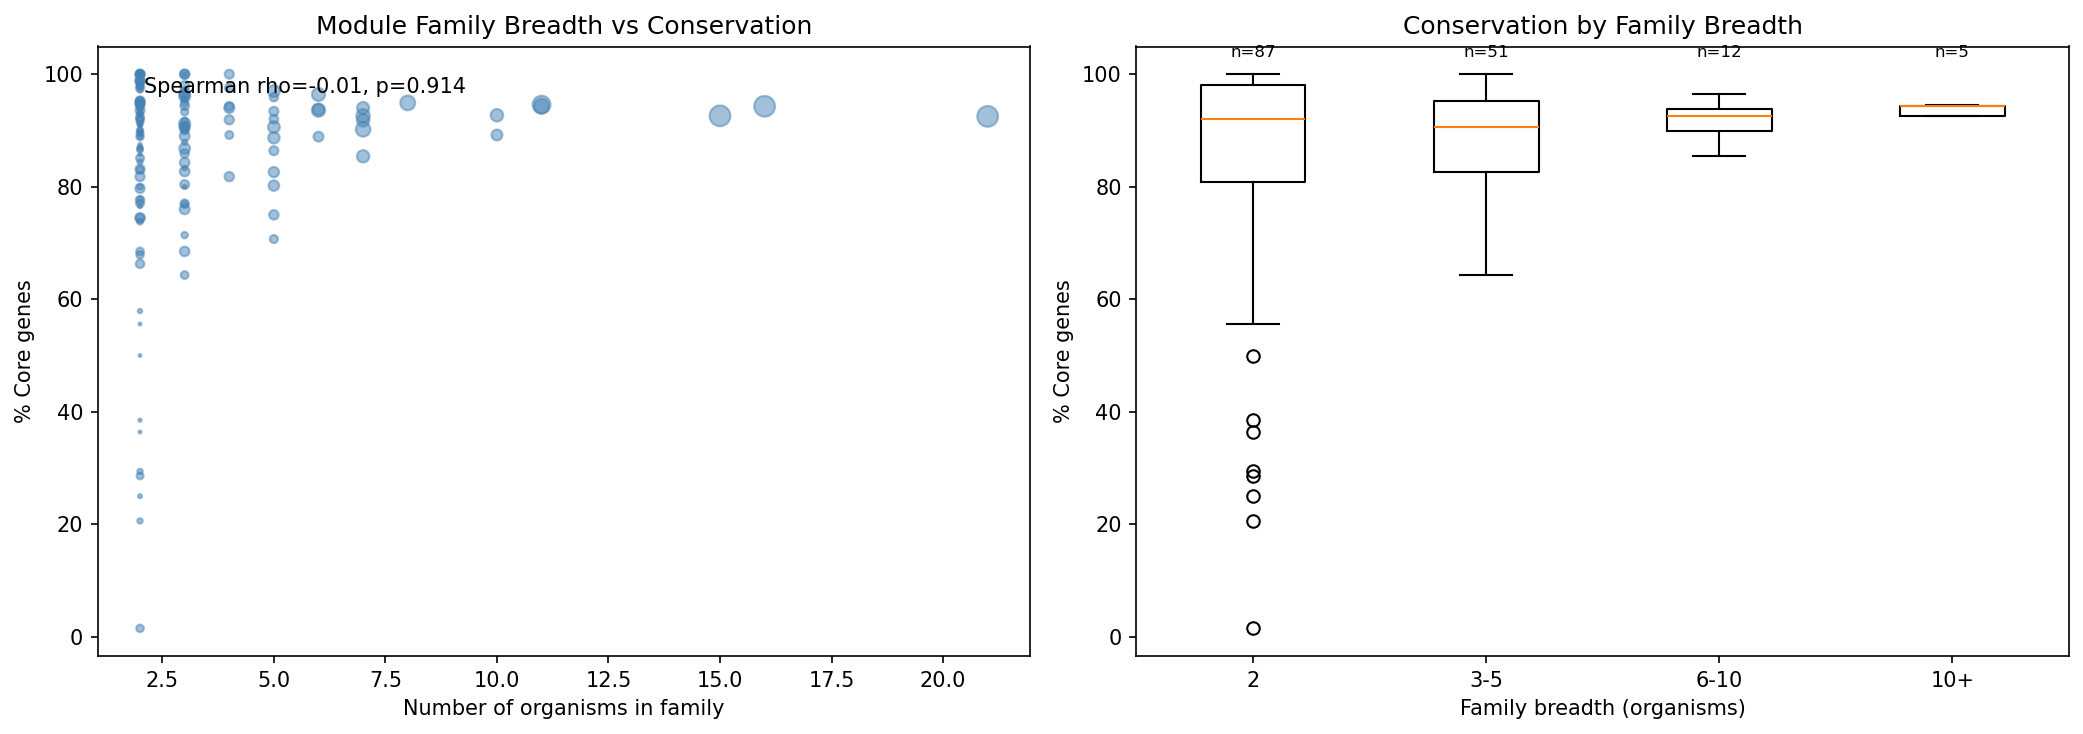
Family Breadth Does NOT Predict Conservation
Surprisingly, module families spanning more organisms do NOT have higher core fractions (Spearman rho=-0.01, p=0.914). Families are nearly all core regardless of how many organisms they span. The core genome baseline is so high (~82%) that there's little room for a gradient.
(Notebook: 02_family_conservation.ipynb)
Accessory Module Families Exist
38 families have <50% core genes -- these are co-regulated accessory gene modules conserved across organisms. They may represent horizontally transferred functional units or niche-specific operons.
Essential Genes Are Absent from Modules
0 essential genes appear in any module, confirming that ICA modules only capture genes with measurable fitness variation (non-essential genes with transposon insertions). Essential genes are invisible to ICA because they have no fitness data.
Interpretation
ICA fitness modules are enriched in core genes (86% vs 81.5% baseline, OR=1.46, p=1.6e-87), confirming that co-regulated functional units preferentially reside in the conserved genome. However, the enrichment is modest due to a ceiling effect -- the baseline core rate is already very high. The surprising null result for family breadth vs conservation (rho=-0.01) suggests that conservation is a property of individual genes, not of the cross-organism scope of their regulatory module.
Literature Context
- Price et al. (2018) generated the Fitness Browser data and developed the ICA decomposition approach used to identify co-regulated fitness modules. Our analysis shows these modules preferentially reside in the conserved core genome.
- Saelens et al. (2018) demonstrated that ICA outperforms other decomposition methods for microbial gene expression data, supporting the biological relevance of the modules analyzed here.
- Vernikos et al. (2015) reviewed core and accessory genome definitions in bacterial pangenomics. Our finding that 59% of fitness modules are >90% core extends the concept of "core" from individual genes to functionally coherent regulatory units.
Limitations
- Ceiling effect: The baseline core rate is already ~81.5%, limiting the maximum observable enrichment. The +4.5pp difference to 86% is statistically significant but represents a modest absolute effect.
- 29/32 organism subset: 3 module organisms (Cola, Kang, SB2B) lack pangenome links because their species had too few genomes in GTDB for pangenome construction.
- Module membership threshold: The upstream ICA module membership uses |Pearson r| >= 0.3 with max 50 genes per module. This threshold affects which genes are "in" a module and could influence conservation composition.
- Classification thresholds are arbitrary: The 90% and 50% cutoffs for core/mixed/accessory module classification are convenient but not biologically motivated.
- Essential genes excluded: ICA requires fitness data, so essential genes (no transposon insertions) are absent from all modules. This means modules only capture the non-essential portion of the genome.
Data
Sources
| Dataset | Description | Source |
|---|---|---|
| ICA fitness modules | 1,116 co-regulated modules across 32 organisms | fitness_modules/data/modules/ |
| Module families | Cross-organism module families | fitness_modules/data/module_families/ |
| KBase pangenome link table | Gene-to-cluster conservation mapping | conservation_vs_fitness/data/fb_pangenome_link.tsv |
| Essential genes | Essentiality classification | conservation_vs_fitness/data/essential_genes.tsv |
Generated Data
| File | Description |
|---|---|
data/module_conservation.tsv |
Per-module conservation composition |
data/family_conservation.tsv |
Per-family conservation summary |
References
- Price MN et al. (2018). "Mutant phenotypes for thousands of bacterial genes of unknown function." Nature 557:503-509. PMID: 29769716
- Parks DH et al. (2022). "GTDB: an ongoing census of bacterial and archaeal diversity through a phylogenetically consistent, rank normalized and complete genome-based taxonomy." Nucleic Acids Res 50:D199-D207. PMID: 34520557
- Saelens W et al. (2018). "A comprehensive evaluation of module detection methods for gene expression data." Nat Commun 9:1090. PMID: 29545622
- Vernikos G et al. (2015). "Ten years of pan-genome analyses." Curr Opin Microbiol 23:148-154. PMID: 25483351
Discoveries
Fitness modules are enriched in core genome genes
February 2026ICA fitness modules (co-regulated gene groups) are 86.0% core vs 81.5% baseline across 29 organisms (Fisher OR=1.46, p=1.6e-87; per-organism paired Wilcoxon p=1.0e-03, 22/29 organisms show enrichment). 59% of modules are >90% core genes. Co-regulated fitness response units are preferentially embedde
Read more →Module family breadth does NOT predict conservation
February 2026Surprisingly, module families spanning more organisms do not have higher core fractions (Spearman rho=-0.01, p=0.914). The baseline core rate (~82%) is so high that there is no room for a gradient — families are nearly all core regardless of breadth. This is a ceiling effect, not evidence against th
Read more →Essential genes are absent from ICA modules
February 20260 essential genes appear in any of the 1,116 fitness modules across 32 organisms. ICA decomposes fitness variation, so genes with no fitness data (essential = no transposon insertions) are invisible to it. This means fitness modules capture only the non-essential portion of the genome's functional a
Read more →Derived Data
This project builds on processed data from other projects.
Used By
Data from this project is used by other projects.
Review
Summary
This is a well-executed synthesis project that connects ICA fitness modules (from fitness_modules) with pangenome conservation status (from conservation_vs_fitness) to ask whether co-regulated gene groups preferentially reside in the core genome. The analysis is clean, the notebooks are well-structured with saved outputs, and the findings are clearly reported. The key result — that module genes are 86% core vs 81.5% baseline, and that family breadth does not predict conservation — is interesting and honestly presented, including the null result. The main areas for improvement are the lack of statistical testing for the core enrichment claim, resolving PFam/TIGRFam IDs to human-readable names in the annotation analysis, and handling the large number of NaN values in the family conservation table.
Methodology
Research question: Clearly stated and testable — "Are ICA fitness modules enriched in core or accessory pangenome genes, and do cross-organism module families map to the core genome?" The question is a natural follow-up from the two upstream projects.
Approach: Sound and straightforward. The analysis merges module membership with conservation status, computes per-module composition, classifies modules by core fraction, and tests the breadth-conservation hypothesis. The essential gene check (Step 4 of NB02) is a thoughtful validation — confirming that ICA modules cannot contain essential genes since they lack fitness data.
Data sources: Well-identified. The README clearly lists the upstream data dependencies (fitness_modules/data/modules/, conservation_vs_fitness/data/). The 29-organism overlap (from 32 module organisms and 43 linked organisms) is explicitly documented.
Reproducibility concerns:
- The analysis runs entirely locally (no Spark needed), which is a significant advantage.
- The README includes a clear Reproduction section with exact commands.
- However, there is no requirements.txt file. The notebooks import pandas, numpy, matplotlib, and scipy, which should be documented.
- Notebook outputs are saved for both text and figures — this is good. Readers can review results without re-running.
Code Quality
NB01 (Module Conservation Profiles):
- Clean, logical flow: load data → build gene-level dataset → compute per-module conservation → classify modules → analyze function vs conservation.
- The merge between module membership and conservation link table is done correctly, with proper string casting of locusId on both sides.
- Conservation classification logic is correct: core when is_core == True, singleton when is_singleton == True, auxiliary otherwise. This aligns with the mutually exclusive flags documented in docs/pitfalls.md.
- The n_mapped >= 3 filter for module classification is a reasonable minimum.
- Minor issue: The has_mapped DataFrame is reassigned with .copy() after being created from a filter — this correctly avoids the SettingWithCopyWarning, showing good pandas practice.
NB02 (Family Conservation):
- The merge between families and module conservation uses inner join, which silently drops families without conservation data. Since 688 of 749 families are retained, ~61 families are lost. This is not discussed.
- The family_conservation.tsv output has a column naming issue: n_modules_x and n_modules_y from the merge with family_annot. This indicates a column name collision that should be resolved with explicit suffixes or renaming.
- In the accessory families output, most families show NaN for n_organisms, consensus_term, and consensus_db. This means 532 of 688 families (those not in the 156 annotated families from family_annot) lack organism counts and annotations. The analysis proceeds with these NaN values in the scatter plot by using dropna(subset=['n_organisms', 'overall_pct_core']), which effectively restricts the breadth-conservation test to only the 156 annotated families. This is reasonable but should be explicitly stated.
Annotation analysis (NB01 Step 4):
- The top annotations in core and accessory modules are reported as raw PFam/TIGRFam/KEGG IDs (e.g., "PF02653", "TIGR01726", "K03657") without human-readable descriptions. This makes the functional comparison between core and accessory modules difficult to interpret. The upstream fitness_modules project resolved these IDs to descriptions — this project should do the same or reference them.
Pitfall awareness:
- The Dyella79 exclusion (line in NB01 setup: link = link[link['orgId'] != 'Dyella79']) correctly follows the documented pitfall about locus tag mismatch.
- The is_core/is_auxiliary/is_singleton flags are used correctly as mutually exclusive categories, consistent with docs/pitfalls.md.
- No Spark queries are involved, so REST API and string-typed column pitfalls are not applicable.
Findings Assessment
Module genes are more core than average (+4.5 pp): This is the central finding, but it lacks a statistical test. The 86.0% vs 81.5% difference is reported as a simple comparison of proportions, with no chi-squared test, Fisher's exact test, or permutation test to assess significance. Given that there are 27,670 unique module genes and ~178K total genes, even small differences could be statistically significant — but the reader cannot tell from the current analysis. A simple chi-squared test on the 2×2 table (module/non-module × core/non-core) would resolve this.
Module classification (59% core, 36% mixed, 5% accessory): Well-presented with both a histogram and bar chart. The thresholds (90% for core, 50% for accessory) are clearly defined. The visualization is effective — the histogram shows the strong right-skew and the baseline comparison line contextualizes the distribution.
Family breadth does NOT predict conservation (rho=-0.01, p=0.914): This null result is honestly reported and well-interpreted. The explanation — that the core genome baseline is so high that there's little room for a gradient — is insightful. The scatter plot and box plot effectively communicate this. The box plot shows that even 2-organism families are ~90% core, leaving no room for wider families to increase.
Accessory module families: The 38 families with <50% core genes are identified, but most lack annotations (NaN consensus_term). The interpretation that these "may represent horizontally transferred functional units or niche-specific operons" is reasonable but speculative — the data don't directly support this claim.
Essential genes absent from modules: This is a clean validation (0 essential genes in any module). The explanation is correct — ICA requires fitness variation data, which essential genes lack.
Limitations: The README does not have a dedicated Limitations section. The ceiling effect on conservation (most genes are core, limiting the possible enrichment signal) is mentioned in the breadth-conservation context but not as a general limitation. Other potential limitations — such as the 29/32 organism subset, the dependence on upstream link table quality, or the arbitrary 90%/50% thresholds for module classification — are not discussed.
Suggestions
-
Add a statistical test for the core enrichment claim (Critical). The central finding (86.0% vs 81.5% core) has no p-value. A chi-squared test or Fisher's exact test on module vs non-module genes × core vs non-core would take 2-3 lines of code and substantially strengthen the main result.
-
Resolve annotation IDs to human-readable descriptions (High). In NB01 Step 4, PFam/TIGRFam IDs like "PF02653" are opaque. Map these to domain names (e.g., "PF02653: ABC transporter permease") so readers can interpret the functional differences between core and accessory modules.
-
Fix the column naming collision in
family_conservation.tsv(Medium). Then_modules_x/n_modules_ycolumns result from a merge collision. Rename to something meaningful (e.g.,n_modules_obsvsn_modules_family). -
Add a
requirements.txt(Medium). The project imports pandas, numpy, matplotlib, and scipy. A simple requirements file would complete the reproduction documentation. -
Add a Limitations section to the README (Medium). Discuss: (a) the ceiling effect — 81.5% baseline core rate limits the maximum observable enrichment; (b) the 29/32 organism subset; (c) the arbitrary classification thresholds; (d) the module membership threshold from upstream could affect conservation composition.
-
Document the 61 families dropped by the inner join in NB02 (Low). The merge from 749 to 688 families loses ~8% of families. A brief note explaining that these families had no modules in the 29 overlapping organisms would be helpful.
-
Consider a per-organism analysis (Nice-to-have). The aggregate 86% vs 81.5% comparison pools all organisms. A per-organism paired comparison (module core fraction vs baseline core fraction, across 29 organisms) would control for organism-level variation and provide a more robust test (e.g., paired Wilcoxon signed-rank test).
This review was generated by an AI system. It should be treated as advisory input, not a definitive assessment.
Visualizations
Family Breadth Vs Conservation
Module Core Distribution