Ecotype Reanalysis: Environmental-Only Samples
CompletedResearch Question
Does the environment effect on gene content become stronger when analysis is restricted to genuinely environmental samples, excluding human-associated genomes whose AlphaEarth embeddings reflect hospital satellite imagery rather than ecological habitat?
Research Plan
Hypothesis
- H0: Environment partial correlations are the same for environmental and human-associated species
- H1: Environmental species show stronger environment–gene content correlations because their AlphaEarth embeddings carry more meaningful geographic signal
Revision History
- v1 (2026-02-16): Initial plan
Overview
The original ecotype analysis tested whether environmental similarity (from AlphaEarth embeddings) predicts gene content similarity after controlling for phylogeny. It found weak effects for most species. However, we subsequently discovered that 38% of the genomes used had human-associated isolation sources (clinical, gut), and their AlphaEarth embeddings carry much weaker geographic signal because hospitals worldwide look similar from satellite imagery.
This project re-examines the ecotype question by classifying species according to their dominant isolation environment and comparing the environment–gene content correlation between environmental and human-associated species.
Key Findings
1. Clinical bias does NOT explain the weak environment signal (H0 not rejected)
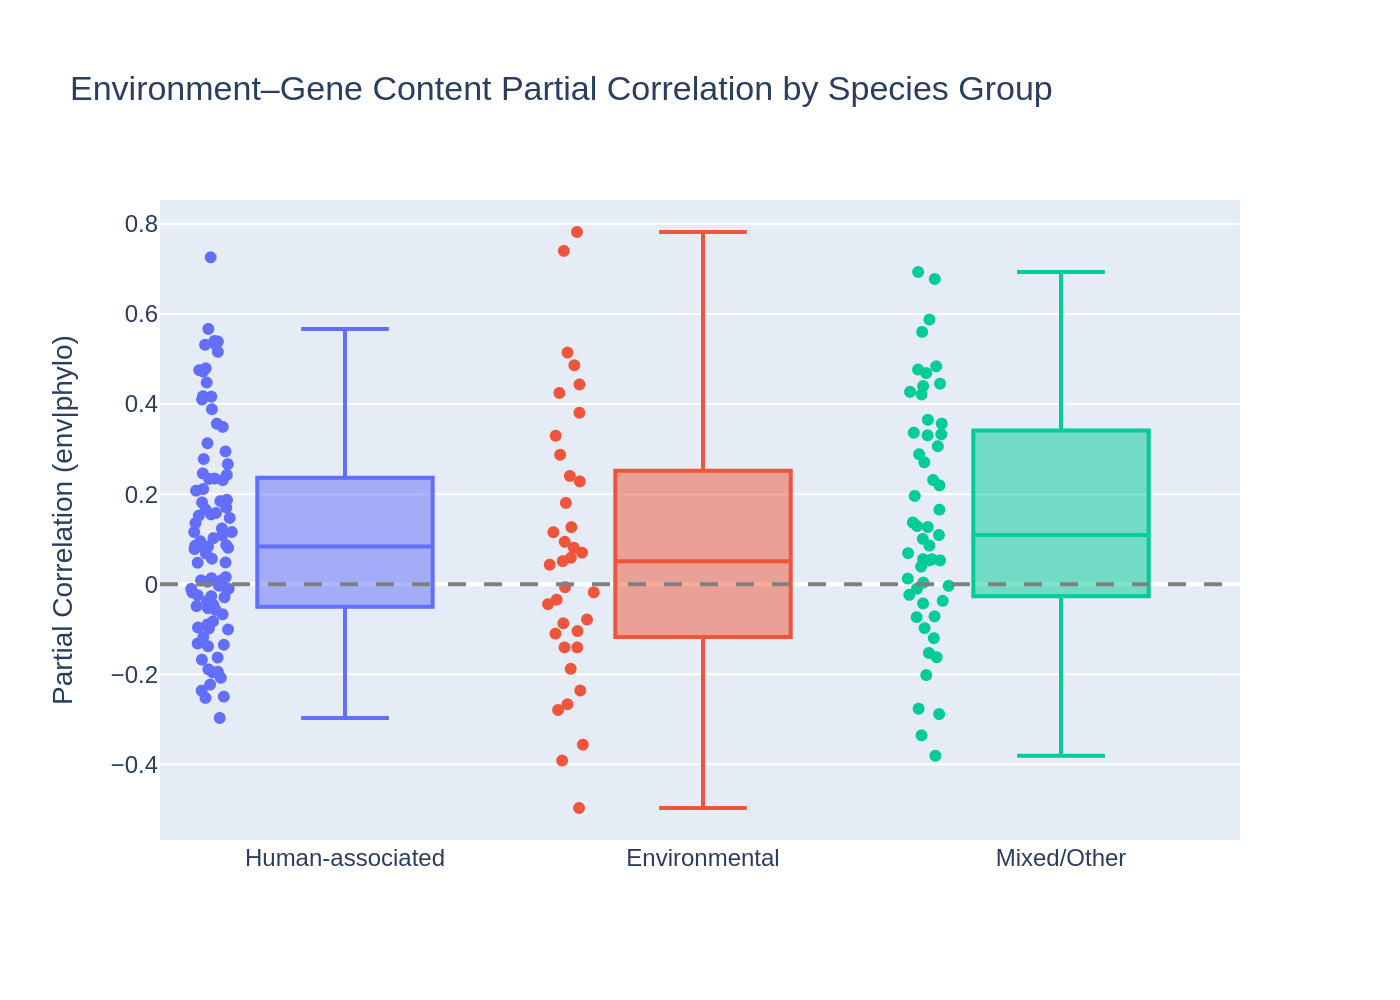
Environmental species (n=37, median partial correlation 0.051) do NOT show stronger environment–gene content correlations than human-associated species (n=93, median 0.084). The Mann-Whitney U test is far from significant (U=1536, p=0.83, one-sided). The result is the opposite direction from the hypothesis: human-associated species actually show slightly higher partial correlations.
| Group | N species | Median partial corr | Mean | Std | Range |
|---|---|---|---|---|---|
| Environmental | 37 | 0.051 | 0.073 | 0.299 | [-0.50, 0.78] |
| Human-associated | 93 | 0.084 | 0.110 | 0.226 | [-0.30, 0.73] |
| Mixed/Other | 53 | 0.109 | 0.148 | 0.261 | [-0.38, 0.69] |

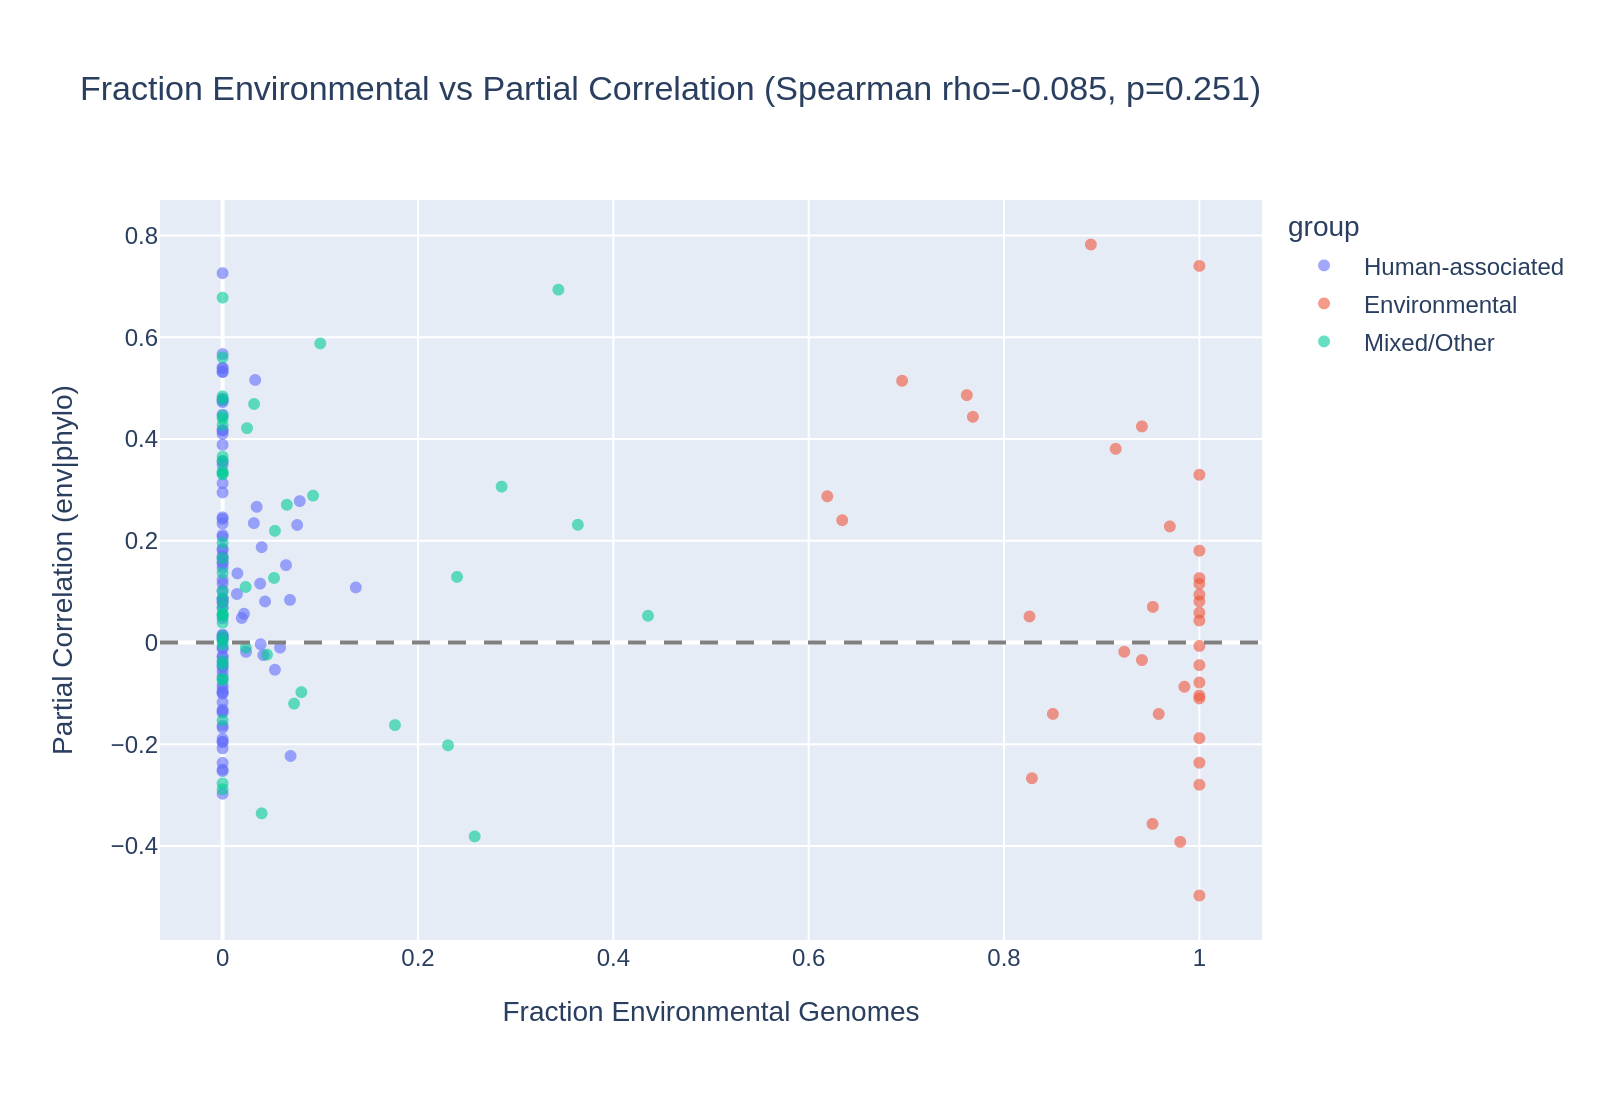
The continuous Spearman analysis confirms this: fraction of environmental genomes per species does not predict partial correlation strength (rho=-0.085, p=0.25).
(Notebook: 01_environmental_only_reanalysis.ipynb)
2. 47% of ecotype species are human-associated, only 21% environmental
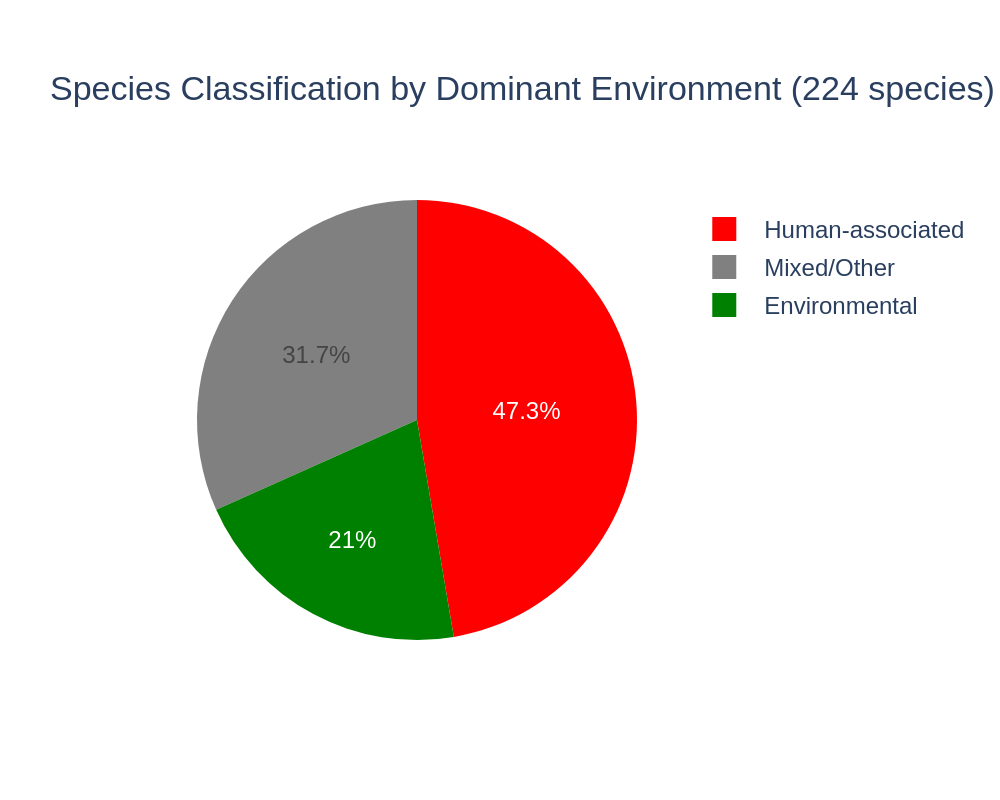
Of 224 species selected for the ecotype analysis (>=20 genomes with AlphaEarth embeddings, >=30% coverage), 106 (47%) are majority human-associated by genome-level isolation_source classification, 47 (21%) are majority environmental (Soil, Marine, Freshwater, Extreme, Plant), and 71 (32%) are mixed/other. This confirms the strong clinical sampling bias in the AlphaEarth subset identified by the env_embedding_explorer project but shows it doesn't account for the weak environment signal.
(Notebook: 01_environmental_only_reanalysis.ipynb)
3. NaN species are disproportionately environmental, not human-associated
Of the 30 species with NaN partial correlations, the NaN rate is highest for Environmental (10/47 = 21%) and Mixed/Other (13/66 = 20%), and lowest for Human-associated (7/100 = 7%). This means the environmental group loses more species to NaN, which could slightly bias the comparison — but since human-associated species already show higher correlations even with this bias, addressing it would only strengthen the null result.
(Notebook: 01_environmental_only_reanalysis.ipynb)
4. Overall partial correlations are 27x higher than the original analysis
The median partial correlation across all 183 species is 0.081 — compared to 0.003 in the original ecotype analysis. Key methodological differences:
- No downsampling: We used all genomes with embeddings (up to 3,505/species) vs the original's diversity-maximizing downsampling (max 250)
- More genomes = more power: Larger sample sizes detect weaker correlations
- Different genome sets: Without downsampling, the distance distributions change
This 27x difference affects the absolute magnitude but does not invalidate the group comparison, which is the question we are testing — the Environmental vs Human-associated comparison is conducted within the same methodology.
(Notebook: 01_environmental_only_reanalysis.ipynb)
Results
Species classification
Using the harmonized env_category mapping from env_embedding_explorer, each species was classified by the dominant environment of its genomes (majority vote):
| Classification | N species | % |
|---|---|---|
| Human-associated | 106 | 47% |
| Mixed/Other | 71 | 32% |
| Environmental | 47 | 21% |
Statistical tests
| Test | Statistic | p-value | Significant? |
|---|---|---|---|
| Mann-Whitney U (Env > Human) | U=1536 | 0.83 | No |
| Spearman (frac_env vs partial corr) | rho=-0.085 | 0.25 | No |
| Spearman (frac_human vs partial corr) | rho=0.030 | 0.69 | No |
Both the binary classification (Mann-Whitney) and continuous analysis (Spearman) show no relationship between environment type and the strength of the environment–gene content correlation.
Interpretation
Why the hypothesis was wrong
We predicted that environmental species would show stronger environment–gene content correlations because their AlphaEarth embeddings carry more geographic signal (3.4x ratio vs 2.0x for human-associated, from env_embedding_explorer). But the data shows no difference. Several explanations:
-
Embedding similarity ≠ ecological relevance: Environmental embeddings are more geographically differentiated, but the environmental variation they capture (climate, vegetation, land use) may not strongly predict which genes a bacterium has.
-
Clinical pathogens have real geographic structure: Human-associated species like Klebsiella or Enterococcus have global epidemiological patterns — different lineages dominate different regions. The AlphaEarth embeddings may capture these regional patterns, creating environment–gene content associations that are real but epidemiological rather than ecological.
-
Genome sampling matters: Species with more genomes (often clinical) have more statistical power to detect weak correlations. The Mixed/Other group has the highest median (0.109), possibly because it includes diverse sampling campaigns.
Literature Context
The original ecotype_analysis project (Dehal et al., 2026) found phylogeny dominates with p=0.66 for the environment vs host-associated comparison using a coarse manual classification. Our reanalysis with genome-level harmonized classifications confirms this null result (p=0.83) with a more systematic classification scheme.
Novel Contribution
This is the first test of whether genome-level environment classification (rather than species-level manual assignment) changes the ecotype analysis conclusion. It demonstrates that the clinical sampling bias in AlphaEarth, while real and significant for embedding-based analyses, does not confound the ecotype environment–gene content relationship.
This project also serves as a template for how follow-up projects in the observatory should reference and build on prior work.
Limitations
- No downsampling: 27x higher overall partial correlations vs original analysis. The absolute values are not comparable, but the group comparison is valid.
- NaN exclusion: Environmental species have a higher NaN rate (21%) than human-associated (7%), meaning the environmental group is more filtered. This would bias toward finding a stronger signal in the environmental group if anything — the opposite of what we observe.
- K. pneumoniae excluded: This major clinical species exceeded Spark's maxResultSize during gene cluster extraction and has no correlation data.
- Classification by majority vote: A species with 51% gut genomes is classified as "Human-associated." The continuous Spearman analysis addresses this limitation and confirms the null result.
Future Directions
- Investigate the 27x partial correlation discrepancy: Compare downsampled vs full-genome extraction to understand the magnitude difference with the original analysis
- Test specific gene subsets: Environment may act on specific functional categories (transport, secondary metabolism) rather than the whole genome Jaccard distance
- Repeat with ENVO ontology terms: The
env_broad_scalefield provides structured ENVO terms that may classify environments more accurately - Control for genome count: Species with more genomes may have inflated correlations — add genome count as a covariate
Data
Sources
| Collection | Tables Used | Purpose |
|---|---|---|
kbase_ke_pangenome |
genome, alphaearth_embeddings_all_years, genome_ani, gene, gene_genecluster_junction |
Genome metadata, embeddings, ANI distances, gene cluster memberships |
Generated Data
| File | Rows | Description |
|---|---|---|
data/species_env_classification.csv |
224 | Species classified by majority env_category |
data/ecotype_corr_with_env_group.csv |
213 | Partial correlations merged with environment group labels |
Data from parent projects
| Project | File | Used for |
|---|---|---|
ecotype_analysis |
data/ecotype_correlation_results.csv |
Partial correlations for 213 species |
ecotype_analysis |
data/target_genomes_expanded.csv |
25,205 target genomes with species |
env_embedding_explorer |
data/alphaearth_with_env.csv |
Harmonized env_category per genome |
References
- Parks, D.H. et al. (2022). "GTDB: an ongoing census of bacterial and archaeal diversity through a phylogenetically consistent, rank normalized and complete genome-based taxonomy." Nucleic Acids Research, 50(D1), D199–D207. PMID: 34520557
- Dehal, P.S. et al. (2026). "Ecotype Correlation Analysis." BERIL Research Observatory,
projects/ecotype_analysis/ - Dehal, P.S. et al. (2026). "AlphaEarth Embeddings, Geography & Environment Explorer." BERIL Research Observatory,
projects/env_embedding_explorer/
Discoveries
The env_embedding_explorer project showed that human-associated samples dampen AlphaEarth geographic signal (2.0x vs 3.4x for environmental). We hypothesized this bias explained the weak environment effect in the ecotype analysis (median partial correlation 0.003). However, stratifying 213 species
Using isolation_source harmonization (12 categories from 5,774 values), 106/224 species in the ecotype analysis are majority human-associated (gut + clinical). Only 47/224 (21%) are majority environmental (Soil, Marine, Freshwater, Extreme, Plant). This is a more systematic classification than the o
Read more →Data Collections
Derived Data
This project builds on processed data from other projects.
Review
Summary
This is a well-executed, tightly scoped reanalysis project that honestly reports a null result. The research question — whether clinical sampling bias in AlphaEarth explains the weak environment–gene content signal — is clearly motivated by two parent projects. The single notebook is well-organized with saved outputs, appropriate statistical tests (Mann-Whitney U and Spearman), and four informative visualizations. The documentation is strong: README, RESEARCH_PLAN, and REPORT all follow the observatory's three-file convention, with thorough interpretation of why the hypothesis was wrong. The project also contributed two pitfalls back to docs/pitfalls.md. The main issues are minor: (1) species_env_classification.csv is listed in REPORT.md as a generated data file but is not produced by the notebook, creating a reproducibility gap; (2) the 27x discrepancy in median partial correlations versus the original ecotype analysis is documented but not validated; and (3) the environment classification is computed from a downsampled genome subset (~250 per species) while the correlations use the full genome set, which is defensible but undocumented.
Methodology
Research question: Clearly stated, testable, with explicit null and alternative hypotheses in RESEARCH_PLAN.md. The expected outcomes section specifies what each result would mean, which is good scientific practice.
Approach: Sound. The improvement over the original ecotype analysis's manual classification (which left 56% of species as "Unknown") is well-motivated. The majority-vote classification by genome-level isolation_source is reasonable, and the continuous Spearman analysis using frac_env avoids the arbitrary 50% threshold — a valuable robustness check. Using both binary and continuous approaches strengthens the null finding.
Data sources: Clearly documented in README, RESEARCH_PLAN, and the notebook header. The project cleanly reuses data from two parent projects with no new BERDL queries, isolating the analytical question from data extraction. Dependencies on parent project files at relative paths (../../ecotype_analysis/data/, ../../env_embedding_explorer/data/) are documented in the README prerequisites.
Statistical methods: The Mann-Whitney U test with alternative='greater' (one-sided) is appropriate for the directional hypothesis. The Spearman correlation on continuous fraction-environmental is a well-chosen complement. The NaN analysis (cells 10, 21) properly assesses whether differential dropout biases the comparison.
Code Quality
Notebook organization: Excellent logical flow: setup → data loading → species classification → join with correlations → statistical tests → visualizations → NaN analysis → methodological comparison → summary → data export. Markdown cells provide context at each stage.
Code correctness: The classification logic (cell 7), statistical tests (cells 12, 14), and NaN analysis (cells 10, 21) are all correct. The one-sided Mann-Whitney U test is properly specified. The harmonize() function re-implements keyword-based categorization rather than importing the pre-computed env_category column — this is a reasonable choice for self-containment, though a brief note explaining why would help readers verify consistency with the parent project.
Pitfall awareness: The project follows relevant pitfalls:
- Pins kaleido==0.2.1 per the headless pod pitfall
- Documents the Spark maxResultSize issue for K. pneumoniae (contributed as a new pitfall)
- Documents broken symlinks to Mac paths (contributed as a new pitfall)
- Follows the three-file structure (README/RESEARCH_PLAN/REPORT)
Subtle data scope issue: The frac_env and frac_human values in the merged CSV are computed from target_genomes_expanded.csv, which caps at ~250 genomes per species (the downsampled set). Meanwhile, n_genomes reports the full genome count with embeddings (up to 3,505). So the classification uses a subset while the correlations use the full set. This is defensible — the 250-genome sample should be representative — but the discrepancy is not documented in the notebook or report. For example, A. baumannii has n_genomes=3505 but n_total=250 in the output CSV.
Minor code style: In cell 7, species_env['n_env'] = species_env[env_cols].sum(axis=1) if env_cols else 0 relies on list truthiness. While correct, if len(env_cols) > 0 would be more explicit.
Findings Assessment
Conclusions supported by data: Yes. The null result (U=1536, p=0.83; Spearman rho=-0.085, p=0.25) is clearly supported by the notebook outputs. The report correctly highlights that the effect is in the opposite direction from the hypothesis — human-associated species have slightly higher median partial correlations (0.084 vs 0.051).
Numerical consistency: The values in REPORT.md (Table at line 11–15) match the notebook outputs after rounding: Environmental median 0.051 (notebook: 0.0511), range [-0.50, 0.78] (notebook: [-0.4971, 0.7822]), etc. No factual discrepancies found.
Interpretation quality: The REPORT.md provides three plausible explanations for the null result: (1) embedding similarity ≠ ecological relevance, (2) clinical pathogens have real geographic structure, (3) genome sampling matters. These are thoughtful and well-reasoned.
27x discrepancy: The median partial correlation (0.081) is 27x higher than the original ecotype analysis (0.003). Cell 23 documents the methodological differences (no downsampling, more genomes, different genome sets) and correctly argues this doesn't invalidate the group comparison. However, the discrepancy is only documented, not validated. Running the Mann-Whitney U test on the original 172-species downsampled partial correlations (which should be available from the parent project) with the new genome-level classifications would confirm robustness. This is listed as Future Direction #1 but would strengthen the current analysis.
Limitations: Thoroughly acknowledged — NaN exclusion bias, K. pneumoniae exclusion, majority-vote threshold, no downsampling. The NaN analysis (Environmental: 21% NaN vs Human-associated: 7%) correctly notes this would bias toward finding a stronger environmental signal, strengthening the null conclusion.
Visualizations: Four figures are clear, properly labeled, and well-chosen for the analysis. The box plot (with individual data points overlaid) is particularly effective at showing the overlapping distributions. Interactive HTML versions are a nice addition.
Suggestions
-
Moderate — Save
species_env_classification.csvfrom the notebook: Add aspecies_env[['n_env', 'n_human', 'n_total', 'group']].to_csv(...)call after cell 7. Currently this file exists but is not reproducible from the notebook, yet REPORT.md lists it as a generated output. -
Moderate — Validate the null result against the original downsampled correlations: The original ecotype analysis's 172-species partial correlations (median 0.003) were computed with diversity-maximizing downsampling. Re-running the Mann-Whitney U test on those original values with the new genome-level classifications would confirm the null result is not an artifact of the methodological change. This could be added as a few cells at the end of the notebook.
-
Minor — Document the genome subset used for classification: The classification uses
target_genomes_expanded.csv(up to ~250 genomes per species), while the correlations inecotype_correlation_results.csvuse the full genome set (up to 3,505). A brief markdown note explaining this difference and why it's acceptable would help readers. -
Minor — Add effect size to complement p-values: The rank-biserial correlation r = 1 − 2U/(n₁ × n₂) can be computed from the existing U statistic (cell 12) to quantify how trivially small the group difference is. This would strengthen the null interpretation beyond p-values alone.
-
Minor — Document the re-harmonization choice: Cell 5 re-implements
harmonize()rather than importing the pre-computedenv_categorycolumn from the parent project's CSV (which already has it). A brief markdown note explaining why (self-containment, reproducibility) would help readers verify consistency. -
Nice-to-have — Multiple testing note: Two statistical tests are conducted (Mann-Whitney and Spearman). While both support the null and no correction is strictly needed for two tests at p > 0.25, a brief note that no multiple testing correction was applied (and why it's unnecessary given the large p-values) would preempt reviewer questions.
This review was generated by an AI system. It should be treated as advisory input, not a definitive assessment.
Visualizations
Frac Env Vs Partial Corr
Partial Corr By Group
Partial Corr Distributions
Species Classification
Frac Env Vs Partial Corr
Partial Corr By Group
Partial Corr Distributions
Species Classification
Notebooks
Data Files
| Filename | Size |
|---|---|
ecotype_corr_with_env_group.csv |
38.9 KB |
species_env_classification.csv |
15.3 KB |