Ecotype Correlation Analysis
CompletedResearch Question
What drives gene content similarity between bacterial genomes: environmental similarity or phylogenetic relatedness?
Research Plan
Hypothesis
Environmental similarity should predict gene content similarity even after controlling for phylogenetic distance. If bacteria adapt their gene repertoires to their ecological niches, genomes from similar environments should share more genes than expected from their evolutionary relationships alone.
Approach
- Select target species: Identify species with sufficient genome count (50-500) and environmental embedding coverage from AlphaEarth
- Extract distance matrices for each species:
- Environment distance: Cosine distance between AlphaEarth 64-dimensional embeddings
- Phylogenetic distance: 100 - ANI (Average Nucleotide Identity)
- Gene content distance: Jaccard distance between gene cluster presence/absence profiles
- Compute correlations:
- Raw correlation: environment vs gene content
- Partial correlation: environment vs gene content, controlling for phylogeny
- Partial correlation: phylogeny vs gene content, controlling for environment
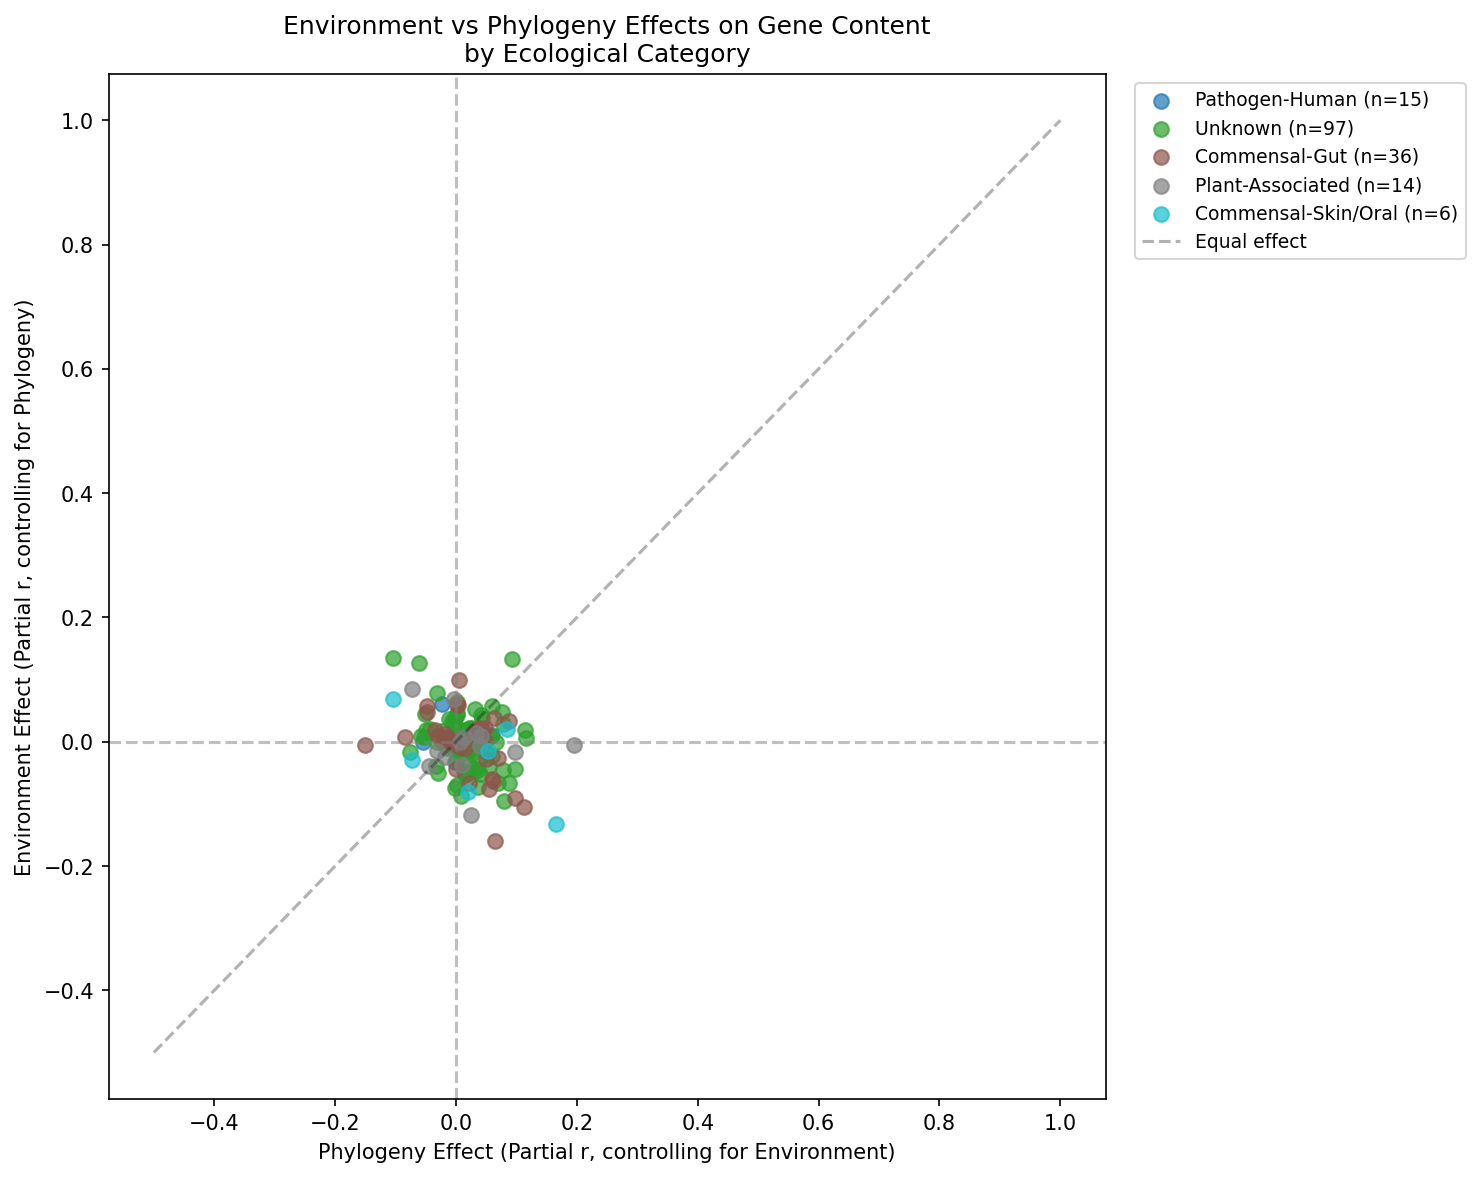
- Compare across ecological categories: Stratify by pathogen/commensal/environmental lifestyle
Revision History
- v1 (2026-02): Migrated from README.md
Overview
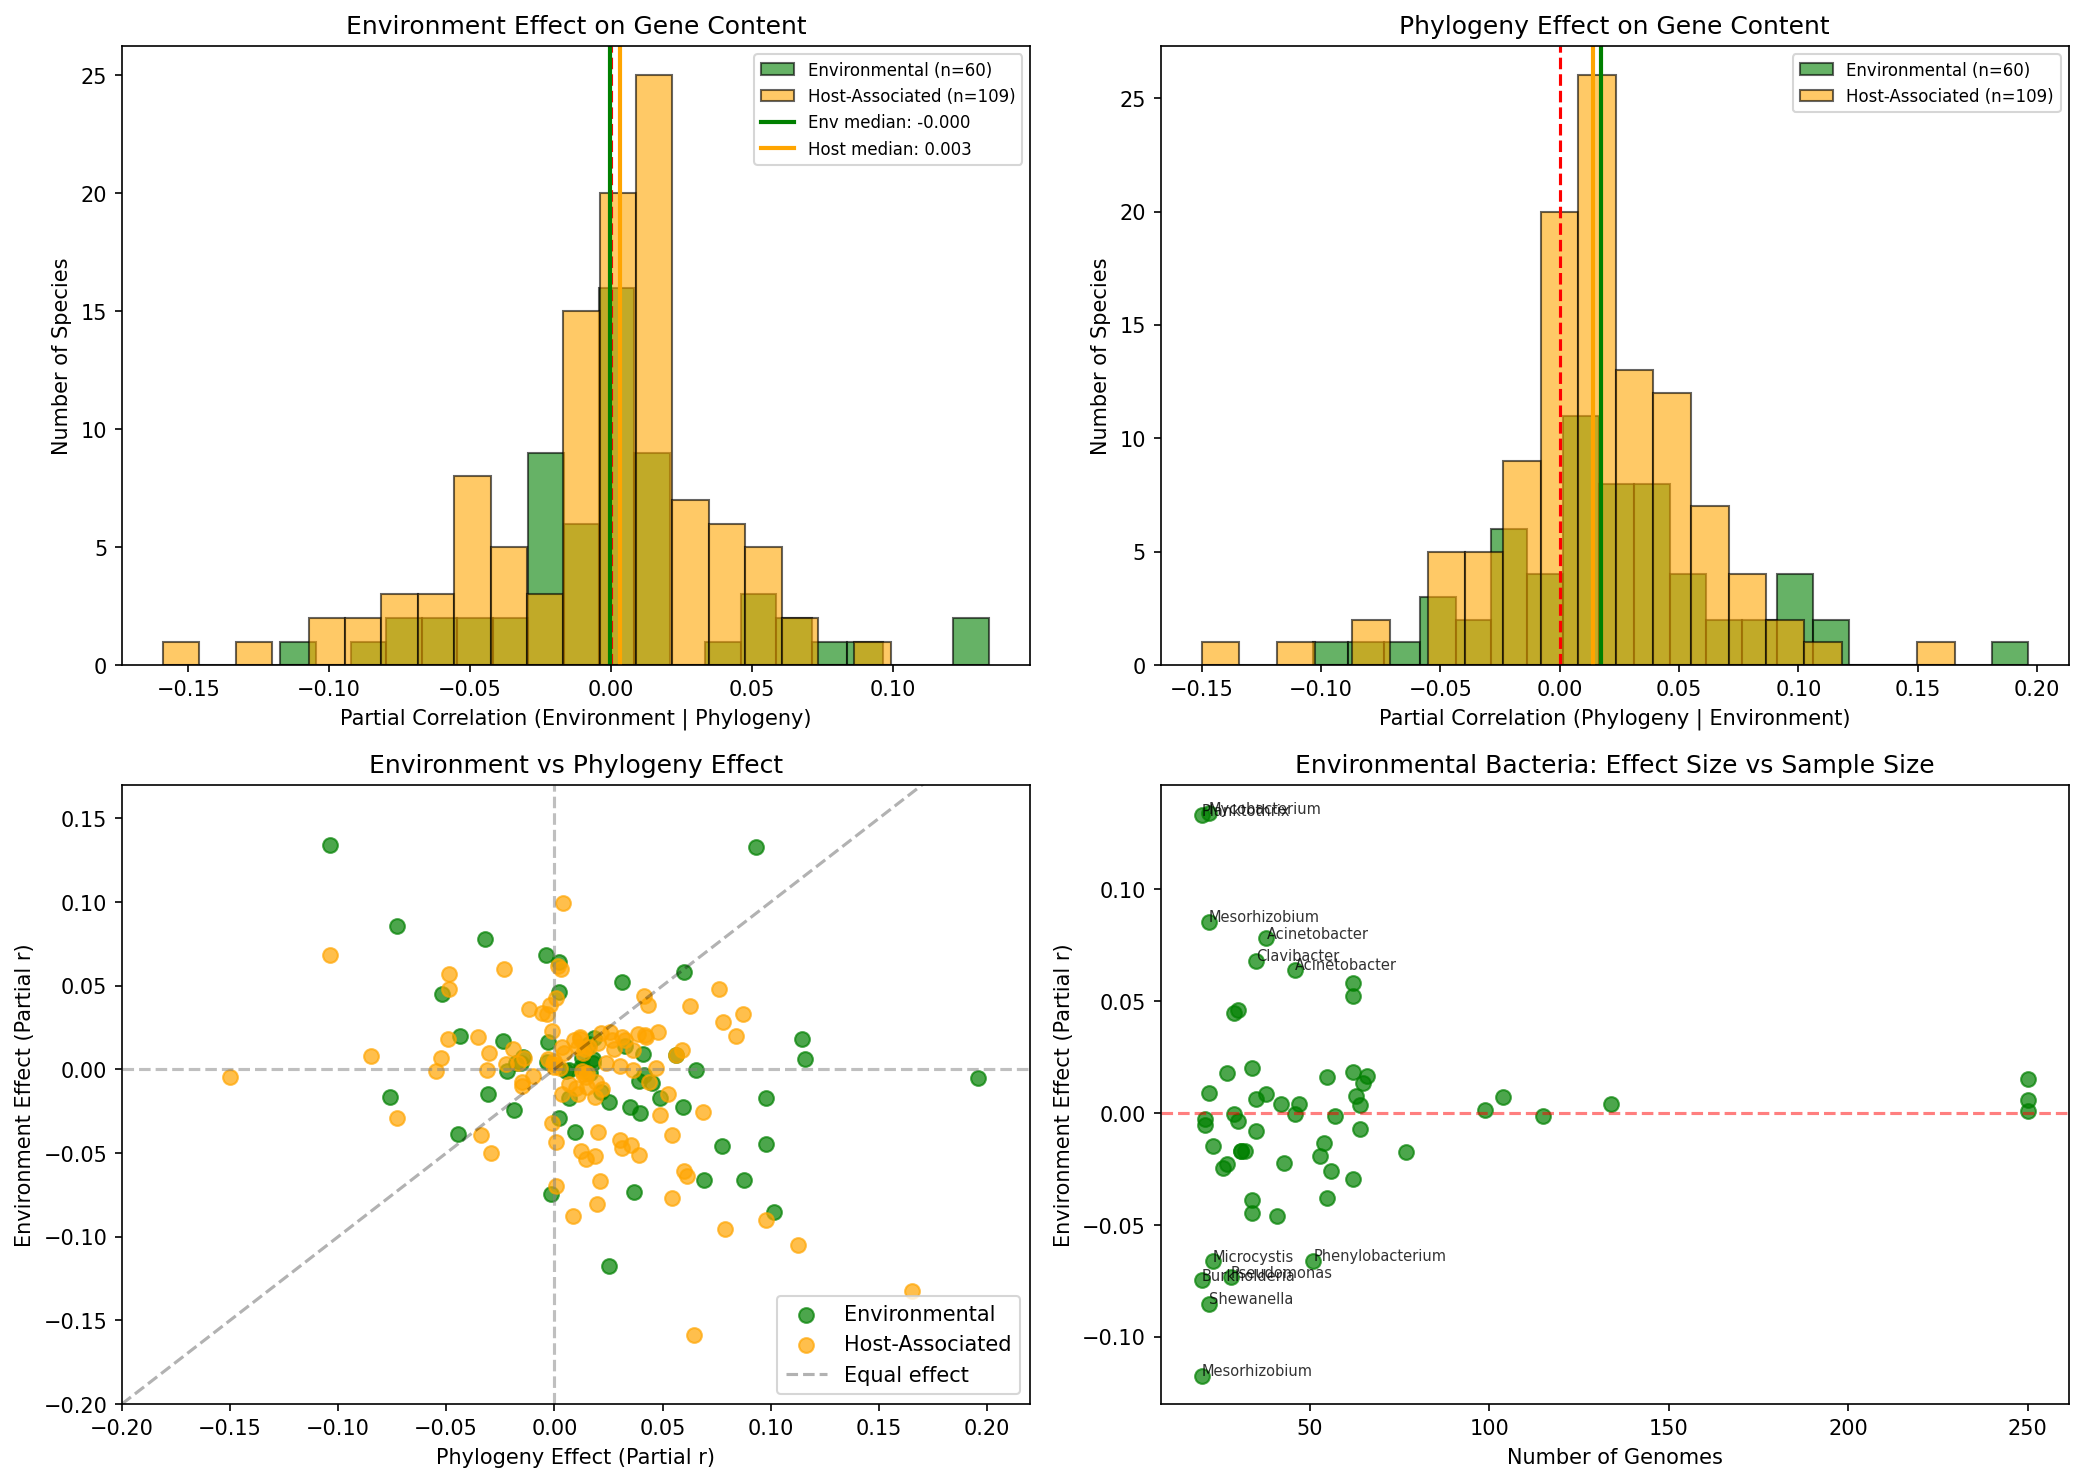
This project tests whether environmental similarity predicts gene content similarity between bacterial genomes after controlling for phylogenetic distance. Using AlphaEarth environmental embeddings, pairwise ANI, and gene cluster profiles across 172 species, it computes partial correlations to disentangle the relative contributions of ecology and evolutionary history to pangenome composition.
Key Findings
Analysis of 172 species with sufficient environmental and phylogenetic data reveals:
Phylogeny Usually Dominates
- Median partial correlation for environment: 0.0025
- Median partial correlation for phylogeny: 0.0143
- Phylogeny dominates in 60.5% of species
- Environment dominates in 39.5% of species

Provenance:
notebooks/02_ecotype_correlation_analysis.ipynb
No Difference by Lifestyle
Tested whether "environmental" bacteria (free-living, where lat/lon is meaningful) show stronger environment effects than host-associated bacteria. No significant difference found (p=0.66).
Provenance:
notebooks/02_ecotype_correlation_analysis.ipynb
Statistical Summary
- Significant positive environment effect (p<0.05): 12 species (7.0%)
- Significant negative environment effect: 4 species (2.3%)
- Not significant: 156 species (90.7%)
Category Breakdown
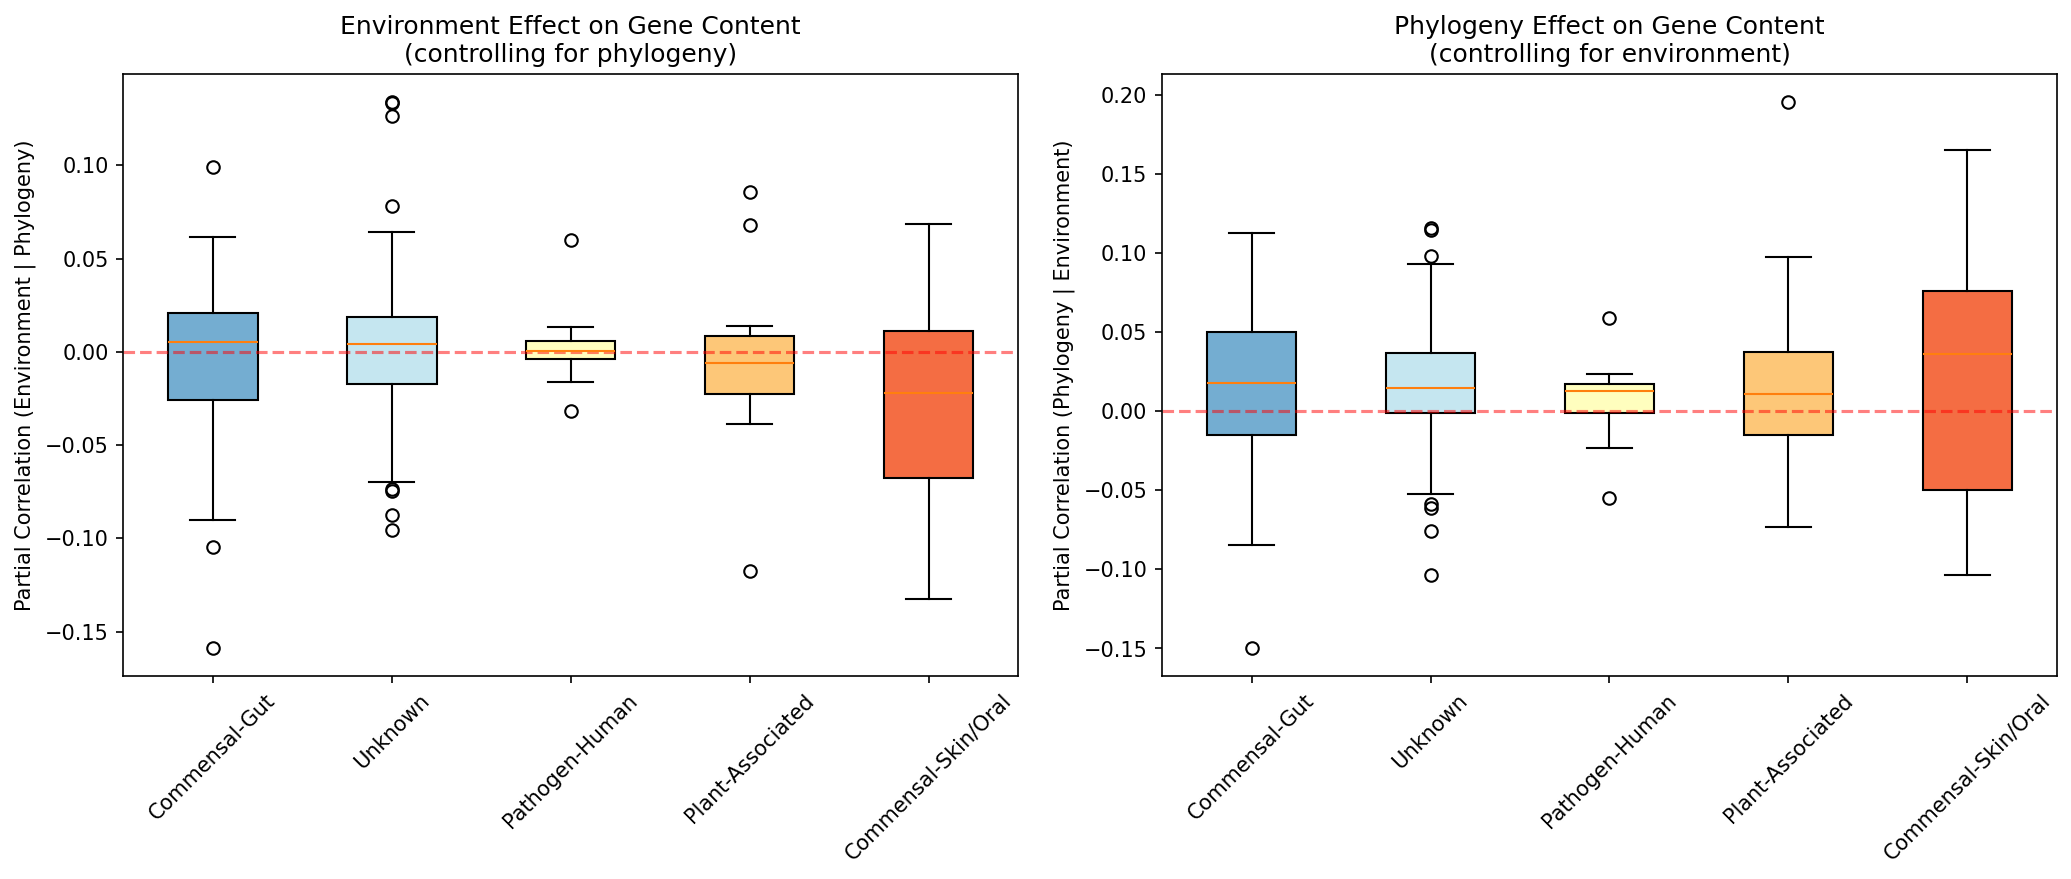
Provenance:
notebooks/02_ecotype_correlation_analysis.ipynb
Embedding Diversity
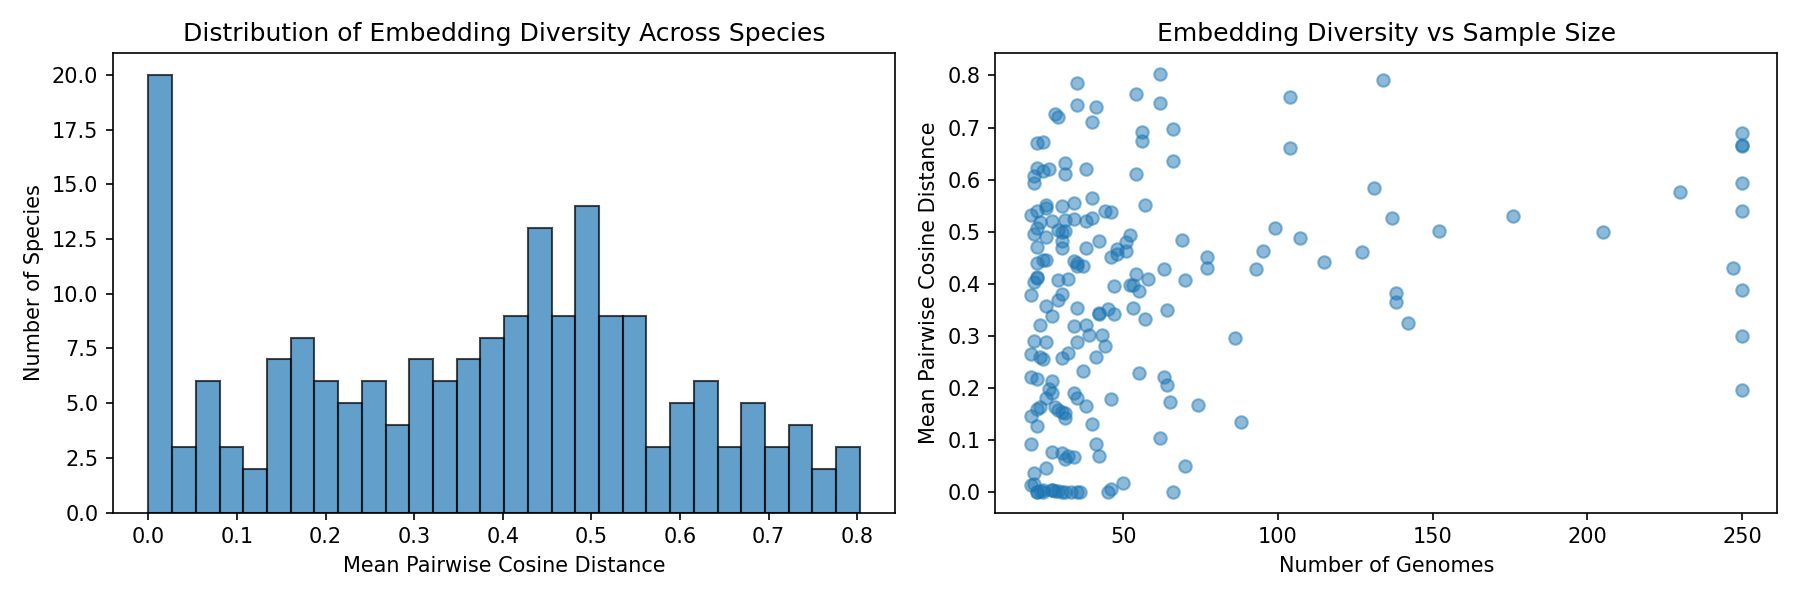
Provenance:
notebooks/01_data_extraction.ipynb
Interpretation
For most bacterial species, phylogenetic history is a stronger predictor of gene content than environmental similarity. This suggests that:
1. Vertical inheritance dominates the gene content signal
2. Environmental adaptation may act on specific gene subsets rather than the whole genome
3. The AlphaEarth embeddings may not fully capture ecologically relevant environmental variation
Literature Context
- The finding that phylogeny dominates gene content similarity is consistent with work by Garud et al. (2019) and Shapiro et al. (2012) on within-species population structure, which show that clonal ancestry shapes genome-wide variation more than ecological niche.
- The weak environmental effects on gene content relate to findings by Polz et al. (2013), who argue that horizontal gene transfer shapes population structure at specific loci rather than genome-wide, consistent with our observation that environment may act on gene subsets rather than the whole genome.
Limitations
- AlphaEarth embeddings have only 28.4% genome coverage, limiting the environmental signal available for analysis.
- Geographic coordinates from NCBI metadata are often missing or imprecise, reducing the quality of environmental associations.
- Partial correlations assume linear relationships between distance matrices, which may not capture nonlinear ecological effects.
- Host-associated organisms have less meaningful lat/lon data, as the reported coordinates reflect collection site rather than the organism's actual microenvironment.
Future Directions
- Subset by gene function: Test whether specific COG categories (e.g., V-Defense, L-Mobile) show stronger environment effects
- Alternative distance metrics: Try different embedding distances or environmental metadata directly
- Within-ecotype comparison: For species with identified ecotypes, compare gene content between ecotype clusters
Data
Sources
Data was queried from the kbase_ke_pangenome database using the following tables:
| Table | Usage |
|---|---|
alphaearth_embeddings |
Environmental embeddings for geographic coordinates |
genome |
Genome metadata and taxonomy |
ncbi_env |
NCBI environmental and isolation source metadata |
pangenome |
Pangenome composition per species |
gene_cluster |
Gene cluster presence/absence profiles |
Generated Data
| File | Description |
|---|---|
target_genomes_expanded.csv |
13,381 genomes across 224 species with metadata |
species_selection_stats.csv |
Per-species statistics for species selection |
species_embedding_diversity.csv |
Environmental diversity metrics per species |
species_embedding_coverage.csv |
Embedding coverage statistics per species |
embeddings_expanded.csv |
Expanded embedding vectors for target genomes |
ecotype_correlation_results.csv |
Correlation results for all 172 species |
ecotype_correlation_results_with_categories.csv |
Correlation results with ecological categories |
ecotype_correlation_environmental_only.csv |
Correlation results for environmental species only |
ecotype_correlation_refined_categories.csv |
Correlation results with refined category assignments |
ecotype_correlation_with_pangenome.csv |
Correlation results incorporating pangenome metrics |
species_ecological_categories.csv |
Ecological categorization of species |
embedding_diversity_distribution.png |
Distribution plot (copy in data directory) |
ani_expanded/ |
Per-species ANI distance matrices |
gene_clusters_expanded/ |
Per-species gene cluster profiles |
References
- Garud NR et al. (2019). "Population genetics in the human microbiome." Trends Genet 35:626-636.
- Shapiro BJ et al. (2012). "Population genomics of early events in the ecological differentiation of bacteria." Science 336:48-51.
- Polz MF et al. (2013). "Horizontal gene transfer and the evolution of bacterial and archaeal population structure." Trends Genet 29:170-175. PMID: 23332119
- Parks DH et al. (2022). "GTDB: an ongoing census of bacterial and archaeal diversity through a phylogenetically consistent, rank normalized and complete genome-based taxonomy." Nucleic Acids Res 50:D199-D207. PMID: 34520557
Discoveries
Analysis of 172 species with sufficient data showed:
- Median partial correlation for environment effect: 0.0025
- Median partial correlation for phylogeny effect: 0.0143
- Phylogeny dominates in 60.5% of species
- Environment dominates in 39.5% of species
No significant difference between "environ
Read more →ANI extraction requires per-species iteration
January 2026Attempting to query ANI for all 13K+ genomes in a single IN clause fails/times out. Must iterate over species and query ANI for each species separately. See docs/performance.md for pattern.
Data Collections
Used By
Data from this project is used by other projects.
Visualizations
Ecotype By Category
Ecotype Correlation Summary
Ecotype Scatter By Category
Embedding Diversity Distribution
Environmental Vs Host Comparison
Notebooks
Data Files
| Filename | Size |
|---|---|
ecotype_correlation_results.csv |
30.3 KB |