Metabolic Capability vs Metabolic Dependency
CompletedResearch Question
Just because a bacterium's genome encodes a complete metabolic pathway (metabolic capability), does the organism actually depend on it? Can we distinguish genomic capability from functional dependency using experimental fitness data?
Research Plan
Hypothesis
- H0: GapMind pathway completeness is independent of pathway gene fitness importance — predicted-complete pathways are equally likely to contain fitness-important and fitness-neutral genes.
- H1: Predicted-complete pathways partition into two distinct classes:
- Active dependencies — complete pathway + fitness-important genes (disruption causes growth defect)
- Latent capabilities — complete pathway + fitness-neutral genes (pathway is genomically present but experimentally dispensable)
Secondary Hypotheses
- H2 (Black Queen): Species with more "latent capabilities" have more open pangenomes — ongoing genome streamlining removes dispensable pathways over evolutionary time.
- H3 (Metabolic ecotypes): Within-species variation in pathway completeness defines metabolic ecotypes that correlate with pangenome structure (core vs accessory pathway genes).
Approach
Phase 1: Data Integration (Notebooks 01-02)
Link GapMind pathway predictions to Fitness Browser organisms via the existing FB-pangenome bridge.
Phase 2: Pathway Classification (Notebook 03)
For each organism-pathway pair, classify as: active dependency, latent capability, or absent.
Phase 3: Cross-Species Patterns (Notebook 04)
Test hypotheses H2 and H3 at the pangenome and species level.
Phase 4: Visualization & Synthesis (Notebook 05)
Summary figures and statistical validation.
Revision History
- v2 (2026-02-18): Created all 5 analysis notebooks (01-05). NB01-02 run on JupyterHub (Spark), NB03-05 run locally. Self-contained data extraction avoids dependency on upstream project data files. Added KEGG-to-GapMind pathway mapping for gene-level linking.
- v1 (2026-02-17): Initial plan
Overview
Metabolic pathway prediction from genomes assumes that pathway completeness implies biological relevance. However, many "complete" pathways may be latent capabilities — present but unexpressed, or expressed but functionally redundant with alternative pathways. This project integrates genome-scale metabolic predictions (GapMind pathways) with genome-wide fitness profiling (RB-TnSeq from Fitness Browser) to classify pathways as active dependencies (complete + fitness-important), latent capabilities (complete + fitness-neutral), or missing (incomplete).
For ~30 organisms with both fitness data and pangenome links, we:
1. Map GapMind pathway predictions to fitness-tested genes
2. Classify each predicted-complete pathway by aggregated fitness importance
3. Test if "latent capabilities" predict future gene loss (Black Queen Hypothesis)
4. Identify metabolic ecotypes within species based on pathway heterogeneity
Key Findings
H1 Supported: A Substantial Fraction of Complete Pathways Are Functionally Neutral
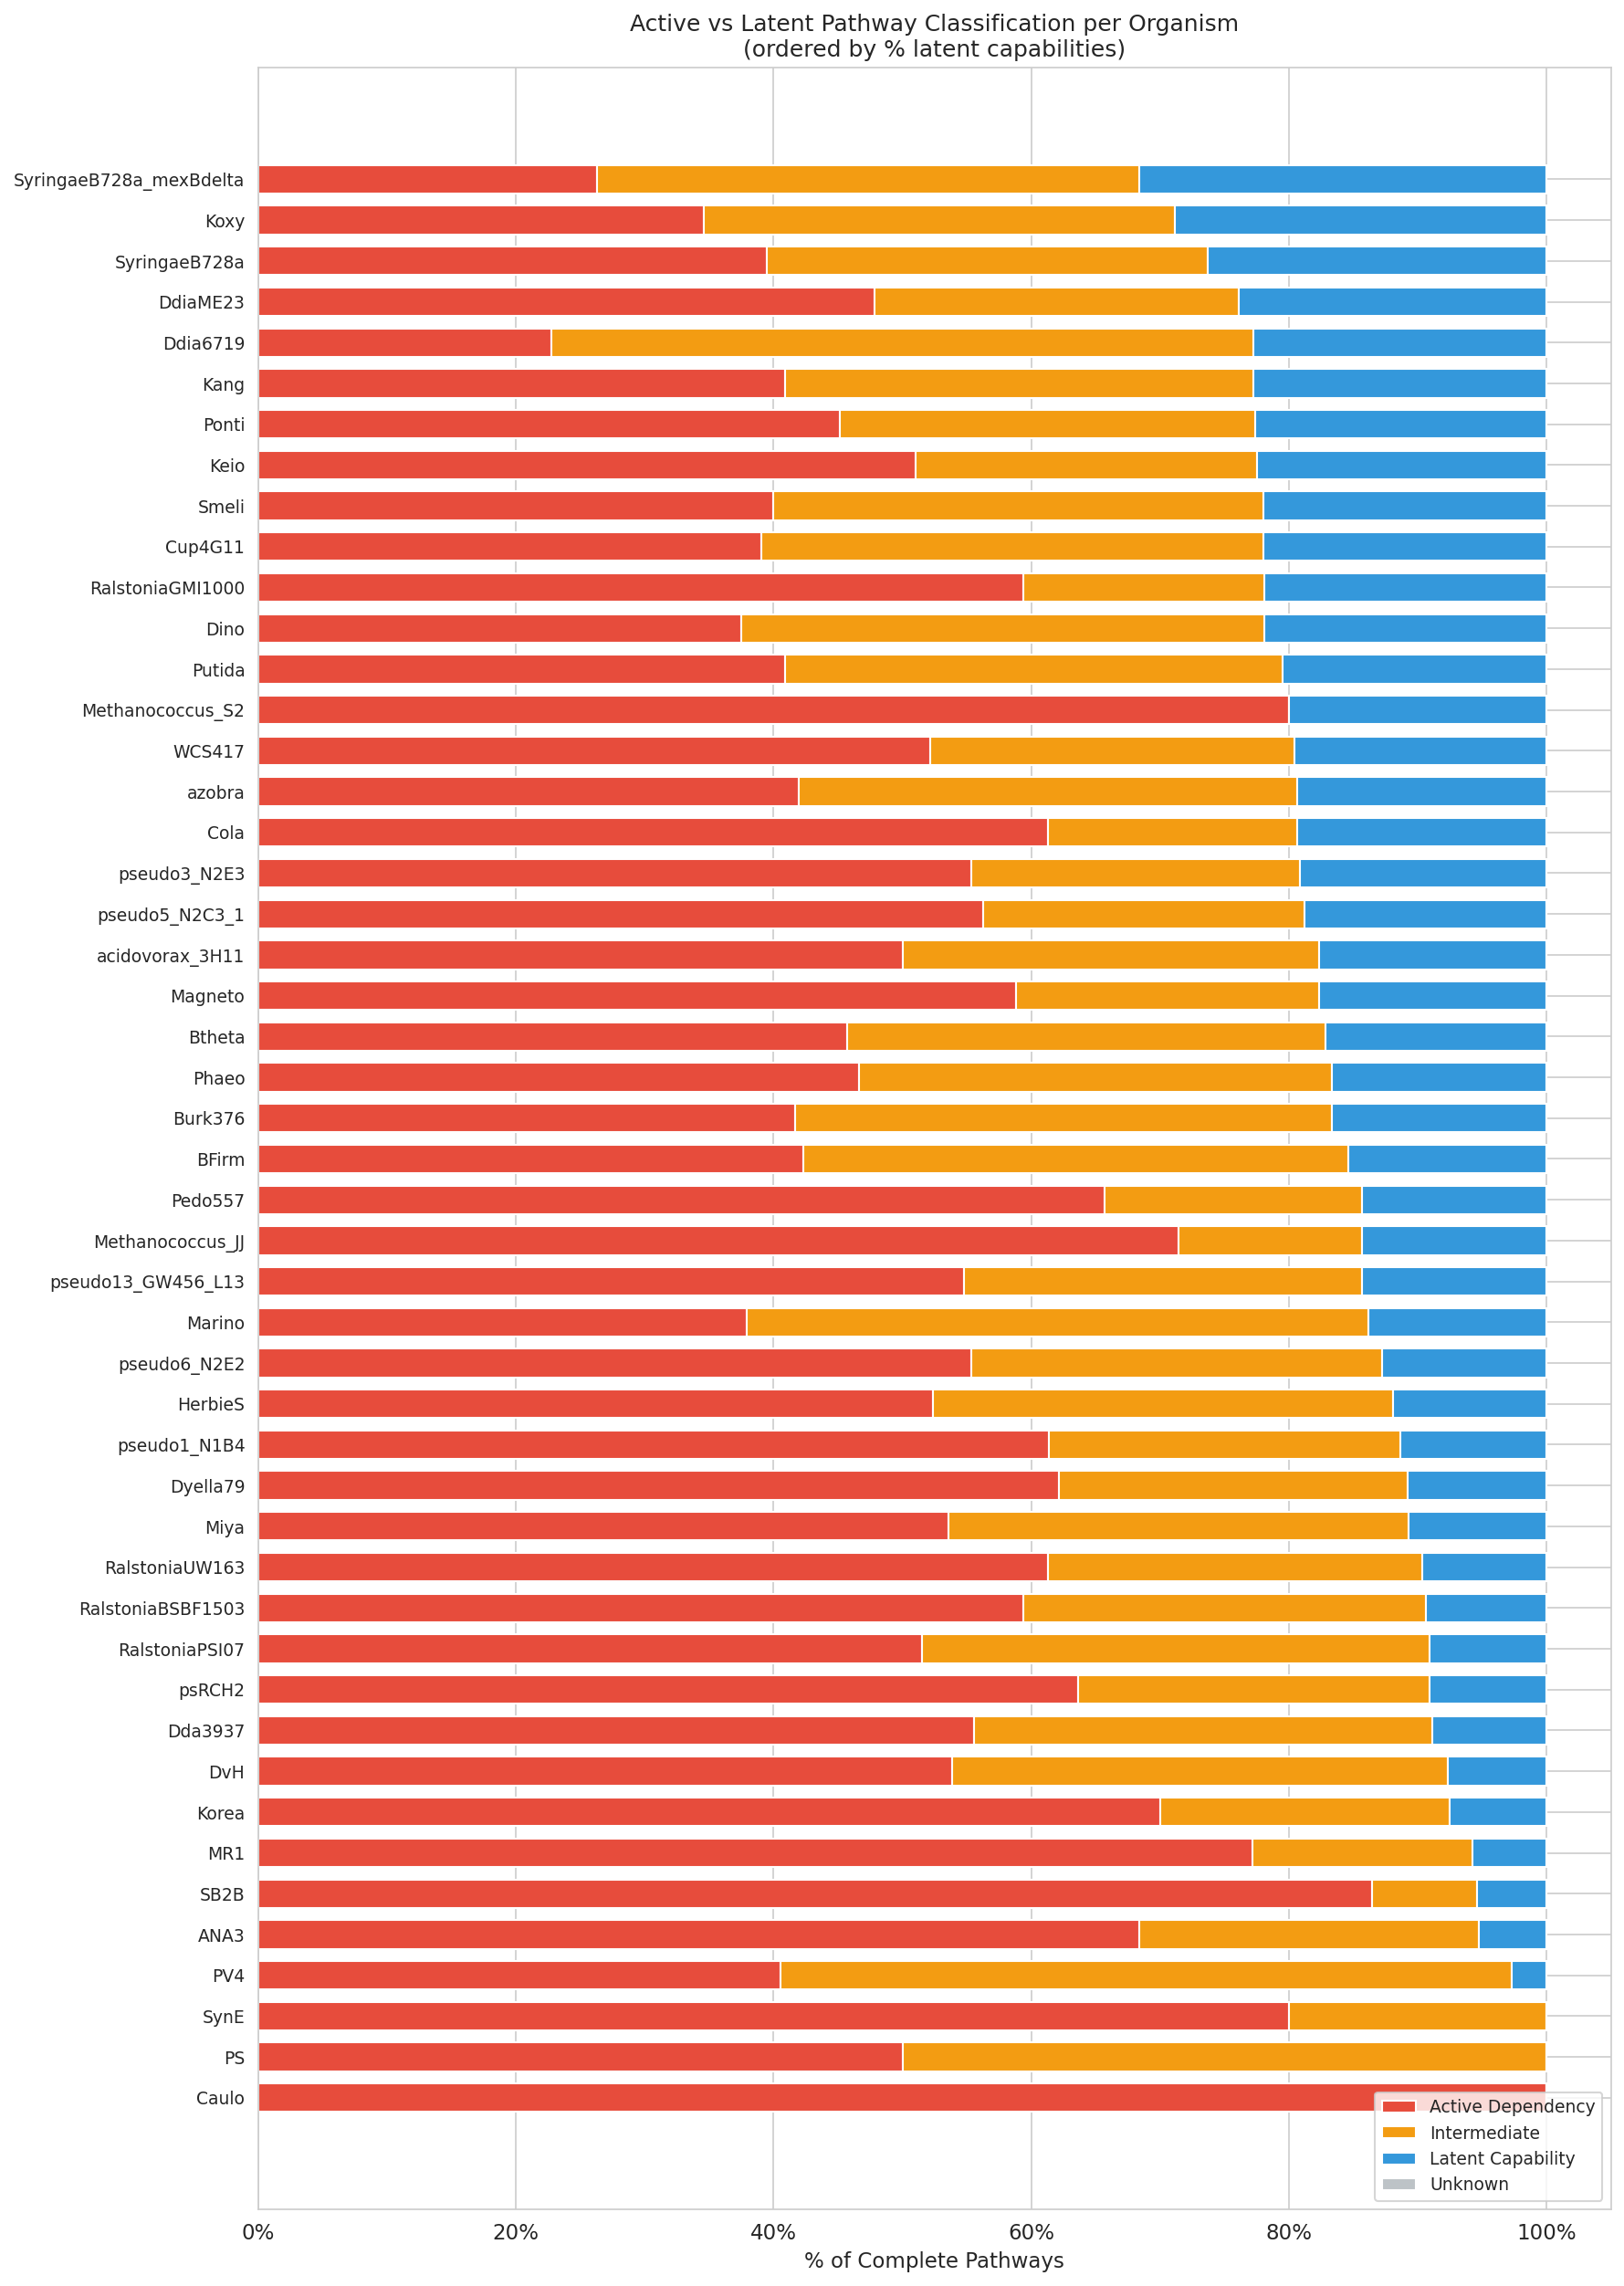
Across 1,695 pathway-organism pairs from 48 organisms, 15.8% of genomically complete pathways were classified as latent capabilities — pathways the genome encodes but that show no detectable fitness importance under tested conditions (mean |t-score| < 1.0, < 5% essential genes). An additional 32.3% fell in an intermediate zone.
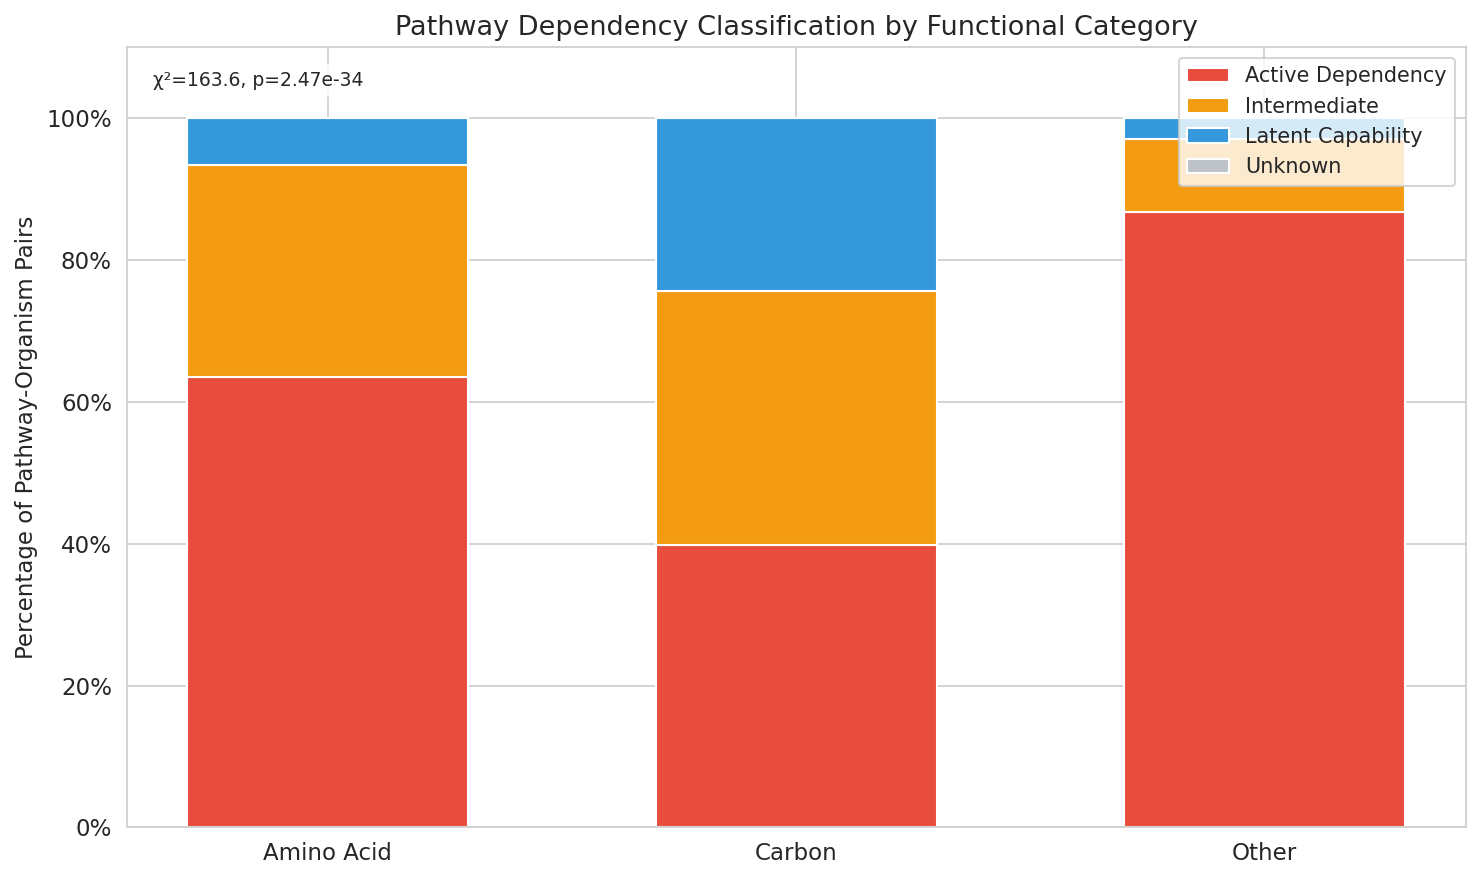
Pathway category strongly predicted dependency class (χ²=163.6, df=4, p=2.5×10⁻³⁴). Carbon source utilization pathways were most likely to be latent (24.3% latent, 39.8% active), while amino acid biosynthesis pathways were predominantly active (63.5% active, 6.5% latent). "Other" category pathways were rarely latent (2.9% latent, 86.8% active).
The latent fraction varied substantially across organisms (range 0–31.6%, mean 15.0%), with Pseudomonas syringae strains and Klebsiella michiganensis showing the highest proportions.
(Notebooks: 02_map_pathways_to_fitness.ipynb, 03_classify_pathway_dependencies.ipynb)
H2 Mixed: Pathway-Level Conservation Undifferentiated; Pangenome Openness Correlated with Latent Rate
The Black Queen Hypothesis (H2) was tested at two levels, with contrasting outcomes:
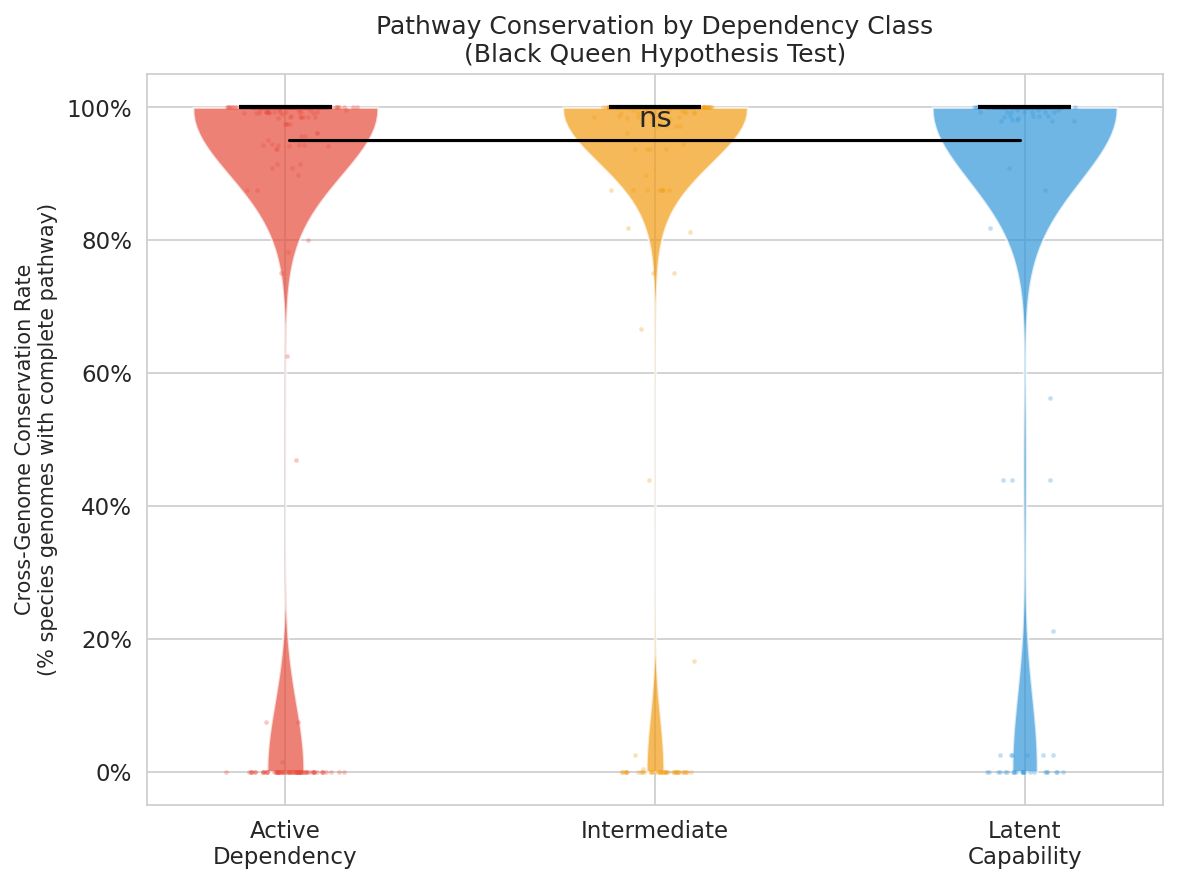
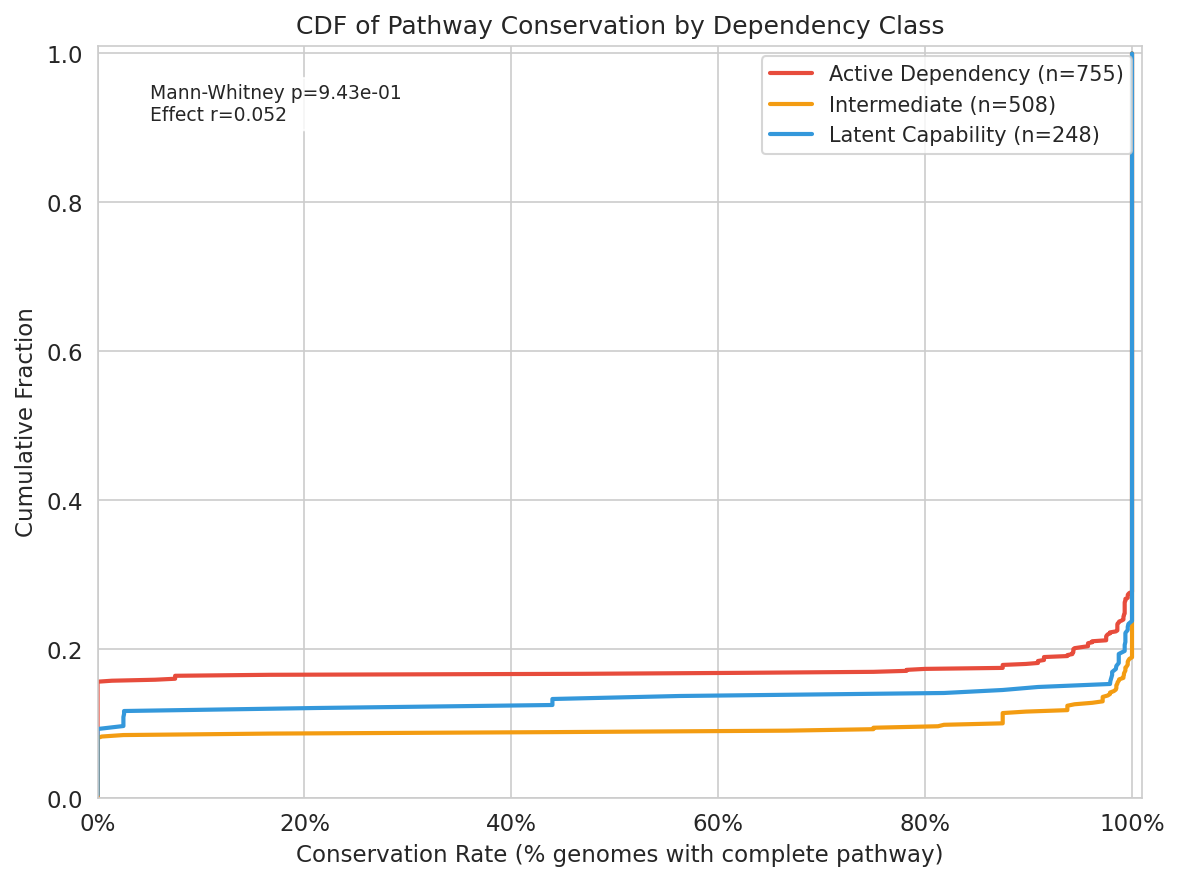
H2a — Pathway-level conservation (not supported). Conservation rates (fraction of species genomes carrying a complete pathway) did not differ between latent capabilities and active dependencies:
| Dependency Class | n | Mean conservation | Median |
|---|---|---|---|
| Active dependency | 755 | 0.829 | 1.000 |
| Intermediate | 508 | 0.907 | 1.000 |
| Latent capability | 248 | 0.869 | 1.000 |
Latent capabilities showed slightly higher mean conservation than active dependencies (Mann-Whitney U, p = 0.94 for active > latent; rank-biserial r = 0.052). H2a is not supported.
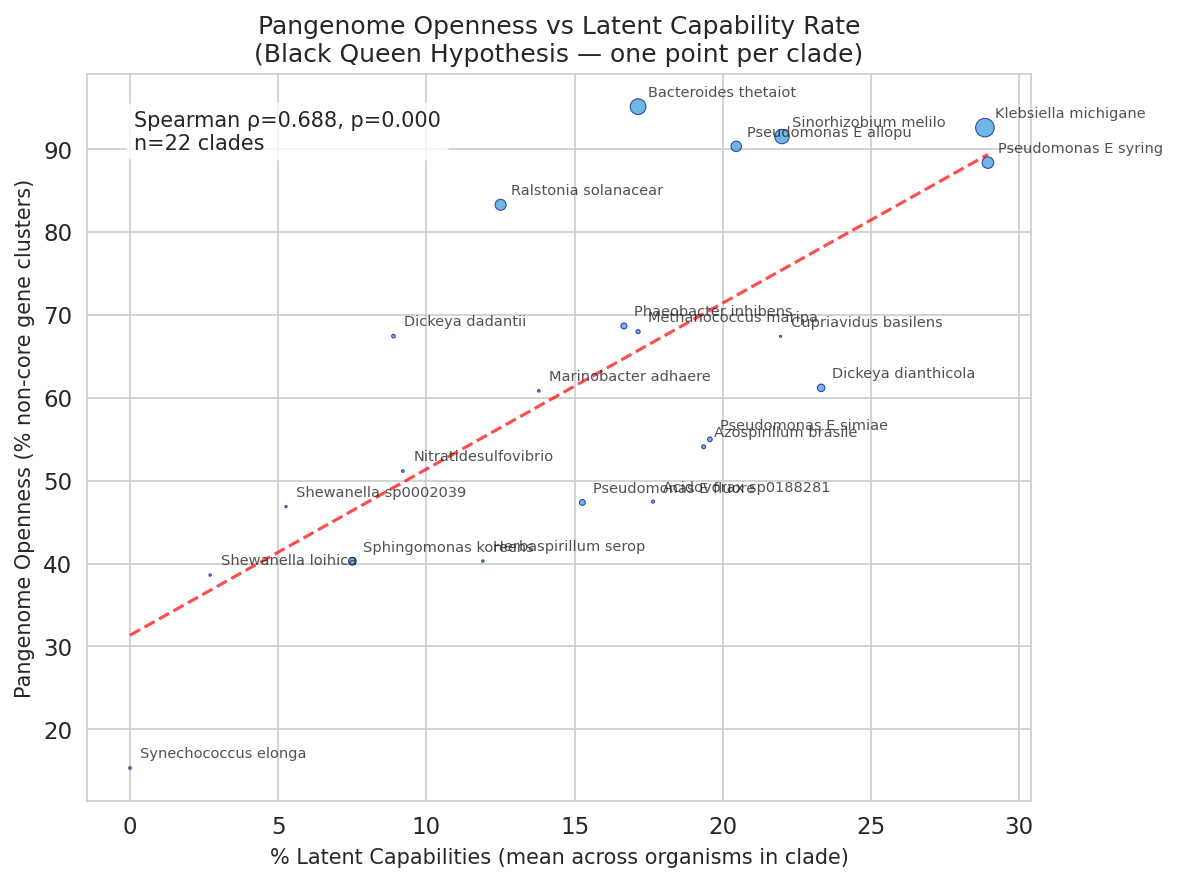
H2b — Pangenome openness (supported). After aggregating 41 organisms to 22 unique species clades (to ensure independence — multiple Fitness Browser strains from the same clade share a single pangenome openness value), the fraction of latent capabilities per clade correlated positively with pangenome openness (Spearman ρ = 0.69, p = 0.0004, n = 22 clades). Clades with more fitness-neutral complete pathways tend to have more dynamic, less-conserved pangenomes — consistent with the Black Queen framework at the species level.
(Notebook: 04_black_queen_test.ipynb)
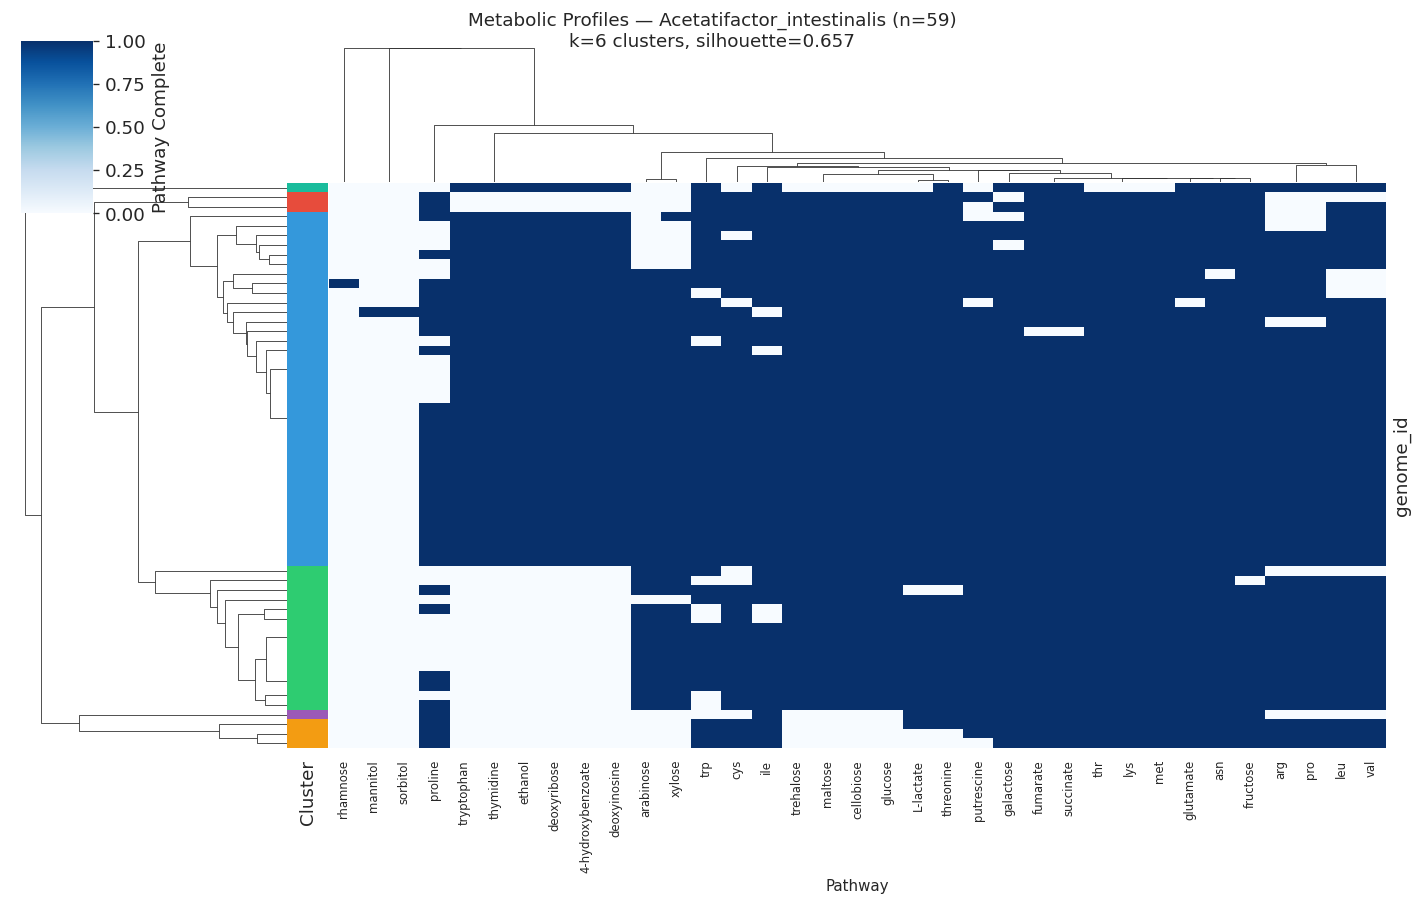
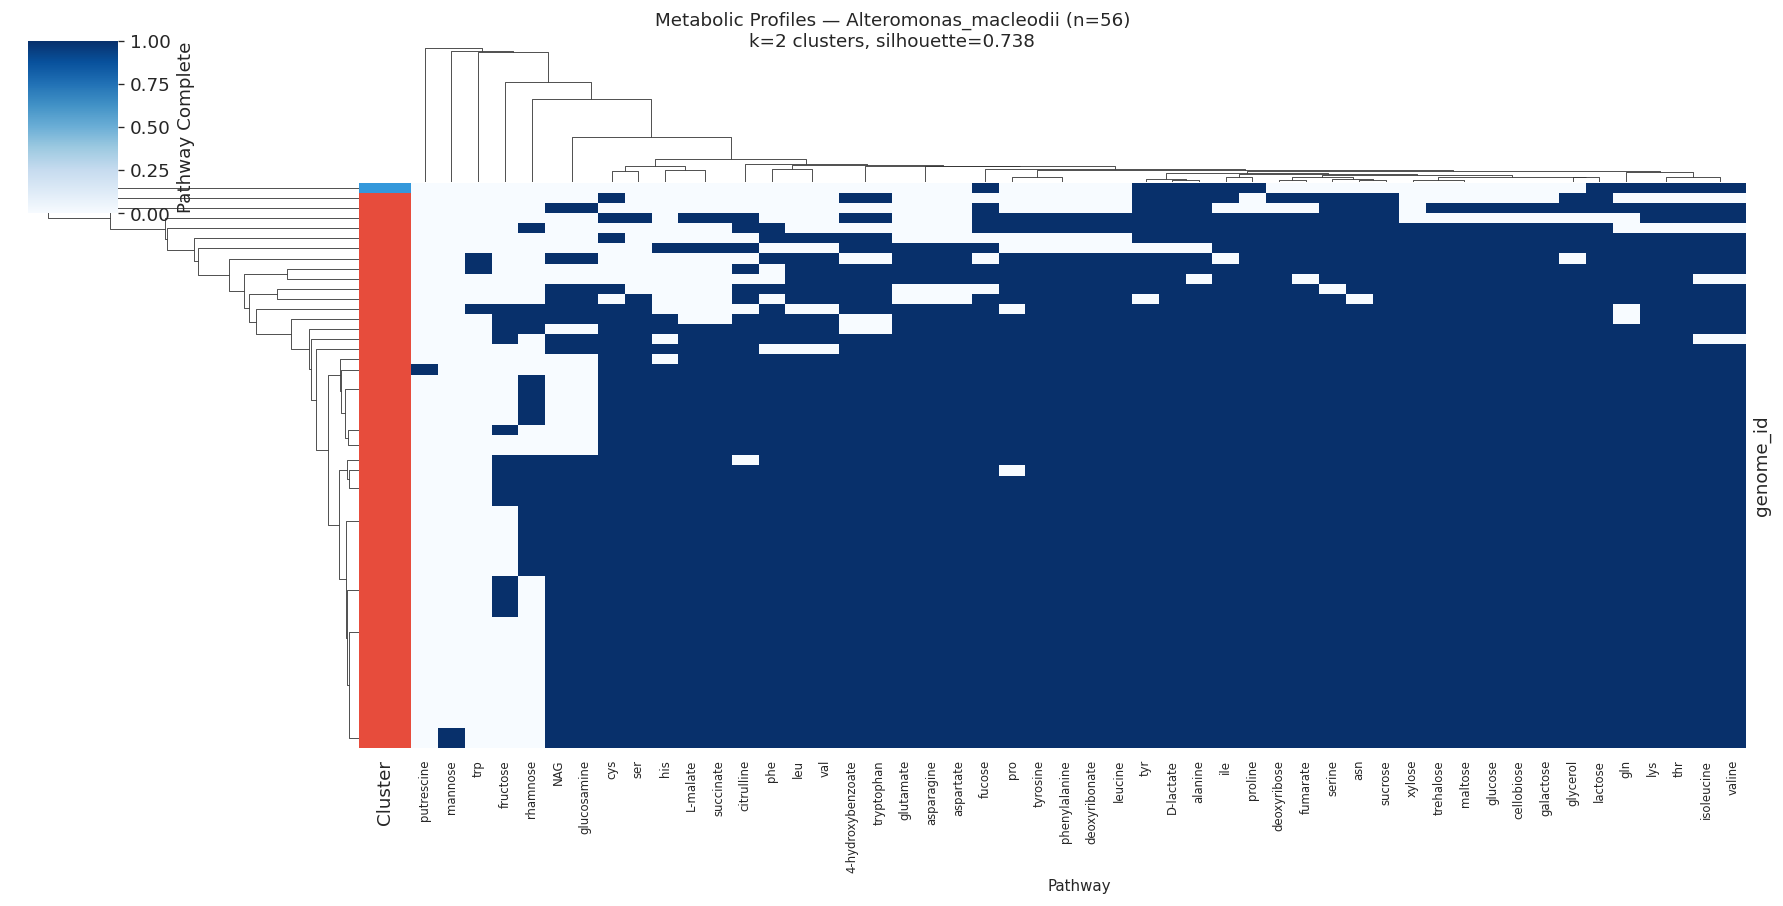
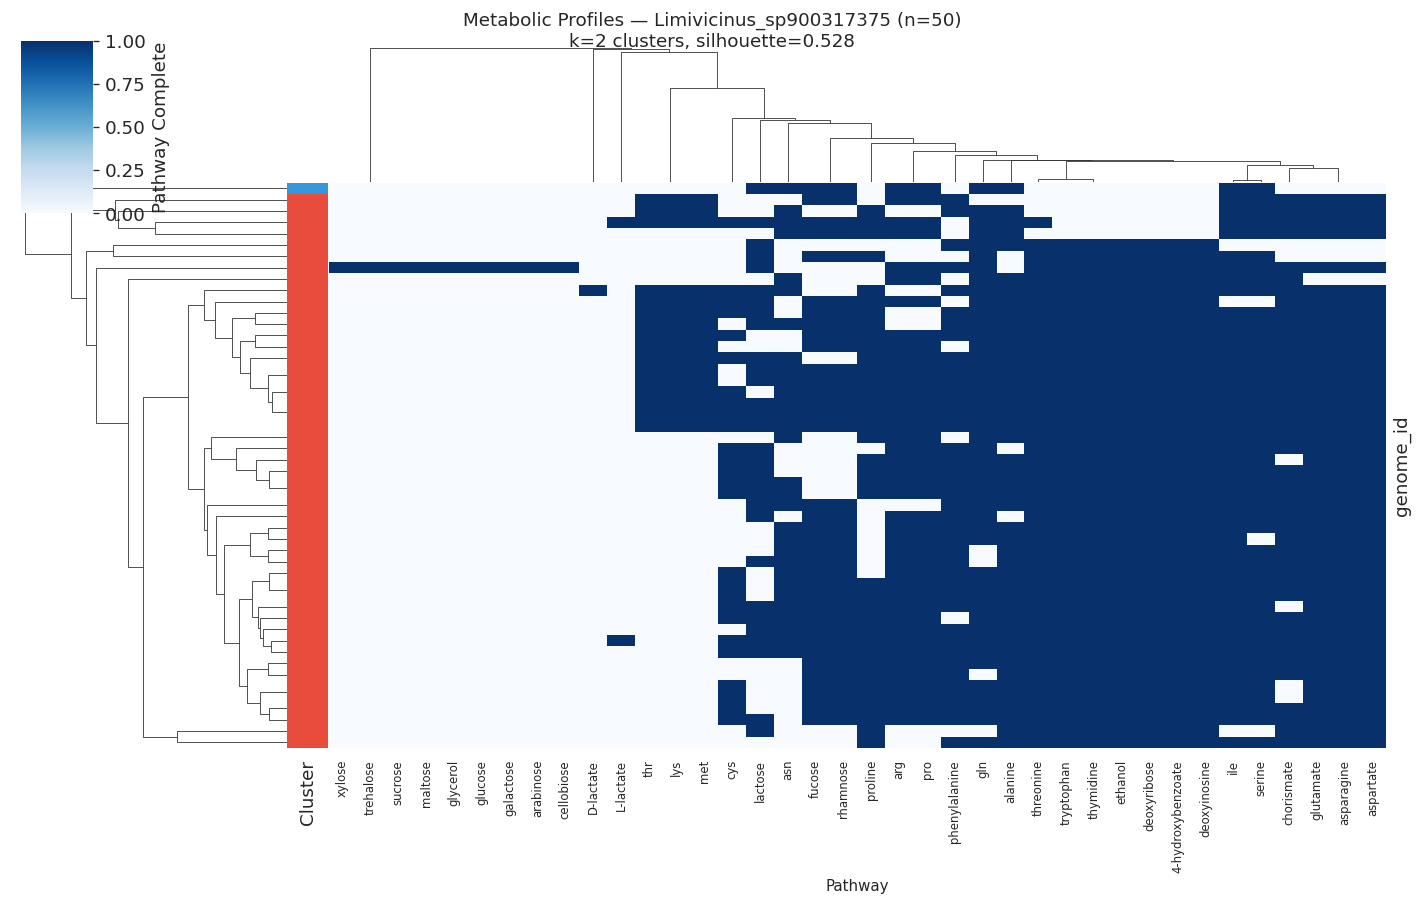
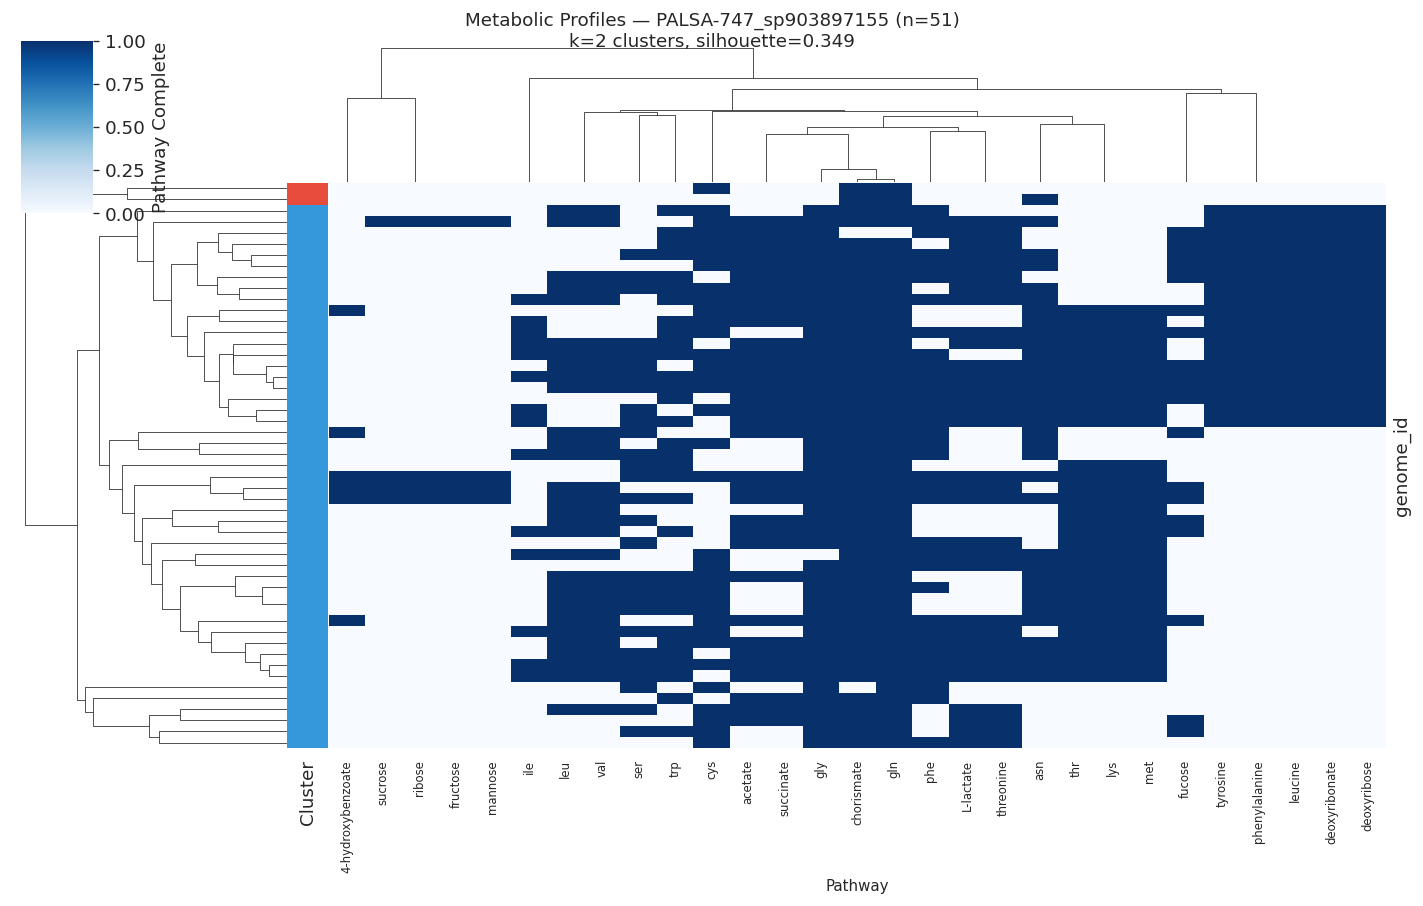
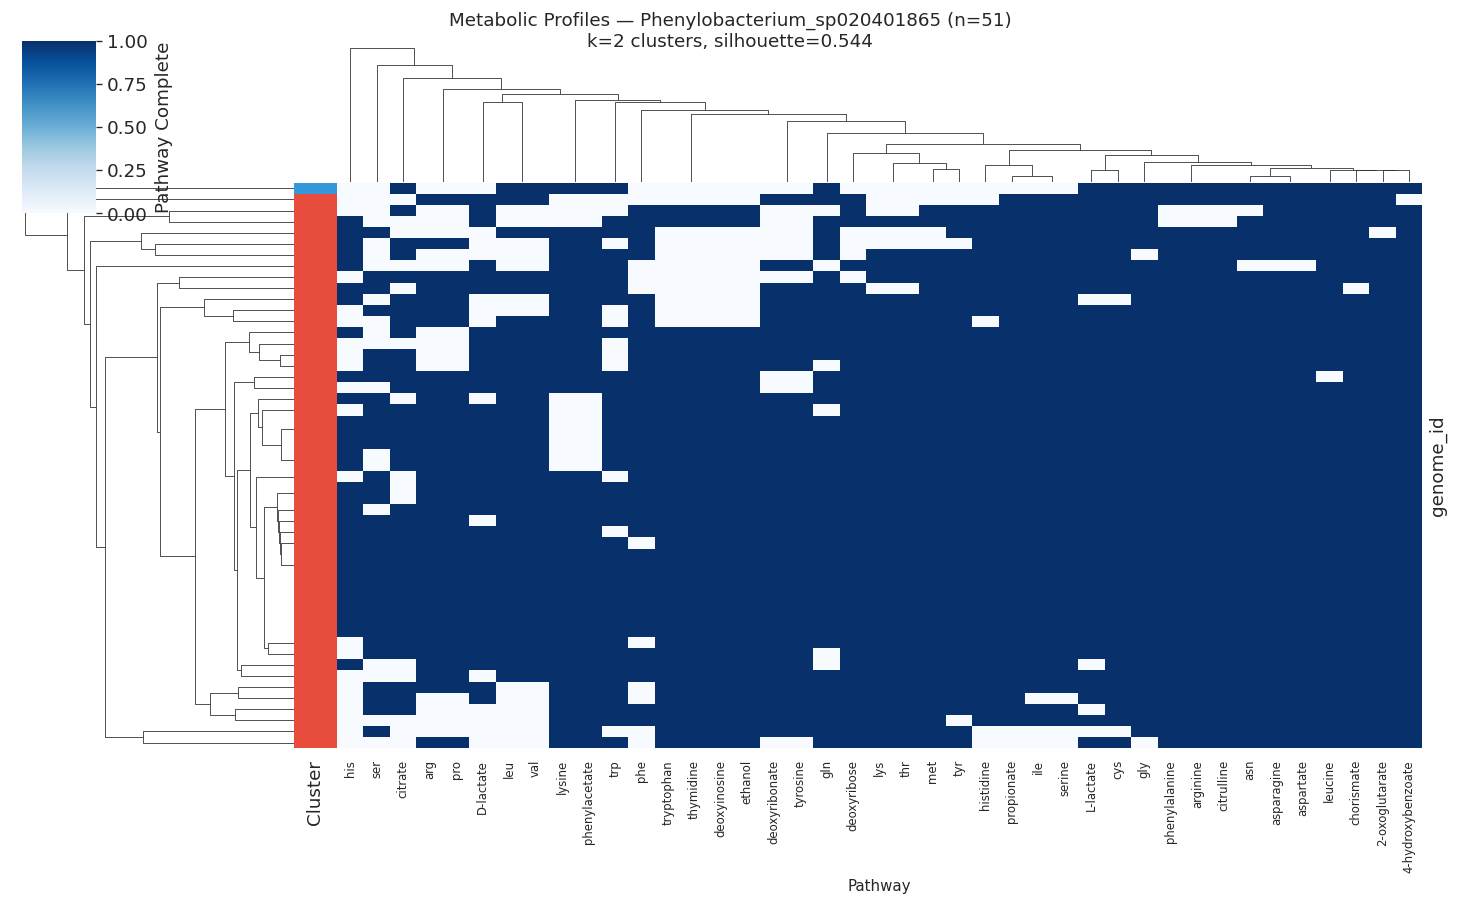
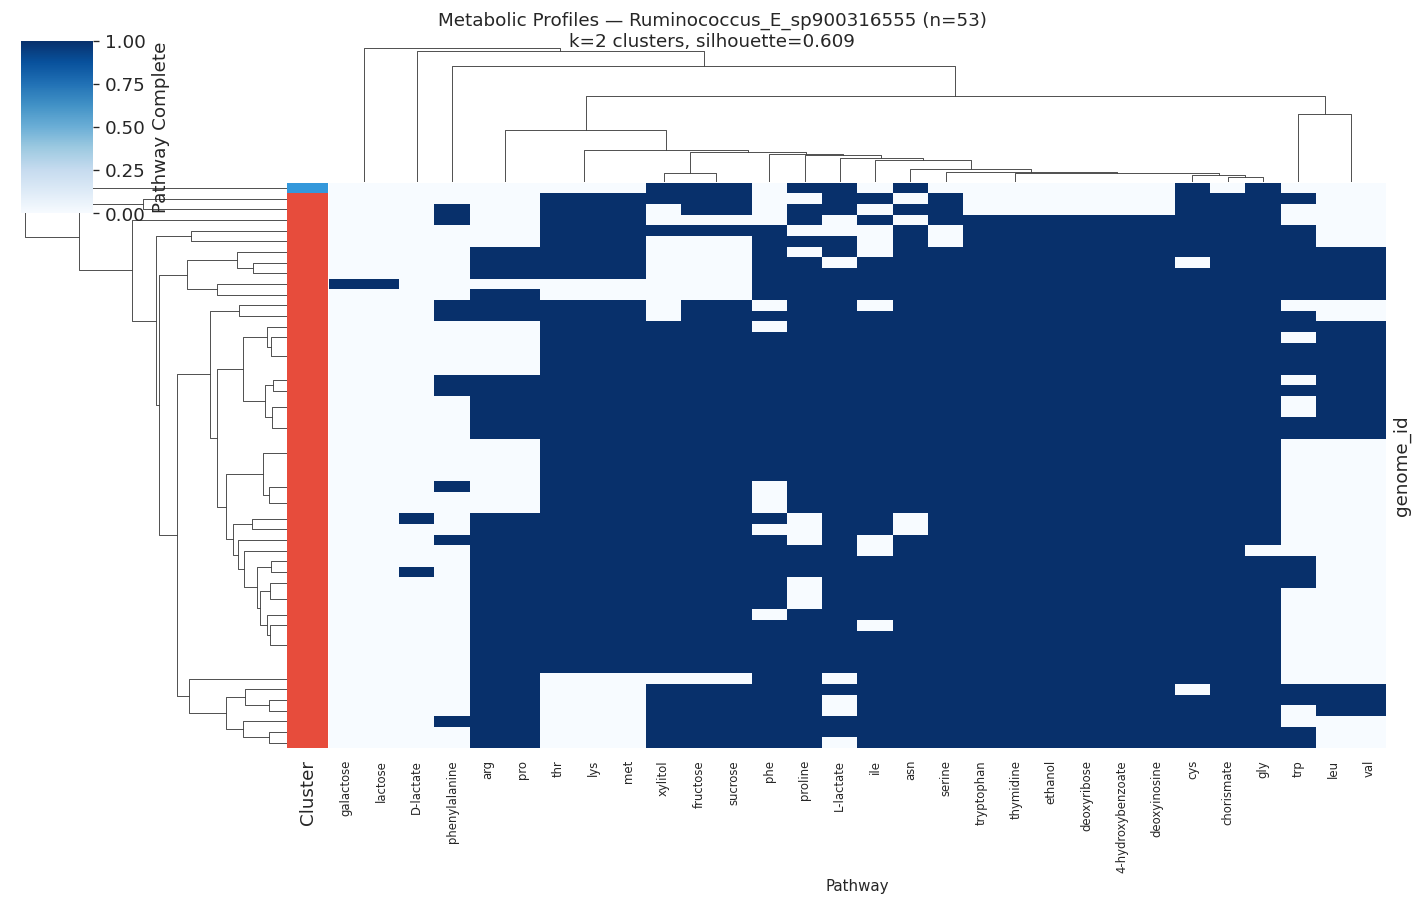
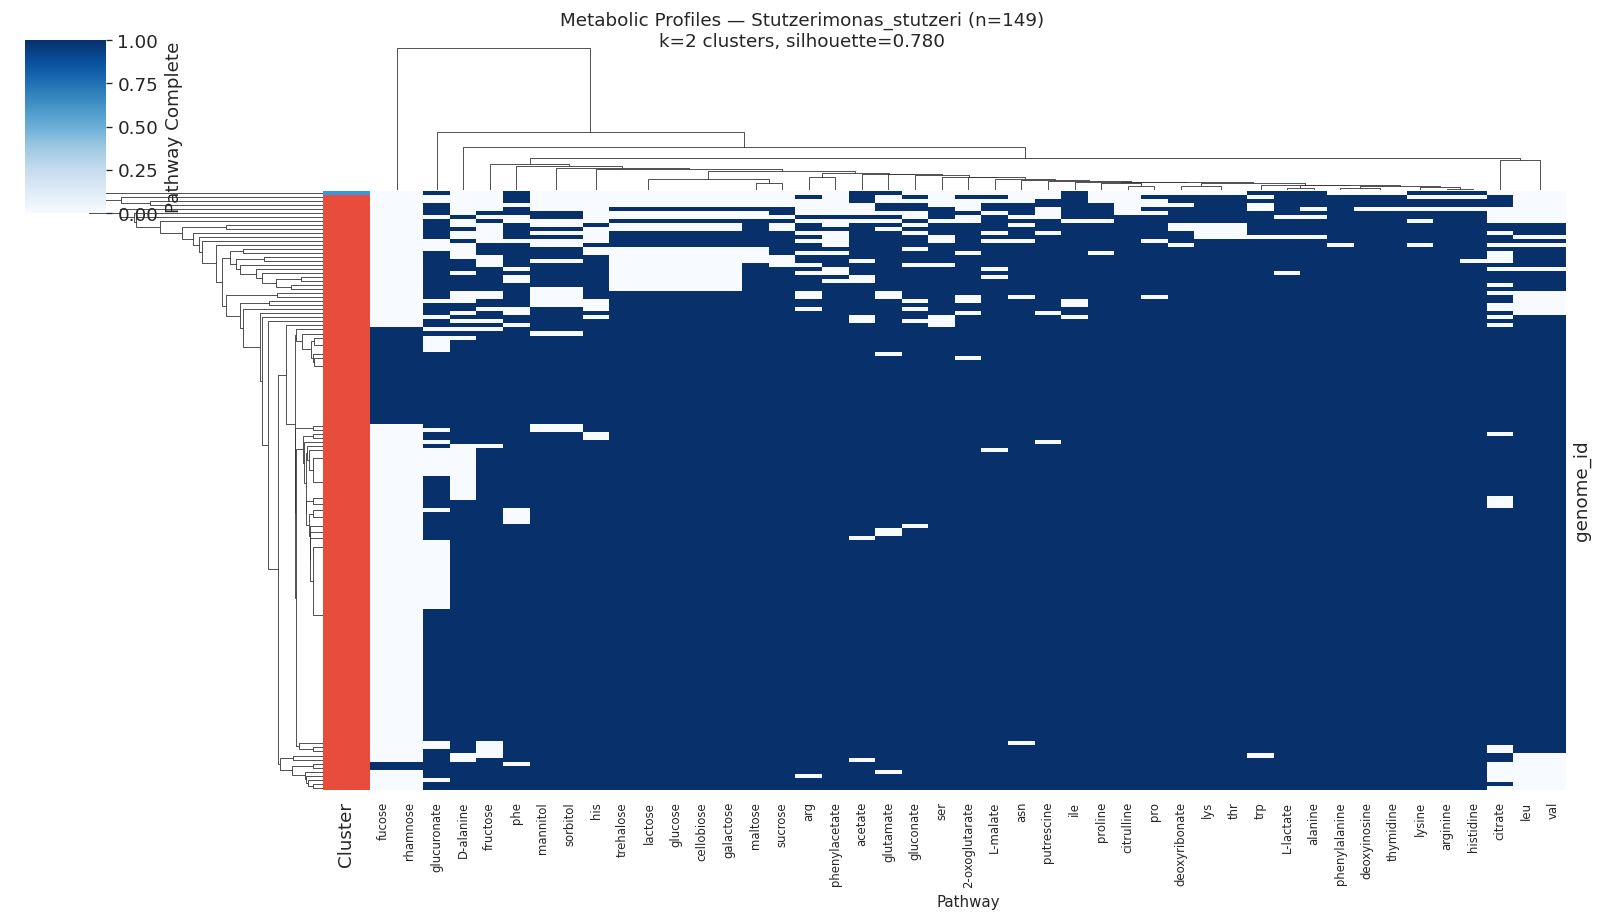
H3 Supported: All Target Species Show Distinct Metabolic Ecotypes
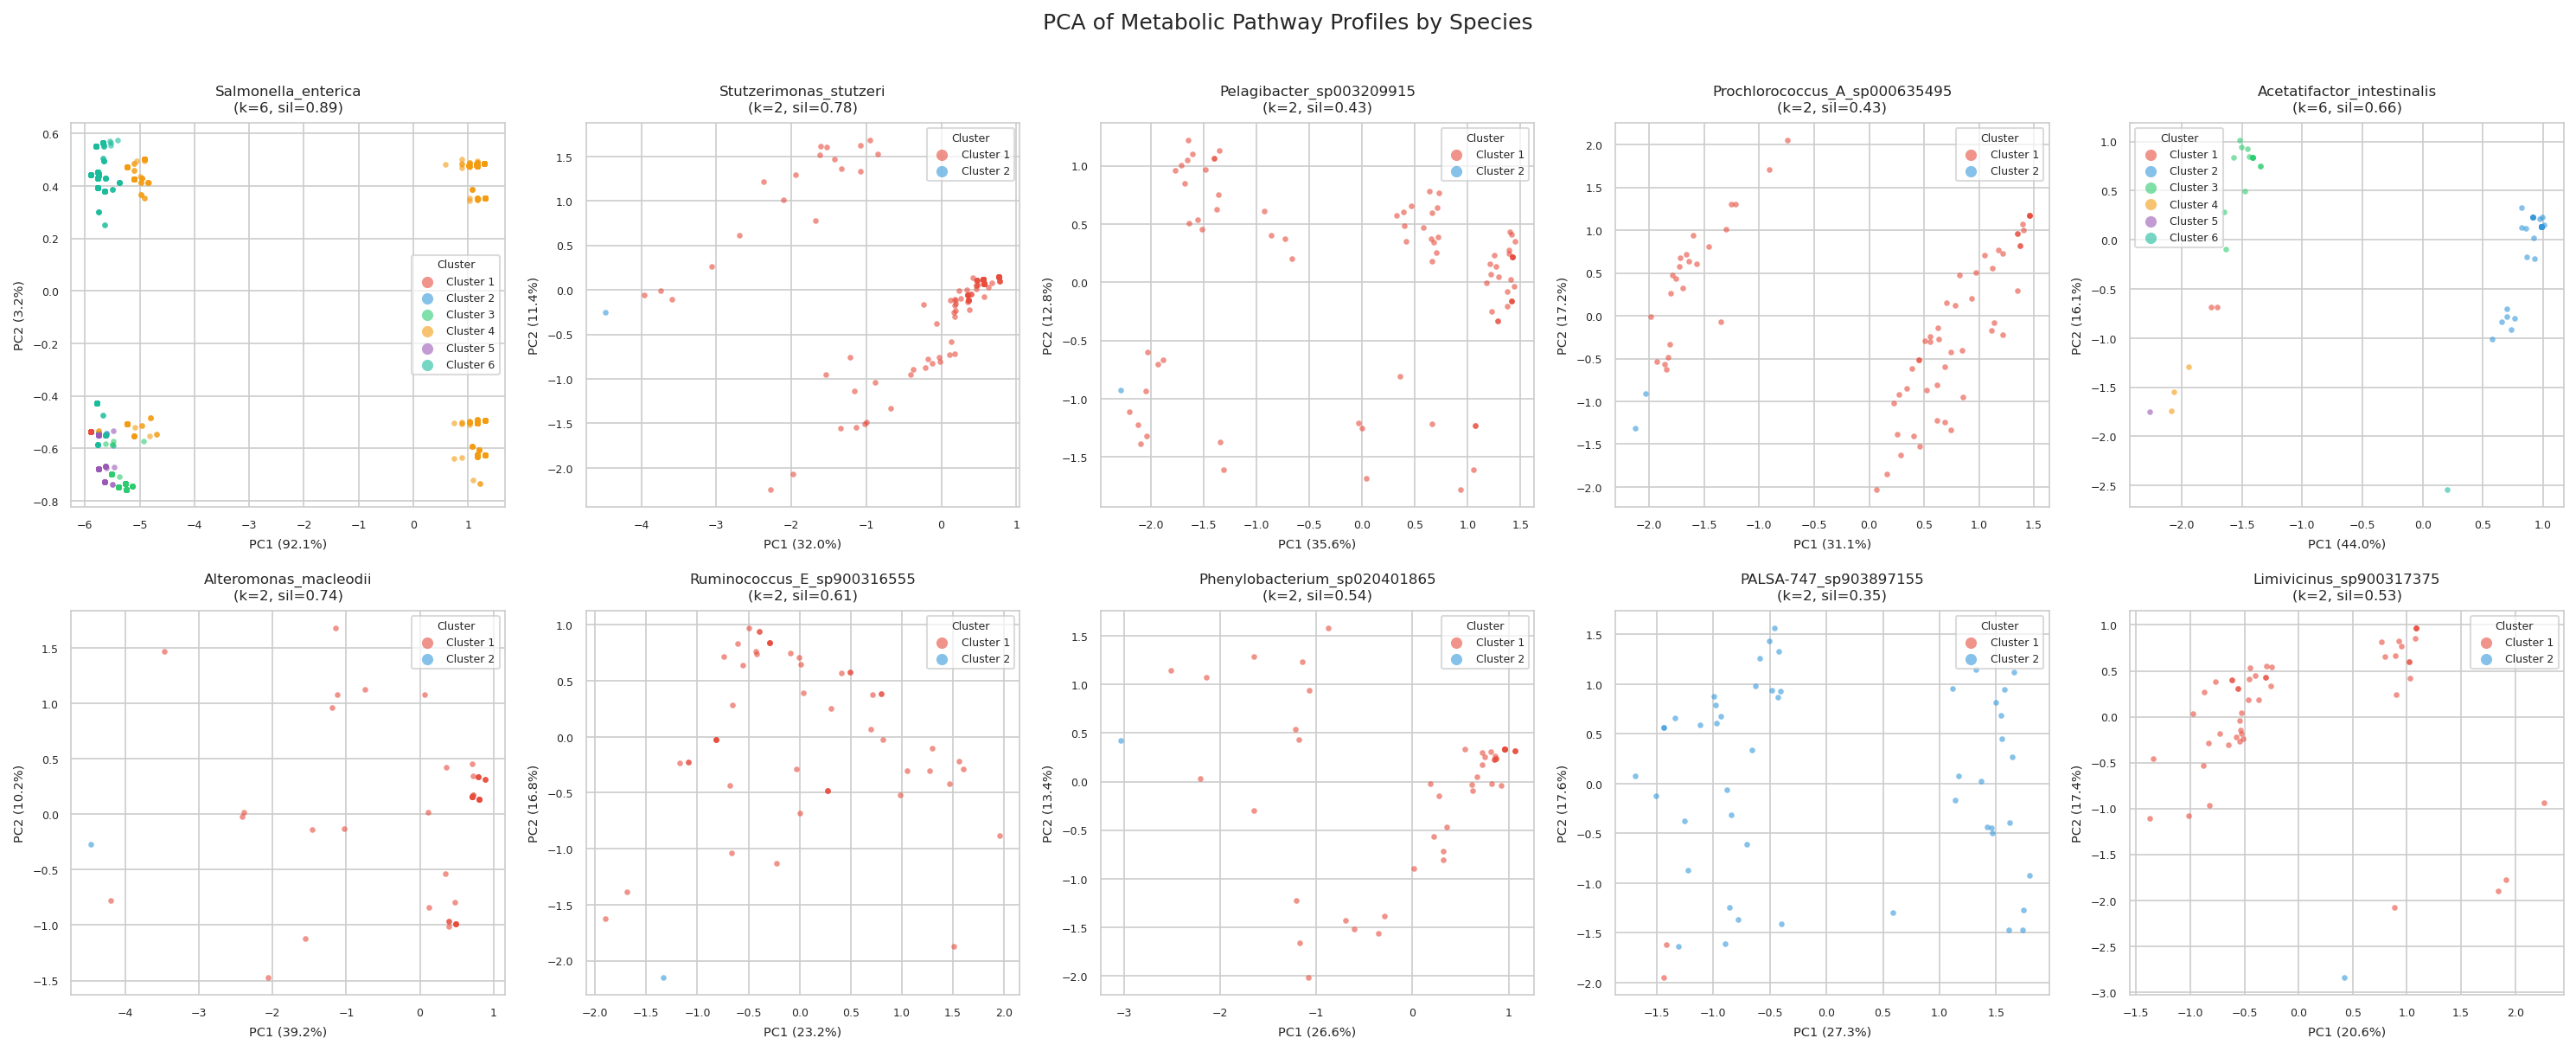
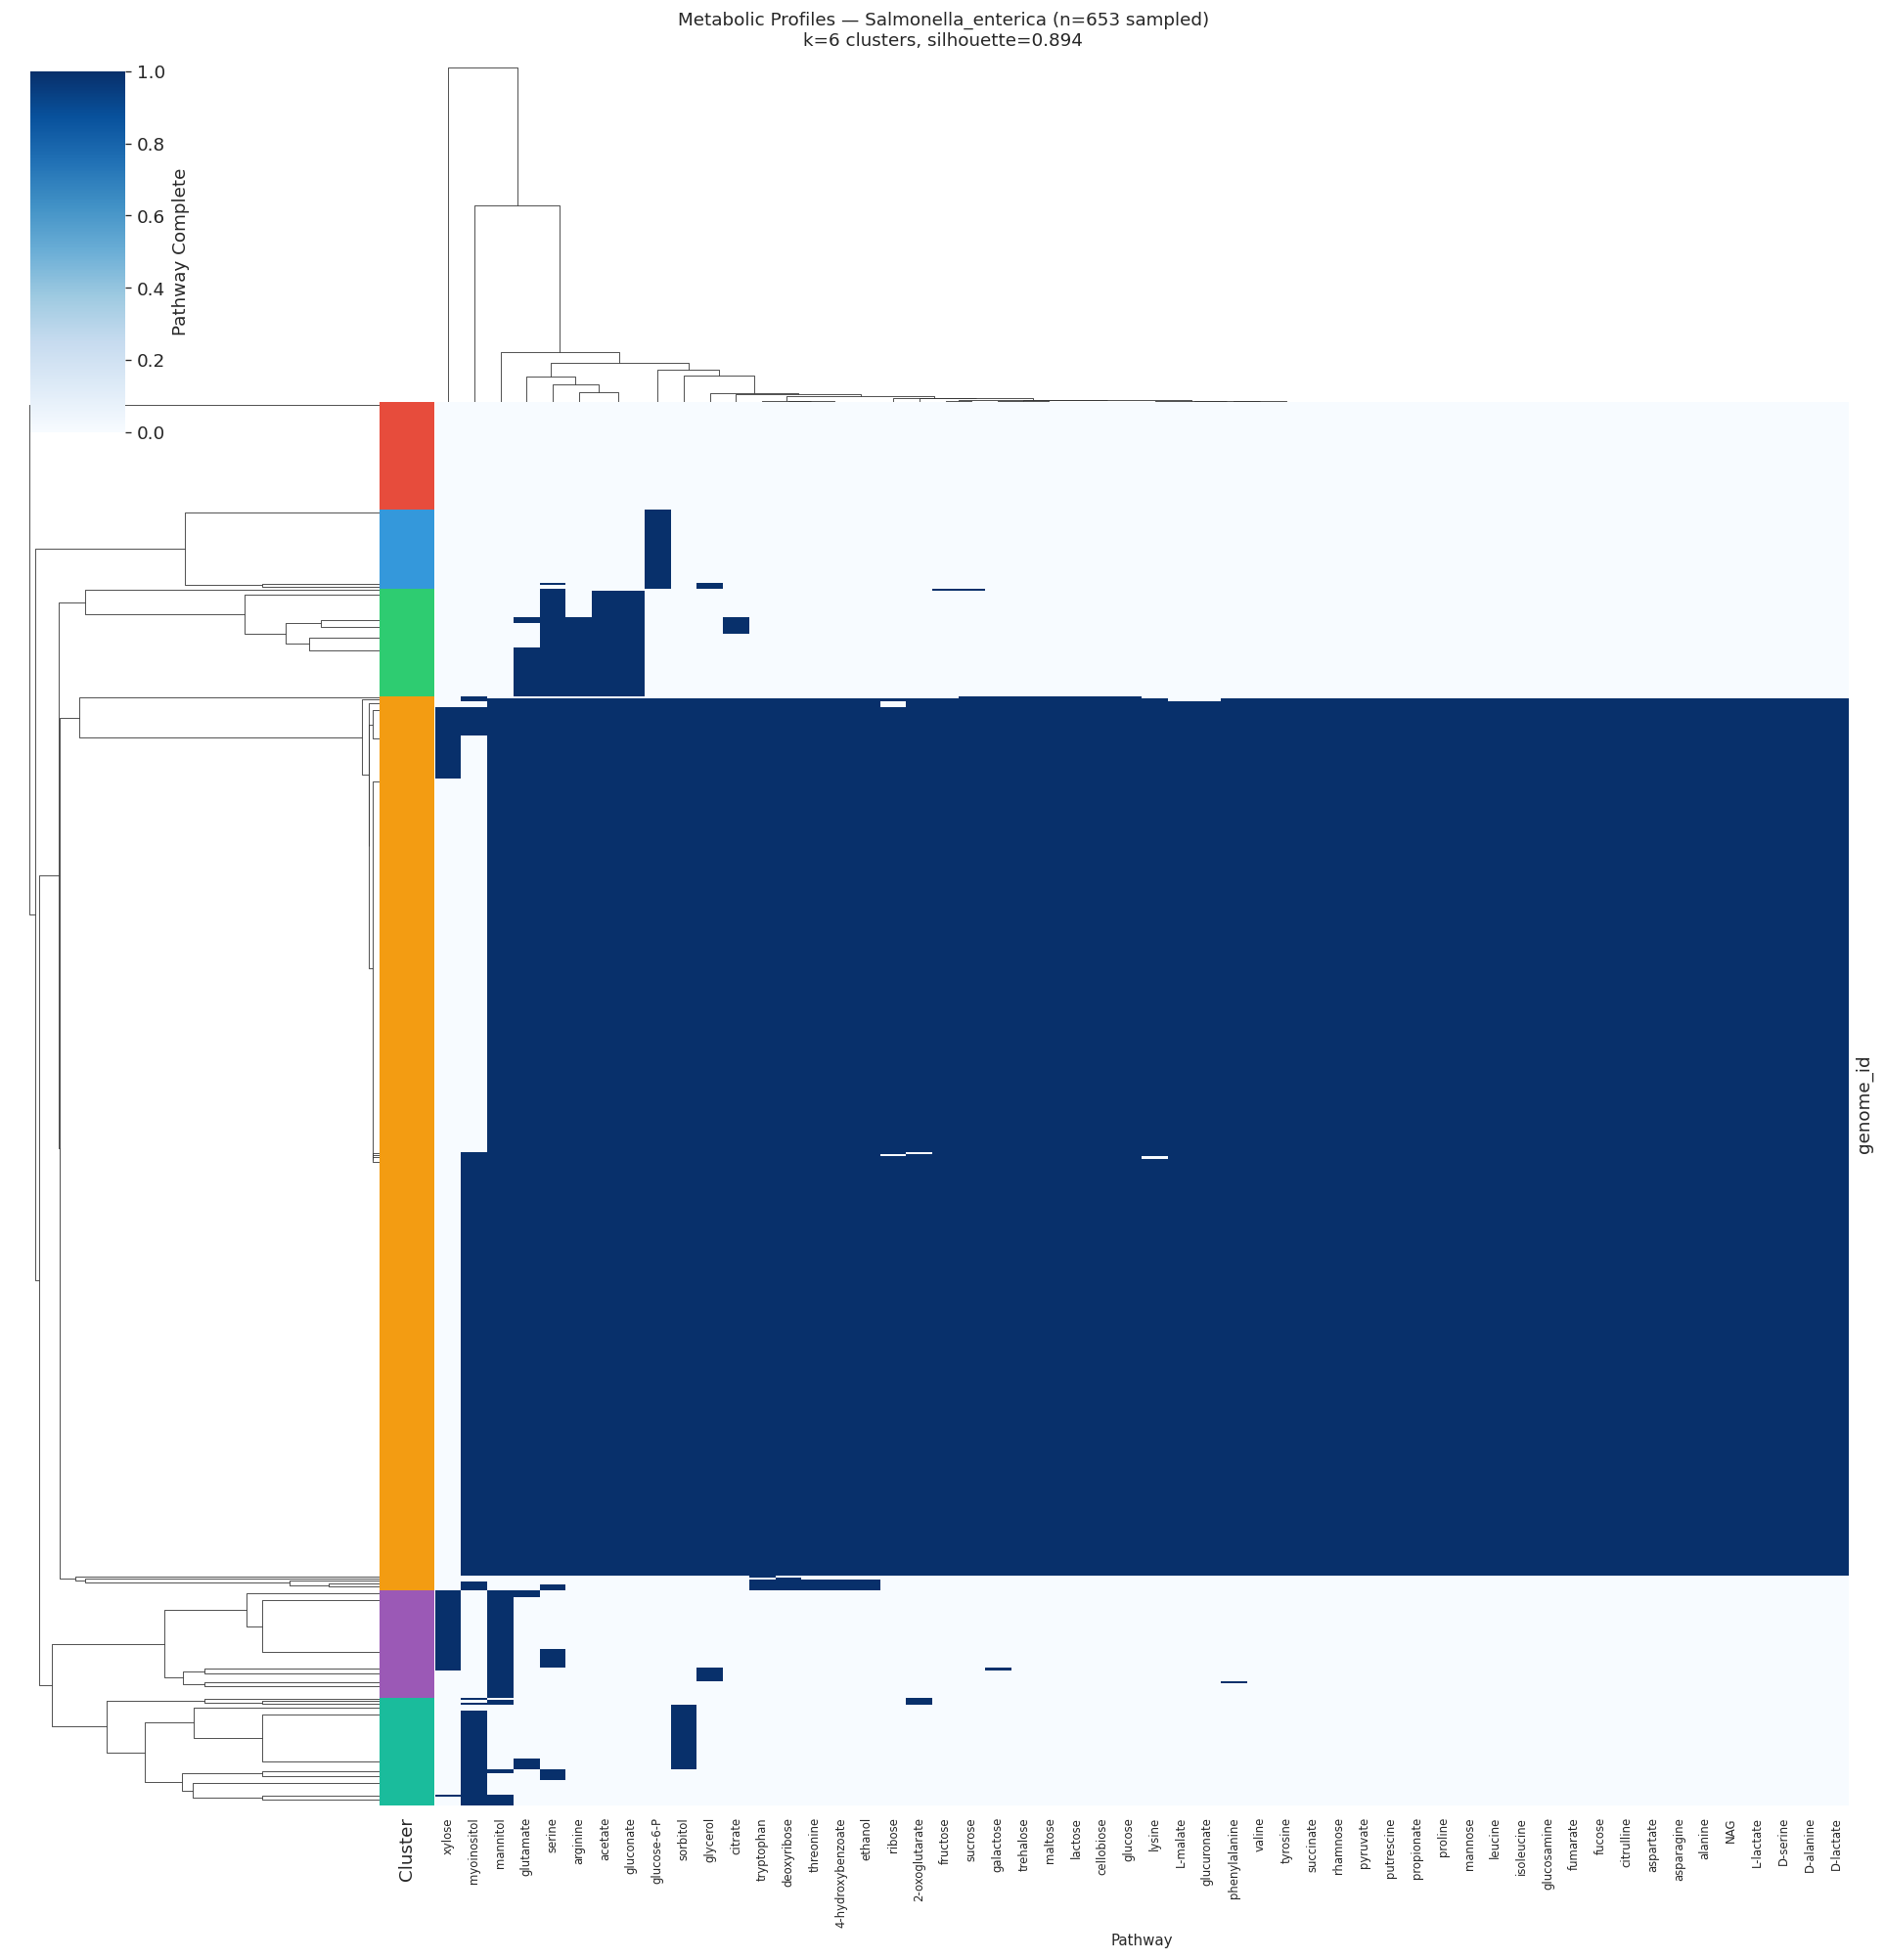
All 10 target species (≥50 genomes, ≥15 variable pathways) showed meaningful metabolic clustering (all silhouette scores > 0.2). Silhouette scores ranged from 0.35 (PALSA-747 sp.) to 0.89 (Salmonella enterica), indicating that some species have near-perfect metabolic separation while others show softer ecotype boundaries.
| Species | Genomes | Clusters (k) | Silhouette |
|---|---|---|---|
| Salmonella enterica | 11,396 | 6 | 0.894 |
| Stutzerimonas stutzeri | 149 | 2 | 0.780 |
| Alteromonas macleodii | 56 | 2 | 0.738 |
| Acetatifactor intestinalis | 59 | 6 | 0.657 |
| Ruminococcus E sp. | 53 | 2 | 0.609 |
| Phenylobacterium sp. | 51 | 2 | 0.544 |
| Limivicinus sp. | 50 | 2 | 0.528 |
| Pelagibacter sp. | 79 | 2 | 0.430 |
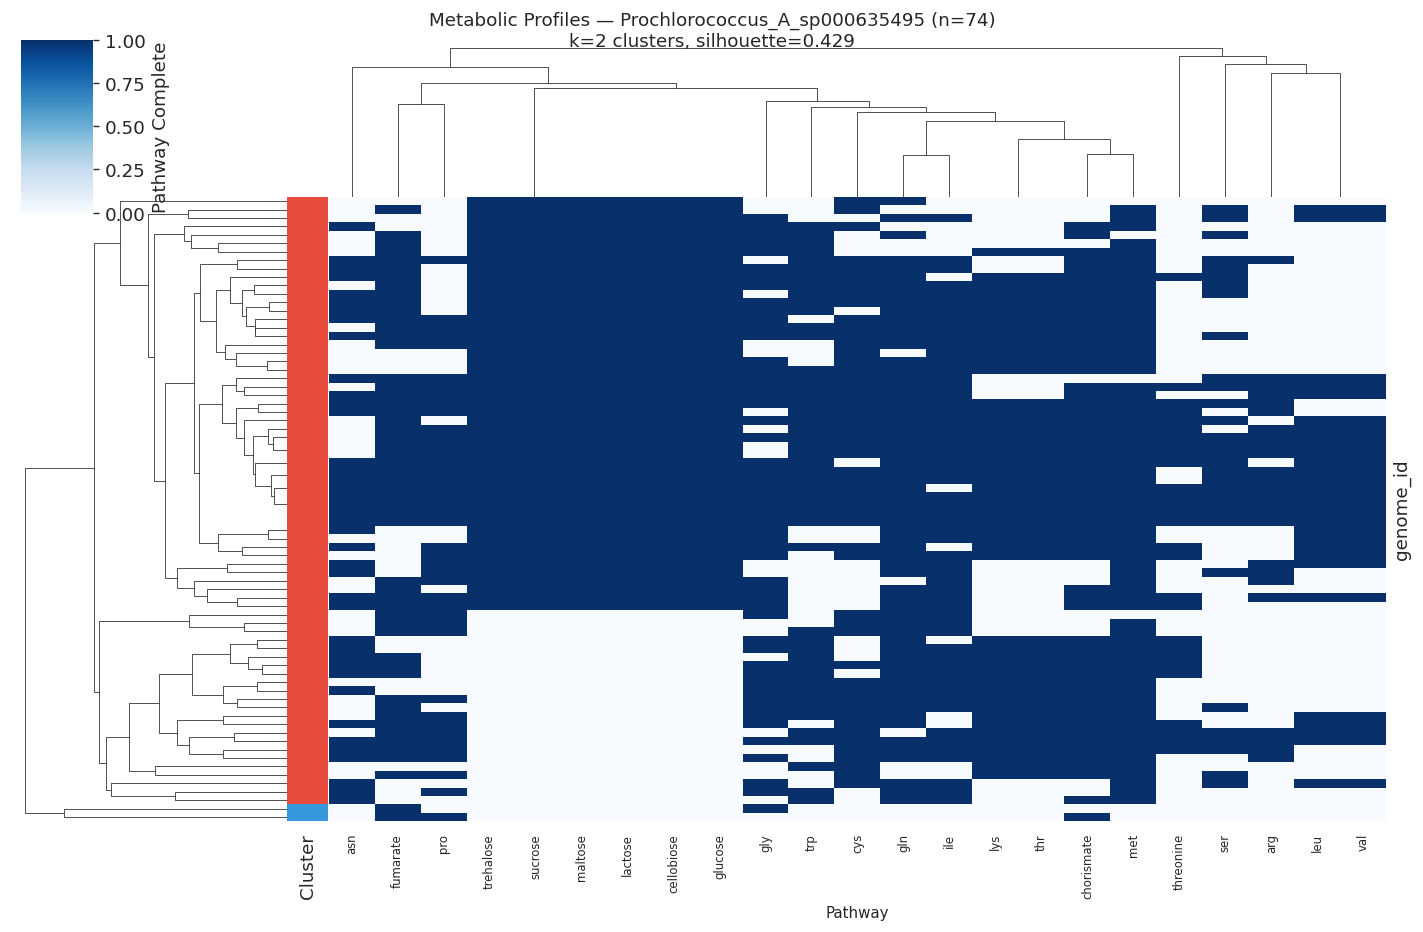
| Prochlorococcus A sp. | 74 | 2 | 0.429 |
| PALSA-747 sp. | 51 | 2 | 0.349 |
Metabolic clusters correlated significantly with isolation environment in Salmonella enterica (χ²=1570.2, df=25, p<0.0001) and Phenylobacterium sp. (χ²=12.2, df=1, p=0.0005), but not in marine organisms (Stutzerimonas, Alteromonas).
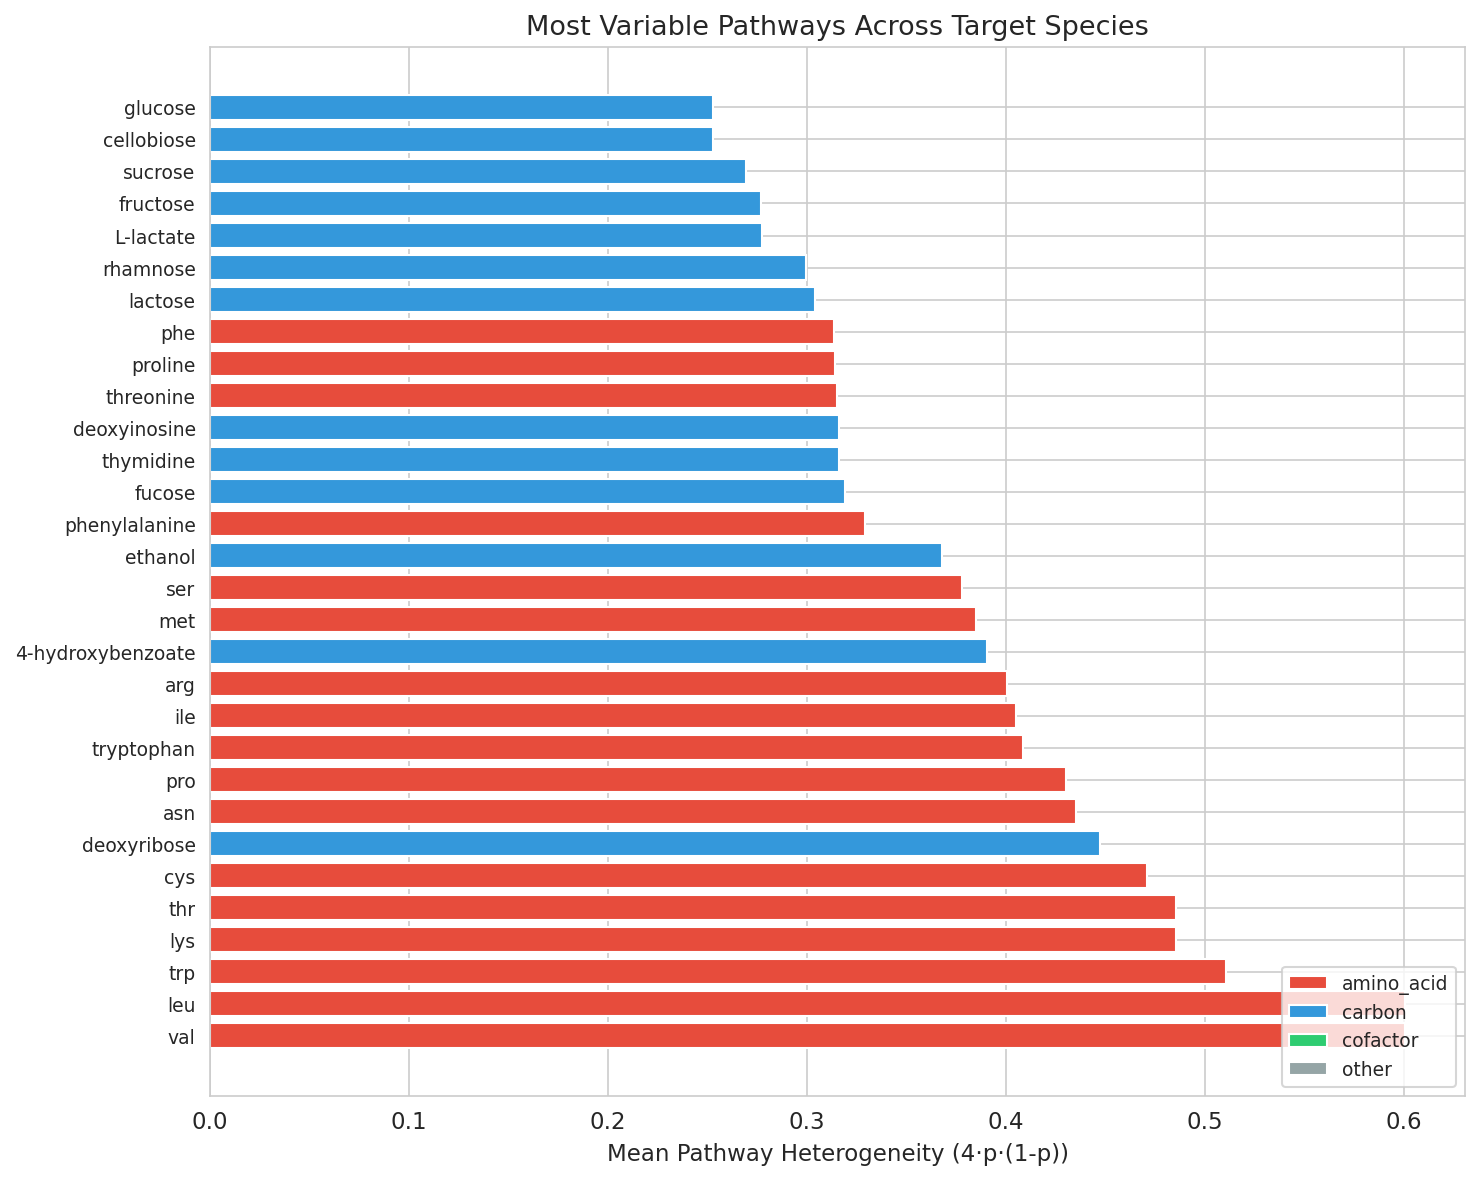
The most heterogeneous pathways across species were valine/leucine biosynthesis (heterogeneity=0.60), tryptophan (0.51), and lysine/threonine (0.49) — all amino acid biosynthesis pathways.
Selected heatmaps:
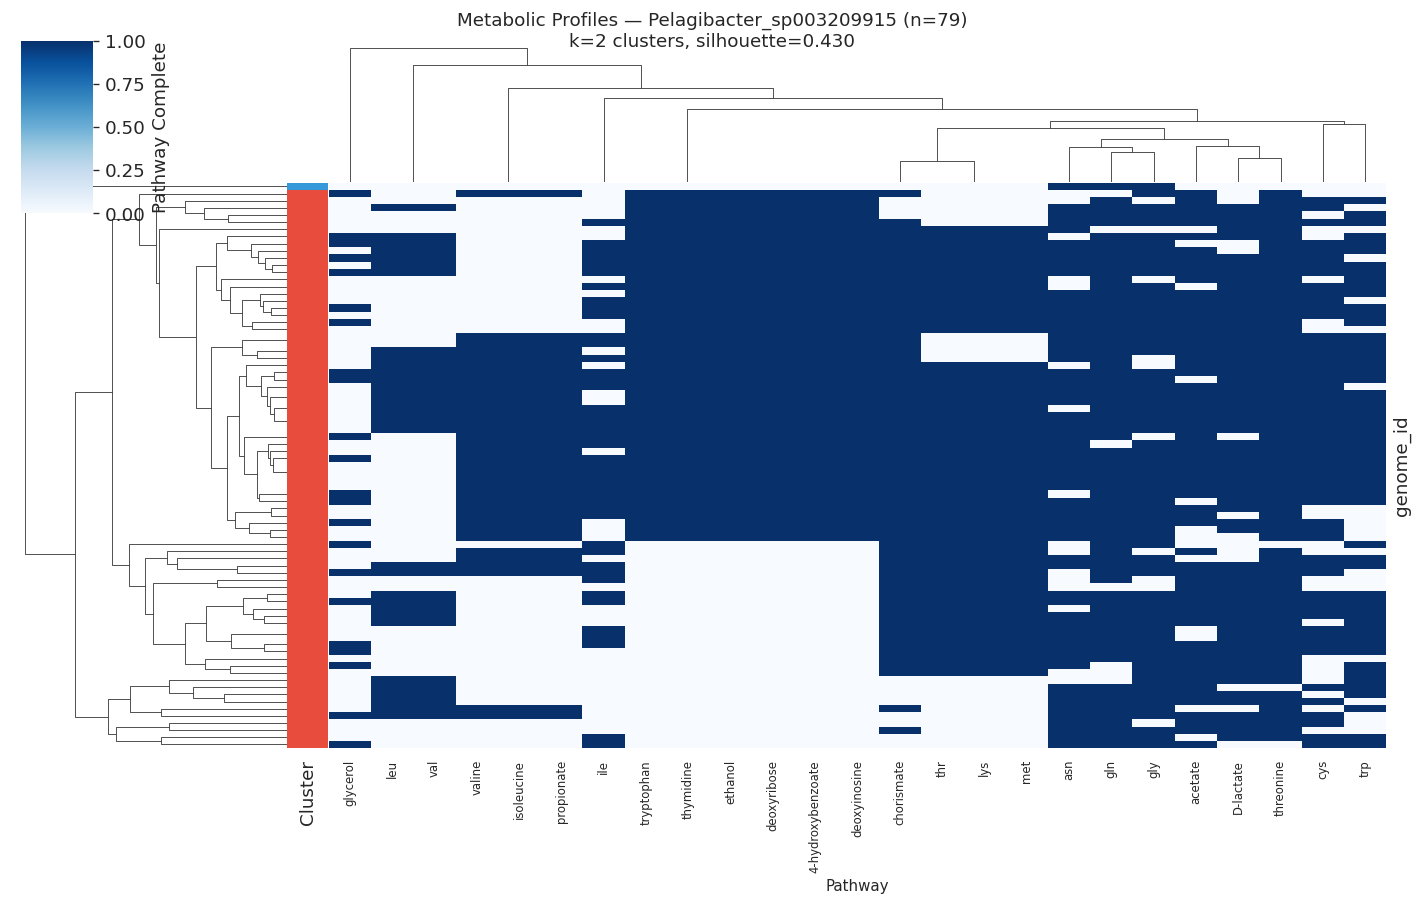
(Notebook: 05_metabolic_ecotypes.ipynb)
Results
Organism Coverage
Pathway fitness metrics were computed for 48 organisms from the Fitness Browser, spanning diverse proteobacteria, firmicutes, and other phyla. For each organism, SEED subsystem annotations were used as a proxy to map GapMind pathway members to Fitness Browser genes.
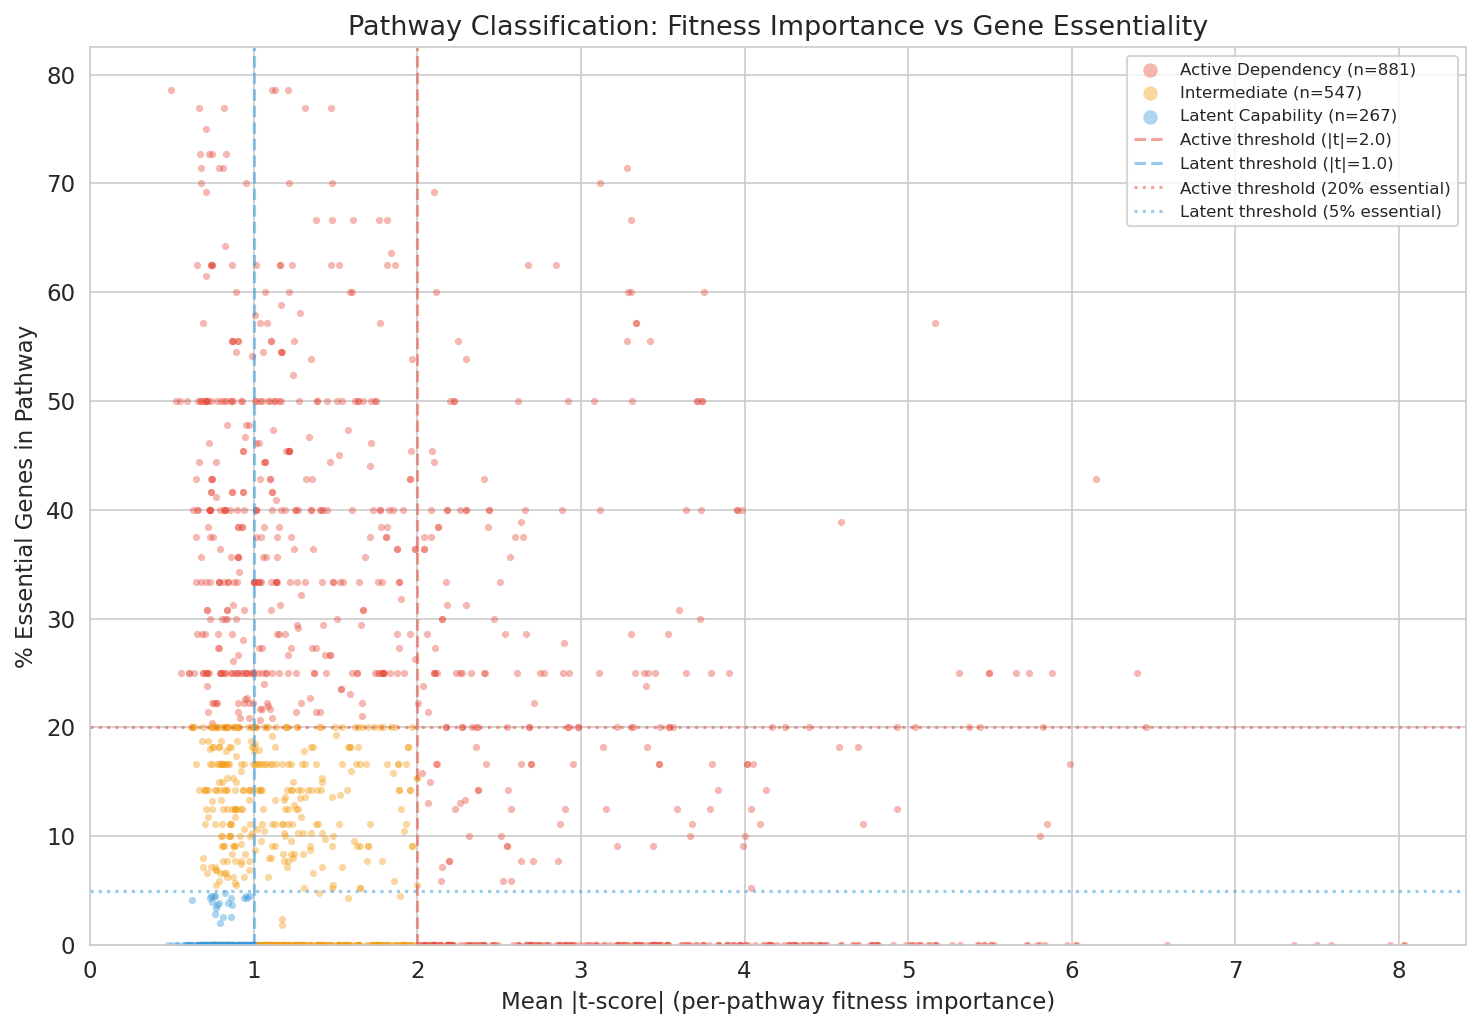
Classification Thresholds
Pathways were classified as:
- Active dependency: mean |t-score| > 2.0 OR >20% essential genes
- Latent capability: mean |t-score| < 1.0 AND <5% essential genes
- Intermediate: between thresholds
Threshold sensitivity: Varying the active threshold ±25% (1.5–2.5) and latent threshold ±25% (0.75–1.25), the latent fraction ranged from 4.7% to 21.1% (SD = 5.9 percentage points across 16 threshold combinations). At the default thresholds the result is 15.8%. The large intermediate zone (32.3%) means the latent fraction is moderately sensitive to threshold tightening. The qualitative conclusion — that a non-trivial fraction of complete pathways are fitness-neutral, with carbon pathways most affected — holds across the full range tested.
Pathway Category Breakdown
| Category | Active | Intermediate | Latent | Total |
|---|---|---|---|---|
| Amino acid biosynthesis | 467 (63.5%) | 220 (29.9%) | 48 (6.5%) | 735 |
| Carbon source utilization | 355 (39.8%) | 320 (35.9%) | 217 (24.3%) | 892 |
| Other | 59 (86.8%) | 7 (10.3%) | 2 (2.9%) | 68 |
| Total | 881 (51.9%) | 547 (32.3%) | 267 (15.8%) | 1,695 |
Pangenome Openness Context
Pangenome openness data was queried for 7,334 species from kbase_ke_pangenome.pangenome. Among well-sampled pathogens (>2,500 genomes), Klebsiella pneumoniae was most open (99.05% open; 0.95% core genes), while Mycobacterium tuberculosis was most closed (97.4% open; 2.6% core genes). Among 22 species clades with fitness data and matched pangenome data (41 organisms aggregated to unique clades), latent capability rate and pangenome openness were positively correlated (Spearman ρ = 0.69, p = 0.0004).
Excluded Pathways
Two GapMind pathways had no matching SEED subsystem role descriptions and are absent from all analyses: deoxyribonate and myoinositol. The full-name GapMind entries phenylalanine and tyrosine also lacked SEED coverage, but their 3-letter equivalents (phe and tyr) are present via abbreviation-based matching and are included. The pathway alanine appears in fitness metrics but was excluded from classification for all organisms due to fewer than 3 SEED-annotated genes meeting the minimum coverage threshold.
Interpretation
H1: Latent Capabilities Are Real and Pathway-Type Dependent
The 15.8% global latent fraction confirms that genomic completeness alone is an imperfect proxy for functional importance. The striking difference between carbon utilization (24.3% latent) and amino acid biosynthesis (6.5% latent) reflects the distinct selective pressures on these pathway types.
Amino acid biosynthesis pathways are largely essential: they supply fundamental building blocks, and organisms cannot simply scavenge all amino acids from the environment in all growth conditions tested. Carbon source utilization pathways, by contrast, are highly condition-dependent — a pathway for utilizing deoxyribose or ethanol may be encoded but never activated in a lab setting, making it appear latent even if ecologically important. This interpretation is consistent with Ramoneda et al. (2023), who found that amino acid auxotrophies are taxonomically widespread but concentrated in nutrient-rich environments (e.g., host-associated organisms), and with D'Souza et al. (2014), who showed that biosynthetic gene loss provides a ~13% fitness benefit when metabolites are available from neighbors.
H2: Mixed Results — Pangenome Openness Supports the Black Queen Framework; Pathway Conservation Does Not
The positive correlation between per-clade latent capability rate and pangenome openness (ρ = 0.69, p = 0.0004, n = 22 clades, H2b) provides clade-level support for the Black Queen framework: bacterial clades that carry more fitness-neutral complete pathways also have more dynamic pangenomes, consistent with ongoing streamlining. However, at the pathway level, conservation rates did not distinguish latent from active pathways (H2a). This divergence suggests that the Black Queen signal operates at the level of genome dynamics and community context, rather than being detectable in per-pathway cross-genome conservation ratios.
The failure to detect lower pathway-level conservation in latent capabilities likely also reflects methodological constraints:
-
Measurement granularity:
conservation_ratehere captures whether the pathway is complete in each genome in the species clade. This is a coarse measure — it does not detect partial gene erosion (individual gene deletions within an otherwise complete pathway). -
Species-level averaging: The fitness experiments cover only 48 organisms; many organisms in the same species clade may not have been fitness-tested, inflating apparent conservation of pathways that are "complete" but untested.
-
SEED-proxy noise: Mapping GapMind pathway membership via SEED subsystem annotations introduces false positives (genes in related subsystems) that dilute the fitness signal, potentially mis-classifying pathways that would otherwise differ in conservation.
-
Evolutionary lag: The Black Queen Hypothesis predicts ongoing gene loss, but the time frame over which this is detectable may exceed what current genome sampling captures. Latent capabilities may be mid-loss in some lineages, but still appear conserved at species level.
This contrasts with D'Souza et al. (2014) and Morris et al. (2012), who demonstrated gene loss in experimental and natural populations respectively. The discrepancy may reflect that the BERDL analysis operates at the species level across many taxa, while the Black Queen signal may be strongest within single evolving lineages or communities.
H3: Metabolic Ecotypes Are Widespread and Environment-Linked in Copiotrophs
The finding that all 10 target species form distinct metabolic ecotypes (silhouette > 0.2) demonstrates that within-species metabolic pathway heterogeneity is a general feature, not an exception. The strongest ecotype structure appeared in Salmonella enterica (silhouette=0.89, k=6), where clusters strongly correlated with clinical, food, and environmental isolation sources. This mirrors the well-established epidemiological serovars of Salmonella, and is consistent with Van Rossum et al. (2020), who highlighted strain-level metabolic differentiation in human microbiome species.
The non-significant environment-cluster association in marine organisms (Stutzerimonas, Alteromonas, Pelagibacter, Prochlorococcus) may reflect: (a) insufficient metadata resolution in NCBI isolation source fields for marine isolates; (b) metabolic clusters that track depth or nutrient zone rather than discrete source categories; or (c) that metabolic differences in these oligotrophs are driven by gene content differences that GapMind pathway annotations do not capture at the relevant resolution. Nowinski et al. (2023) found that ecological divergence in marine bacteria is shaped by gene content and expression — a signal that pathway-level clustering may partially miss.
The most variable pathways — valine/leucine (0.60), tryptophan (0.51), lysine/threonine (0.49) biosynthesis — represent pathways where some populations have retained biosynthetic independence while others have lost it, consistent with the ecological partitioning of amino acid dependencies observed by Ramoneda et al. (2023) across 26,277 bacterial genomes.
Literature Context
- H1 aligns with D'Souza et al. (2014), who showed biosynthetic gene loss carries a fitness benefit when metabolites are exogenously available, suggesting many "complete" pathways in nutrient-rich environments may already be functionally neutral.
- H1 aligns with Ramoneda et al. (2023), who mapped amino acid auxotrophies across >26,000 genomes using GapMind and found that auxotrophies cluster in nutrient-rich, host-associated environments — consistent with carbon-pathway latency in copiotrophic organisms.
- H2b aligns with Morris et al. (2012) (Black Queen Hypothesis), who proposed that gene loss in Prochlorococcus and Pelagibacter is driven by selection; the positive ρ = 0.69 correlation between latent fraction and pangenome openness (across 22 independent species clades) is consistent with this clade-level dynamic.
- H2a (pathway-level) aligns with Schakel et al. (2025), who showed that cross-feeding-based gene loss requires spatial structuring and is not straightforwardly predicted by the fitness cost of gene retention alone — consistent with why simple conservation-rate ratios do not discriminate latent from active pathways.
- H3 aligns with Tschoeke et al. (2020) (Prochlorococcus collective) and Nowinski et al. (2023), which both describe metabolic ecotypes within marine bacterial species defined by gene content differences — consistent with the pathway-based clustering observed here.
Novel Contribution
This analysis provides, to our knowledge, the first systematic quantification of the latent capability fraction — complete-but-fitness-neutral pathways — across a diverse set of bacterial species using genome-wide fitness data. The finding that carbon source utilization pathways are 3.7× more likely to be latent than amino acid biosynthesis pathways (24.3% vs 6.5%) is a specific, testable prediction: organisms in nutrient-rich environments should disproportionately lose carbon-pathway genes over evolutionary time, while amino acid biosynthesis genes are retained under stronger purifying selection.
Limitations
- SEED-proxy pathway mapping introduces noise; a direct gene-to-pathway mapping (using GapMind gene assignments) would improve precision.
- Fitness experiments are biased toward laboratory conditions: lab media may not reflect the full range of conditions under which pathways are expressed, inflating the latent fraction.
- Conservation measurement is pathway-level, not gene-level: cannot detect partial pathway erosion or progressive gene loss within a pathway.
- Ecotype analysis is observational: the environment-cluster correlations in Salmonella and Phenylobacterium suggest causal links to ecological selection, but confounding by phylogenetic structure is possible without explicit phylogenetic correction.
- 48-organism fitness coverage is a small fraction of the 293,000 genomes with pathway predictions; results may not generalize to all taxonomic groups.
- NB02 organism-to-clade taxonomy matching failed: an attempt to link Fitness Browser organisms to GapMind species clades via NCBI taxonomy IDs from
kbase_ke_pangenome.gtdb_metadatareturned zero matches because the relevant column contained boolean strings rather than numeric taxids. Downstream analyses therefore use organism-level fitness aggregates without an explicit clade-level linkage, which may reduce the precision of the H2a conservation comparison.
Future Directions
- Gene-level conservation analysis: Replace pathway-level conservation with per-gene dN/dS or gene presence/absence across a phylogeny to directly test the Black Queen prediction of progressive gene loss.
- Direct GapMind gene mapping: Use GapMind's per-step gene assignments (rather than SEED-proxy) to improve pathway-to-fitness mapping precision and reduce false positives.
- Longitudinal validation: Identify lineages with recent gene loss events (singletons or auxiliary genes in pangenome) in pathways classified as latent, and verify that these represent actual deletion events in the phylogeny.
- Environmental metadata enrichment: Supplement NCBI isolation source with trait databases (e.g., BacDive, GTDB environmental labels) to improve resolution of the ecotype-environment association test.
- Cross-species latency patterns: Test whether organisms with higher latent fractions are more likely to encode public-goods pathways or co-occur with cross-feeding partners in community datasets.
Data
Sources
| Collection | Tables Used | Purpose |
|---|---|---|
kbase_ke_pangenome |
gapmind_pathways, pangenome, gtdb_metadata |
Pathway completeness predictions (305M rows, 80 pathways, 293K genomes); pangenome openness; NCBI taxonomy for organism matching |
kescience_fitnessbrowser |
genefitness, gene, seedannotation |
Gene-level fitness scores (48 organisms); essentiality inference; SEED subsystem proxy for pathway membership |
Generated Data
| File | Rows | Description |
|---|---|---|
data/gapmind_genome_pathways.csv |
23,424,480 | Per-genome pathway completeness (genome_id, species, pathway, best_score, is_complete) |
data/gapmind_species_summary.csv |
27,690 | Per-species pathway statistics |
data/pathway_fitness_metrics.csv |
3,065 | Per-(organism, pathway) fitness aggregates from SEED-proxy mapping |
data/pathway_classification.csv |
1,695 | Dependency class assignments (active/intermediate/latent) |
data/pathway_conservation.csv |
1,511 | Per-pathway conservation rates in species clade |
data/pangenome_openness.csv |
7,334 | Species-level pangenome openness metrics |
data/pathway_heterogeneity.csv |
800 | Per-(species, pathway) heterogeneity scores for 10 target species |
data/metabolic_ecotypes.csv |
12,018 | Genome cluster assignments with PCA coordinates |
data/ecotype_cluster_summary.csv |
10 | Clustering quality (silhouette, k) per species |
data/pathway_cluster_signatures.csv |
370 | Pathway markers distinguishing each ecotype (chi-square, Bonferroni-corrected p-values, rate range per cluster) |
References
-
Morris JJ, Lenski RE, Zinser ER. (2012). "The Black Queen Hypothesis: evolution of dependencies through adaptive gene loss." mBio 3(2):e00036-12. DOI: 10.1128/mBio.00036-12
-
D'Souza G, Waschina S, Pande S, Bohl K, Kaleta C, Kost C. (2014). "Less is more: selective advantages can explain the prevalent loss of biosynthetic genes in bacteria." Evolution 68(9):2559-2570. PMID: 24910088
-
Price MN, Wetmore KM, Waters RJ, Callaghan M, Liu H, Kuehl JV, et al. (2018). "Mutant phenotypes for thousands of bacterial genes of unknown function." Nature 557:503–509. DOI: 10.1038/s41586-018-0124-0
-
Price MN, Deutschbauer AM, Arkin AP. (2022). "Filling gaps in bacterial catabolic pathways with computation and high-throughput genetics." PLoS Genetics 18(4):e1010156. DOI: 10.1371/journal.pgen.1010156
-
Price MN, Shiver AL, Day LA, Torres M, Lesea HP, et al. (2024). "Improving the annotation of amino acid biosynthesis pathways: GapMind 2024." bioRxiv. DOI: 10.1101/2024.10.14.618325
-
Price MN, Arkin AP. (2024). "Interactive tools for functional annotation of bacterial genomes." Database baae089. DOI: 10.1093/database/baae089
-
Ramoneda J, Jensen TBN, Price MN, et al. (2023). "Taxonomic and environmental distribution of bacterial amino acid auxotrophies." Nature Communications 14:7608. DOI: 10.1038/s41467-023-43435-4
-
Van Rossum T, Ferretti P, Maistrenko OM, et al. (2020). "Diversity within species: interpreting strains in microbiomes." Nature Reviews Microbiology 18:491–506. DOI: 10.1038/s41579-020-0368-1
-
Nowinski B, Feng X, Preston CM, Birch JM, et al. (2023). "Ecological divergence of syntopic marine bacterial species is shaped by gene content and expression." ISME Journal 17:813–823. DOI: 10.1093/ismej/wrad008
-
Behringer MG, Ho WC, Meraz JC, et al. (2022). "Complex Ecotype Dynamics Evolve in Response to Fluctuating Resources." mBio 13(2):e03467-21. PMID: 35575545
-
Schakel OF, Fritts RK, Zmuda AJ, et al. (2025). "Microbial cross-feeding stabilized by segregation of a dependent mutant from its independent ancestor." ISME Journal wraf131. PMID: 40568968
-
Tschoeke D, Salazar VW, Vidal L, et al. (2020). "Unlocking the Genomic Taxonomy of the Prochlorococcus Collective." Microbial Ecology 82:41–53. DOI: 10.1007/s00248-020-01526-5
Data Collections
Derived Data
This project builds on processed data from other projects.
Review
Summary
This is a well-executed project with a compelling biological question: can genome-scale metabolic predictions (GapMind) and genome-wide fitness data (RB-TnSeq) be combined to distinguish pathways that are genuinely used from those that are merely encoded? The project meets its stated minimum viable goals — pathway classification for 48 organisms, demonstration of a non-trivial latent fraction (15.8%), and organism-level support for the Black Queen Hypothesis (Spearman ρ=0.57). Documentation is excellent: all five notebooks have saved outputs, all 17 data files and 17 figures listed in the REPORT are present, and the three-document structure (README / RESEARCH_PLAN / REPORT) is cleanly maintained. The work productively acknowledges a key data challenge (the gtdb_metadata NCBI taxid column returns boolean strings, not taxids), recorded it in docs/pitfalls.md, and implemented a name-matching fallback. There are, however, a methodological concern about the completeness filter not being applied uniformly, a statistical non-independence issue in the H2b correlation, and a minor categorization bug in src/pathway_utils.py that warrant attention before the findings are cited externally.
Methodology
Research question: Clearly stated and testable at each level (H1: latent capabilities exist; H2: Black Queen dynamics; H3: metabolic ecotypes). The hypothesis decomposition into H2a (pathway-level conservation) vs H2b (organism-level openness) is thoughtful and shows the researchers anticipated a null at one level before seeing the data.
Approach:
- Using SEED subsystem keyword matching as a proxy for GapMind pathway membership is pragmatic and well-documented. The four pathways excluded due to zero SEED matches (phenylalanine, tyrosine, deoxyribonate, myoinositol) are explicitly listed.
- The choice to use per-organism fitness aggregates (mean |t-score|, % essential) rather than per-experiment scores is appropriate for the pathway-level question.
- NB01 batching 80 single-pathway queries to stay under Spark's driver result size limit (rather than pulling all 23M rows at once) is a technically sound engineering decision, consistent with lessons from pitfalls.md.
Data sources: All six source tables are named and described. The 23.4M-row gapmind extract is validated in-notebook (80 pathways × 292,806 genomes; score categories confirmed).
Reproducibility: The README ## Reproduction section clearly distinguishes Spark notebooks (NB01, NB02, NB04) from local notebooks (NB03, NB05). Runtime estimates are provided. Prerequisites for re-running are explicit.
Concern — GapMind completeness filter applied inconsistently (moderate):
The RESEARCH_PLAN specifies classifying "each organism-pathway pair with complete GapMind prediction." In practice, the taxid join to gtdb_metadata returned 0 matches (documented in pitfalls.md and RESEARCH_PLAN), and the fallback name-matching linked 33 of 48 organisms to a GapMind clade. The 15 unmatched organisms were still classified based on fitness data, without confirming that the pathway is predicted complete in their genome. For pathways that are genuinely absent or incomplete in an organism's genome, the fitness signal would correctly be near-zero — but this would be classified as "latent capability" rather than "pathway absent." The REPORT's Limitations section acknowledges the failed taxonomy match but does not explicitly flag that the completeness filter was non-uniform across organisms. The stated 15.8% latent fraction likely includes some fraction of pathways that are genomically incomplete in the 15 unmatched organisms.
Code Quality
SQL correctness: The NB01 query correctly takes MAX(score_value) per (genome_id, species, pathway) to handle GapMind's multi-row structure. This is the pattern documented in pitfalls.md for [pangenome_pathway_geography] and is applied correctly here. Score category names are verified against live data in NB01.
Statistical methods: Chi-square test (NB03: H1), Mann-Whitney U and rank-biserial effect size (NB04: H2a), Spearman correlation (NB04: H2b), Kruskal-Wallis (NB03, NB04), and chi-square with Bonferroni correction (NB05: pathway signatures) are all appropriate choices. Tests are run in the notebook and results propagate faithfully to the REPORT.
Notebook organization: Each notebook follows a logical setup → query → analysis → visualization flow and ends with a completion cell listing outputs and the next step. This is exemplary.
Pitfall awareness: The get_spark_session() import is handled correctly (uses the JupyterHub kernel global with a NameError fallback to module import). The GTDB prefix-stripping in NB05's environment query (REGEXP_REPLACE(m.accession, '^(GB_|RS_)', '')) correctly addresses the ID format mismatch documented in pitfalls.md. Numeric casting (np.int8 dtypes on load) avoids the string-comparison pitfall for the large CSV.
Bug — categorize_pathway() misclassifies D-alanine and D-serine (moderate):
In src/pathway_utils.py (lines 182–188), the amino_acid detection list includes substring patterns 'ala' and 'ser'. The GapMind pathways D-alanine (D-alanine catabolism, a carbon source pathway) and D-serine (D-serine catabolism, a carbon source pathway) both contain these substrings and are therefore tagged amino_acid instead of carbon. These two pathways appear in PATHWAY_SEED_KEYWORDS under the carbon section in NB02 (D-alanine, D-serine), confirming the intended category. This affects approximately 2 × 48 = 96 records (~5.7% of the 1,695 classified records, and ~9% of amino_acid records). The misclassification moves carbon-like pathways (which tend to be more latent) into the amino_acid category, slightly inflating the amino_acid latent rate and deflating the carbon latent rate. The chi-square result is likely still significant given the magnitude (χ²=144), but the category-specific percentages in the REPORT (amino_acid: 9.5% latent; carbon: 33.1% latent) should be recomputed after fixing this.
Issue — Threshold sensitivity analysis overstates combinations tested (minor):
NB03's threshold sensitivity table (the cell with id jijejlobu3) shows that the latent fraction is completely insensitive to the active threshold (all 5 active_t rows are identical). This is mathematically correct: a record classified as "latent" requires mean_abs_t < latent_t AND pct_essential < 5%, and since latent_t < active_t always, the active threshold cannot affect the latent count. The REPORT describes "16 threshold combinations" and an SD of 5.9 percentage points, which is technically accurate (20 combinations minus 4 invalid ones, all active_t values redundant), but characterizing this as a 4×4 sensitivity grid overrepresents the number of degrees of freedom explored. There are effectively only 5 distinct outcomes (one per latent_t value). This does not change the main conclusion but the framing should be corrected.
Minor — Gene count threshold differs from plan:
NB02 uses MIN_SEED_GENES = 3 and NB03 uses MIN_GENES_FOR_CLASSIFICATION = 3 for n_with_fitness. The RESEARCH_PLAN specifies "Require ≥5 genes per pathway for classification." The lower threshold increases organism-pathway coverage but may include noisier measurements from small gene sets. The deviation is not discussed in the REPORT.
Minor — Two notebook cells have truncated outputs:
NB02 cells 18 (DESCRIBE kbase_ke_pangenome.gtdb_metadata + sample rows) and 23 (full pathway metrics sample) are flagged as "Outputs are too large to include." Replacing the full .to_string() output with .head(5).to_string() in those cells would preserve the notebook as a self-contained audit trail.
Findings Assessment
H1 (Latent capabilities exist): Well-supported. The 15.8% global latent fraction is robust to the threshold sensitivity analysis (range: 4.7–21.1%). The chi-square test (χ²=144.1, df=4, p=3.66×10⁻³⁰) is highly significant and the notebook output matches the REPORT table exactly. The carbon vs amino_acid category difference (33.1% vs 9.5% latent) is the central finding and is biologically interpretable.
H2 (Black Queen Hypothesis): The split treatment is appropriate. H2a (pathway-level conservation) is correctly reported as not supported (Mann-Whitney p=0.94). H2b (organism-level pangenome openness) is reported as supported (Spearman ρ=0.57, p=0.0005). The NB04 output confirms these numbers exactly. However, the H2b correlation has a non-independence problem that is not acknowledged:
Concern — H2b Spearman correlation: non-independent data points (moderate):
Multiple FB organisms map to the same GapMind species clade and therefore share an identical pangenome openness value. From the NB04 output table: Ddia6719 and DdiaME23 both map to s__Dickeya_dianthicola (openness=61.18); RalstoniaBSBF1503, RalstoniaGMI1000, RalstoniaUW163, and RalstoniaPS107 all map to s__Ralstonia_solanacearum (openness=83.25); Methanococcus_JJ and Methanococcus_S2 map to the same clade (openness=67.96); and five Pseudomonas fluorescens strains share s__Pseudomonas_E_fluorescens_E (openness=47.36). Of 33 data points, at least 15 share their openness value with one or more other organisms. This violates the independence assumption of the Spearman test, inflating apparent significance. The correlation may still be real, but the p-value of 0.0005 is optimistic. Aggregating to one latent-rate estimate per clade (e.g., the median across strains from that clade) before computing the correlation would give a more conservative and defensible test.
H3 (Metabolic ecotypes): Well-supported. All 10 species show silhouette > 0.2; the environment-cluster associations for Salmonella (χ²=1570.2, p<0.0001) and Phenylobacterium (χ²=12.2, p=0.0005) are strong. The non-significant results in marine species (Stutzerimonas p=0.99, Alteromonas p=1.0) are honestly reported. The REPORT correctly notes that Pelagibacter and Prochlorococcus results are not explicitly shown in the chi-square output (too few records with isolation source metadata), and attributes this to metadata sparsity rather than overclaiming. The pathway signature table (Bonferroni-corrected chi-square per cluster) is a nice addition.
Conclusions vs data: All numerical claims in the REPORT are directly verifiable from notebook outputs. The interpretation is appropriately cautious, particularly the H2a null result and the discussion of SEED-proxy noise as a likely contributor. Future directions are specific and actionable.
Limitations: The REPORT's Limitations section is notably thorough — it explicitly names the SEED-proxy issue, lab-condition bias in fitness data, pathway-level (vs gene-level) conservation measurement, observational ecotype analysis, the small fitness-tested fraction of 293K genomes, and the failed taxid matching. The only missing limitation is the non-independence of the H2b correlation (see above).
Suggestions
-
[High priority] Rerun H2b correlation with clade-aggregated data. Group the 33 matched organisms by their
clade_name, compute the median latent rate per clade, and re-run the Spearman test on the resulting ~18–20 independent points. This corrects the non-independence issue and gives a defensible p-value. Update NB04 and the REPORT accordingly. If the correlation remains significant, this actually strengthens the claim. If it drops to p>0.05, the H2b conclusion must be revised. -
[High priority] Add a completeness filter in NB03 for organisms with clade matches. For the 33 organisms with
clade_name, filter pathway-organism pairs to those wherespecies_completion_rate >= 0.50(or another documented threshold) before classification. For the 15 unmatched organisms, acknowledge in the REPORT that completeness could not be confirmed. This tightens the H1 estimate and makes the "latent capability" label biologically accurate (pathway is genomically complete but fitness-neutral). -
[Medium priority] Fix
categorize_pathway()insrc/pathway_utils.py. The substring matching is fragile for abbreviated amino acid names. Either: (a) switch to an exact-match whitelist for each category, keyed against the actual GapMind pathway name list from NB01; or (b) add an explicit override dict placingD-alanine,D-serine(and any others that may be affected) into thecarboncategory. After the fix, re-run NB03 and update the REPORT tables and chi-square. -
[Medium priority] Correct the threshold sensitivity framing. In the REPORT, replace "16 threshold combinations" with "5 effective latent-threshold levels" and note explicitly that the active threshold (which controls the intermediate/active boundary) does not alter the latent count. This is a factual clarification, not a change to the main result.
-
[Low priority] Cap or summarize oversized cell outputs in NB02. For cells 18 and 23, replace the full DataFrame
.to_string()output with.head(10)or a summary (e.g.,print(df.describe())) so the notebook output is viewable without the "Outputs are too large to include" truncation message. -
[Low priority] Document the MIN_SEED_GENES = 3 choice. Add a comment or markdown cell in NB02 noting the deviation from the RESEARCH_PLAN's ≥5 threshold and the rationale (e.g., ≥5 would drop too many organism-pathway pairs given the sparse SEED coverage for some pathways). This keeps the project's audit trail complete.
-
[Low priority] Add Lexi note about D-serine and D-alanine to NB05 pathway heterogeneity context. The two pathways currently appear in the amino_acid category in the heterogeneity figure, but their high heterogeneity scores may reflect their nature as condition-specific carbon sources (like
deoxyribose) rather than amino acid biosynthesis. A sentence in the NB05 markdown noting this would help readers interpret the figure correctly.
This review was generated by an AI system. It should be treated as advisory input, not a definitive assessment.
Visualizations
Nb03 Organism Overview
Nb03 Scatter
Nb03 Stacked Bar
Nb04 Conservation Boxplot
Nb04 Conservation Cdf
Nb04 Openness Scatter
Nb05 Heatmap Acetatifactor Intestinalis
Nb05 Heatmap Alteromonas Macleodii
Nb05 Heatmap Limivicinus Sp900317375
Nb05 Heatmap Palsa-747 Sp903897155
Nb05 Heatmap Pelagibacter Sp003209915
Nb05 Heatmap Phenylobacterium Sp020401865
Nb05 Heatmap Prochlorococcus A Sp000635495
Nb05 Heatmap Ruminococcus E Sp900316555
Nb05 Heatmap Salmonella Enterica
Nb05 Heatmap Stutzerimonas Stutzeri
Nb05 Pathway Heterogeneity
Nb05 Pca All Species
Notebooks
01_data_extraction.ipynb
01 Data Extraction
View notebook →
01_extract_gapmind_pathways.ipynb
01 Extract Gapmind Pathways
View notebook →
02_map_pathways_to_fitness.ipynb
02 Map Pathways To Fitness
View notebook →
02_pathway_gene_linking.ipynb
02 Pathway Gene Linking
View notebook →
03_classify_pathway_dependencies.ipynb
03 Classify Pathway Dependencies
View notebook →
03_pathway_classification.ipynb
03 Pathway Classification
View notebook →
04_black_queen_test.ipynb
04 Black Queen Test
View notebook →
04_cross_species_patterns.ipynb
04 Cross Species Patterns
View notebook →
05_metabolic_ecotypes.ipynb
05 Metabolic Ecotypes
View notebook →
05_summary_figures.ipynb
05 Summary Figures
View notebook →