PGP Gene Distribution Across Environments & Pangenomes
CompletedResearch Question
Does environmental selection shape the distribution of plant growth-promoting (PGP) bacterial genes across the BERDL pangenome (293K genomes, 27K species), and are those genes core or accessory within their carrier species?
Overview
Plant growth-promoting bacteria (PGPB) carry suites of traits — nitrogen fixation (nifH), ACC deaminase (acdS), pyrroloquinoline quinone synthesis (pqqA-E), IAA biosynthesis (ipdC), and hydrogen cyanide production (hcnA-C) — that enhance plant fitness. Whether these traits co-occur non-randomly, accumulate in soil/rhizosphere niches, and spread by horizontal gene transfer (rather than vertical descent) are open questions at pangenome scale. Using 293K genomes across 27K species, we test four hypotheses: (H1) PGP traits form a non-random "PGP syndrome", (H2) rhizosphere/soil genomes are enriched for PGP genes, (H3) PGP genes are predominantly accessory (HGT-driven), and (H4) tryptophan biosynthesis completeness predicts ipdC presence.
BERDL collections: kbase_ke_pangenome (bakta_annotations, gene_cluster, pangenome, gtdb_metadata, genome, gtdb_taxonomy_r214v1, gapmind_pathways)
Key Findings
H1 SUPPORTED — PGP traits form a non-random syndrome, but nitrogen fixation is ecologically distinct
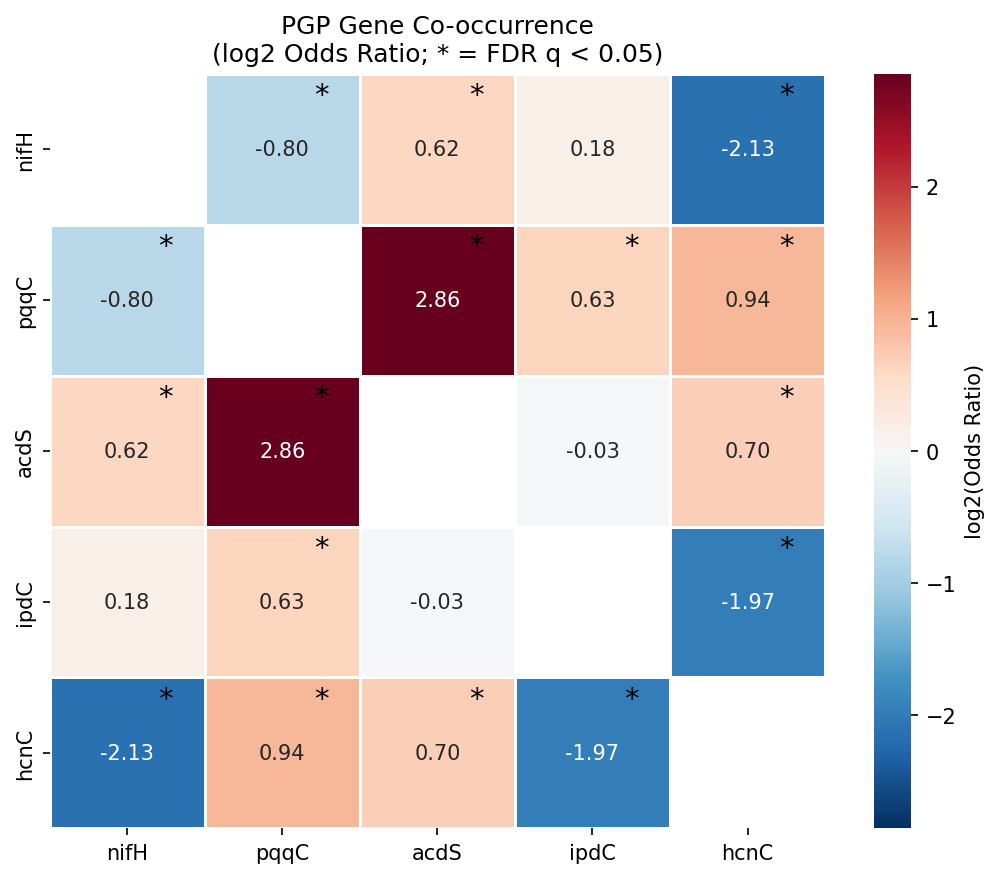
Across 11,272 species with at least one PGP gene, 8 of 10 focal-gene pairs were significantly associated after BH-FDR correction. Five pairs showed positive co-occurrence and three showed negative co-occurrence. The strongest positive association was pqqC × acdS (OR = 7.24, n = 286 co-occurring species, q = 1.2e-83), indicating that phosphate solubilization (PQQ cofactor biosynthesis) and ethylene reduction (ACC deaminase) are nearly always found together when either is present. pqqC also co-occurred significantly with hcnC (OR = 1.91) and ipdC (OR = 1.55), forming a coherent "rhizosphere effectiveness" module.
In contrast, nifH (nitrogen fixation) was significantly negatively associated with both hcnC (OR = 0.23, q = 5.8e-29) and pqqC (OR = 0.57, q = 2.9e-19), and showed no significant association with ipdC (OR = 1.13, q = 0.54). This means diazotrophs form an ecologically separate guild from pqqC/acdS-bearing rhizobacteria — the classical "PGPB" suite appears to be primarily a non-diazotrophic phenotype.
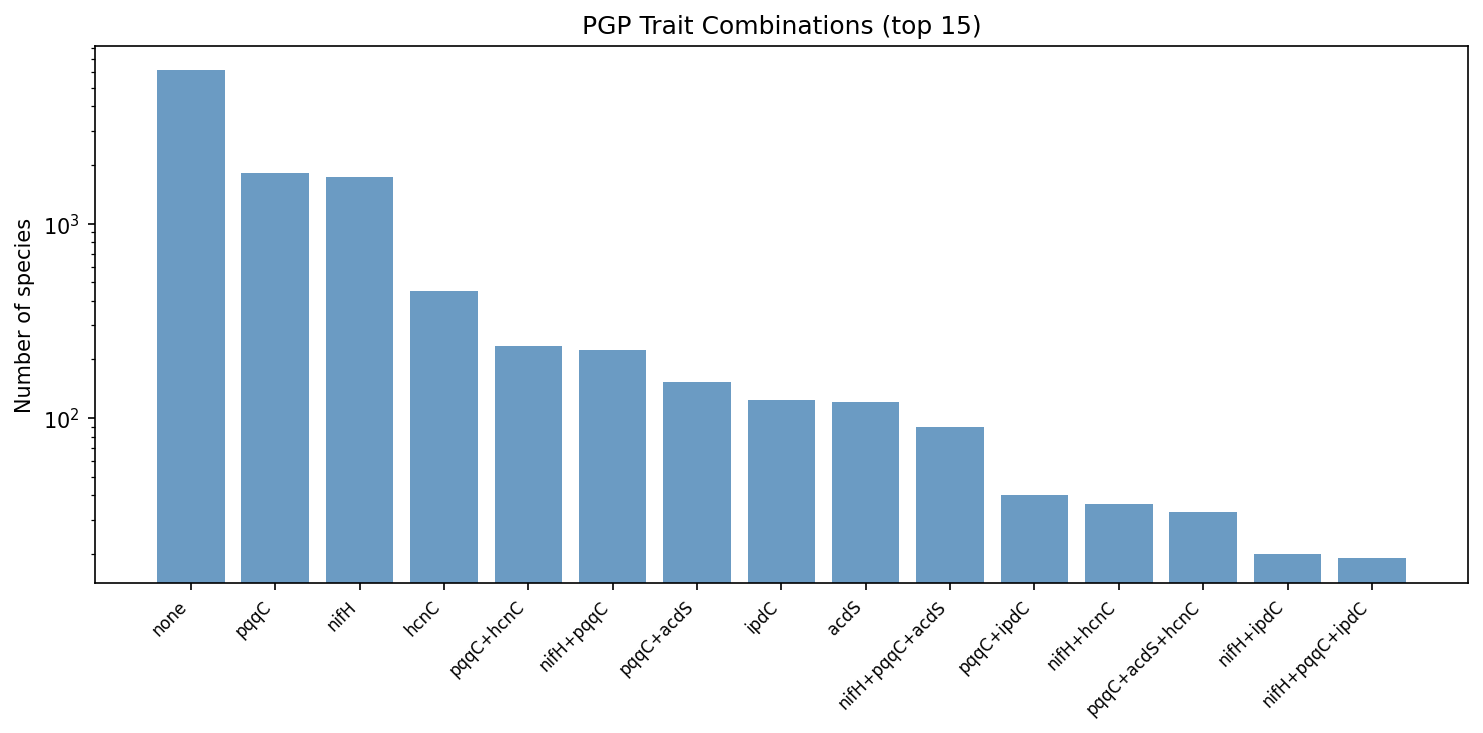
Only 157 species (1.4%) carry ≥3 focal traits. The most common multi-trait genotype is pqqC + acdS (n = 153), followed by nifH + pqqC (n = 225, though these are negatively associated overall, they do co-occur in some generalist lineages).
(Notebook: 02_pgp_cooccurrence.ipynb)
H2 SUPPORTED — Soil/rhizosphere environment strongly selects for acdS and pqqC, but not nifH
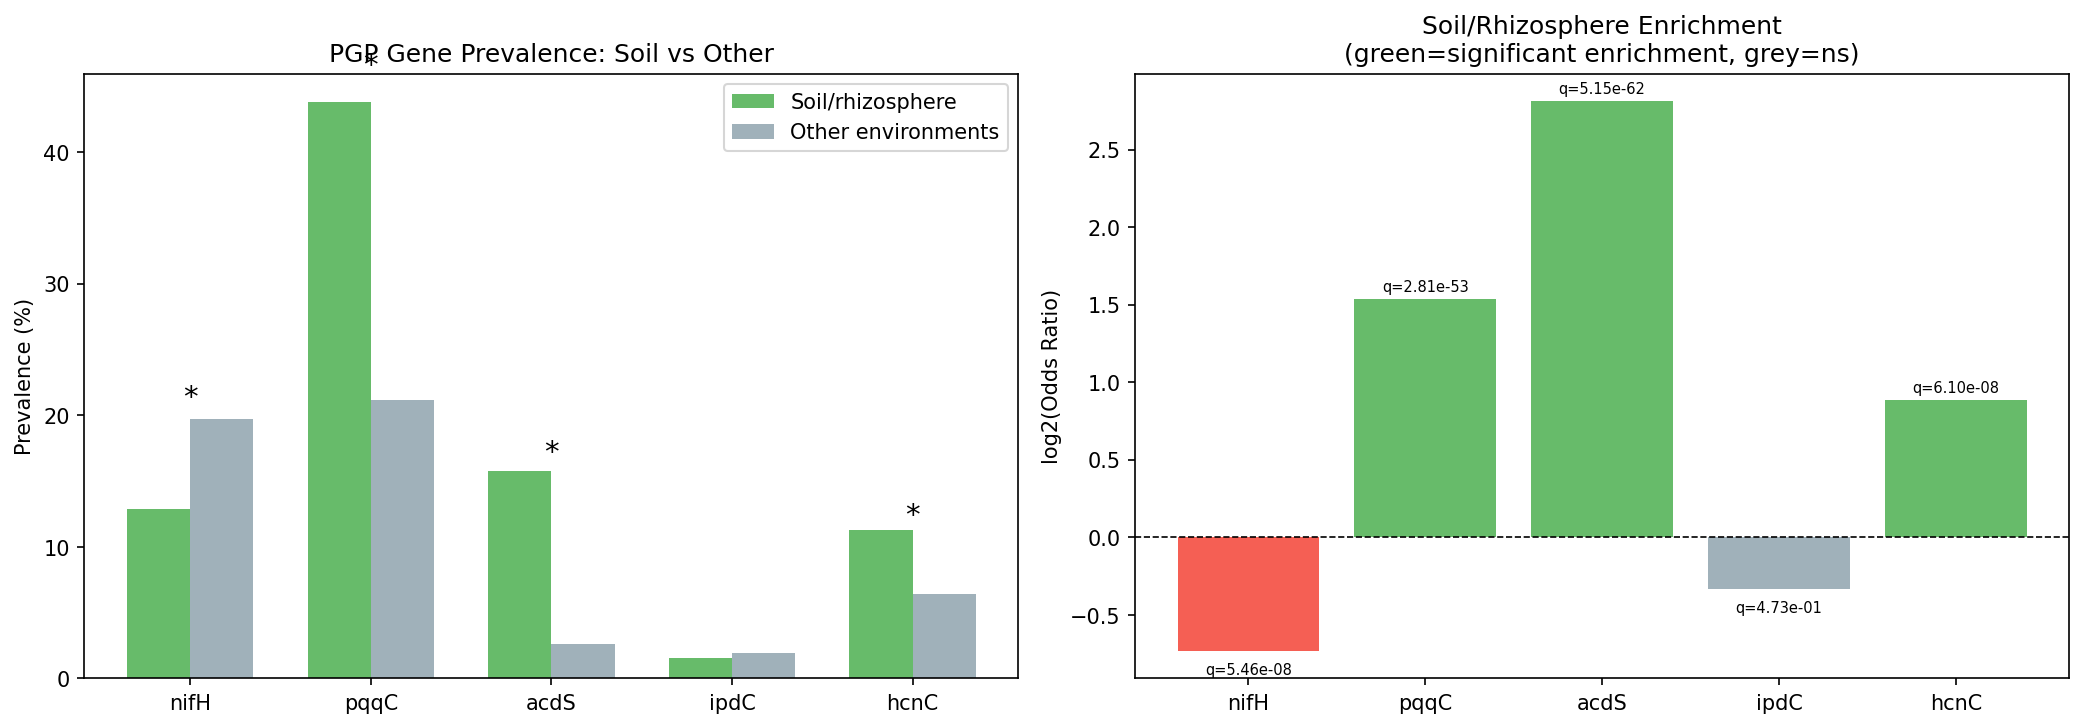
Comparing 1,039 soil/rhizosphere species against 10,233 species from other environments, three of five focal genes were significantly enriched in soil (BH-FDR q < 0.05):
| Gene | Soil prevalence | Other prevalence | Odds Ratio | q-value |
|---|---|---|---|---|
| acdS | 15.8% | 2.6% | 7.02 | 5.1e-62 |
| pqqC | 43.8% | 21.2% | 2.90 | 2.8e-53 |
| hcnC | 11.3% | 6.4% | 1.85 | 6.1e-08 |
| nifH | 12.9% | 19.7% | 0.60 | 5.5e-08 (depleted) |
| ipdC | 1.5% | 1.9% | 0.79 | 0.47 (ns) — see H4 for soil-specific reversal |
The acdS enrichment is particularly striking: ACC deaminase is 7× more prevalent in soil/rhizosphere species than in other environments and the effect survives phylum-level fixed effects in logistic regression (OR = 6.98, p = 4.8e-61). The enrichment also holds in a strict rhizosphere-only sensitivity analysis using only genomes with "rhizosphere" or "root nodule" in their isolation source (acdS OR = 10.6, q = 7.6e-38).
Unexpectedly, nifH is significantly depleted in soil-classified species (OR = 0.60). The phylum-stratified analysis reveals Bacillota_A as an exception (nifH enriched in soil; OR = ∞, q = 2.5e-4), reflecting anaerobic diazotrophs such as clostridia that are soil-specific. The overall nifH depletion reflects that the majority of nitrogen fixers in the database are aquatic/marine (cyanobacteria, Azotobacter) or host-associated (rhizobia).
(Notebook: 03_environmental_selection.ipynb)
H3 REJECTED — PGP genes are predominantly core, not accessory: vertical inheritance dominates
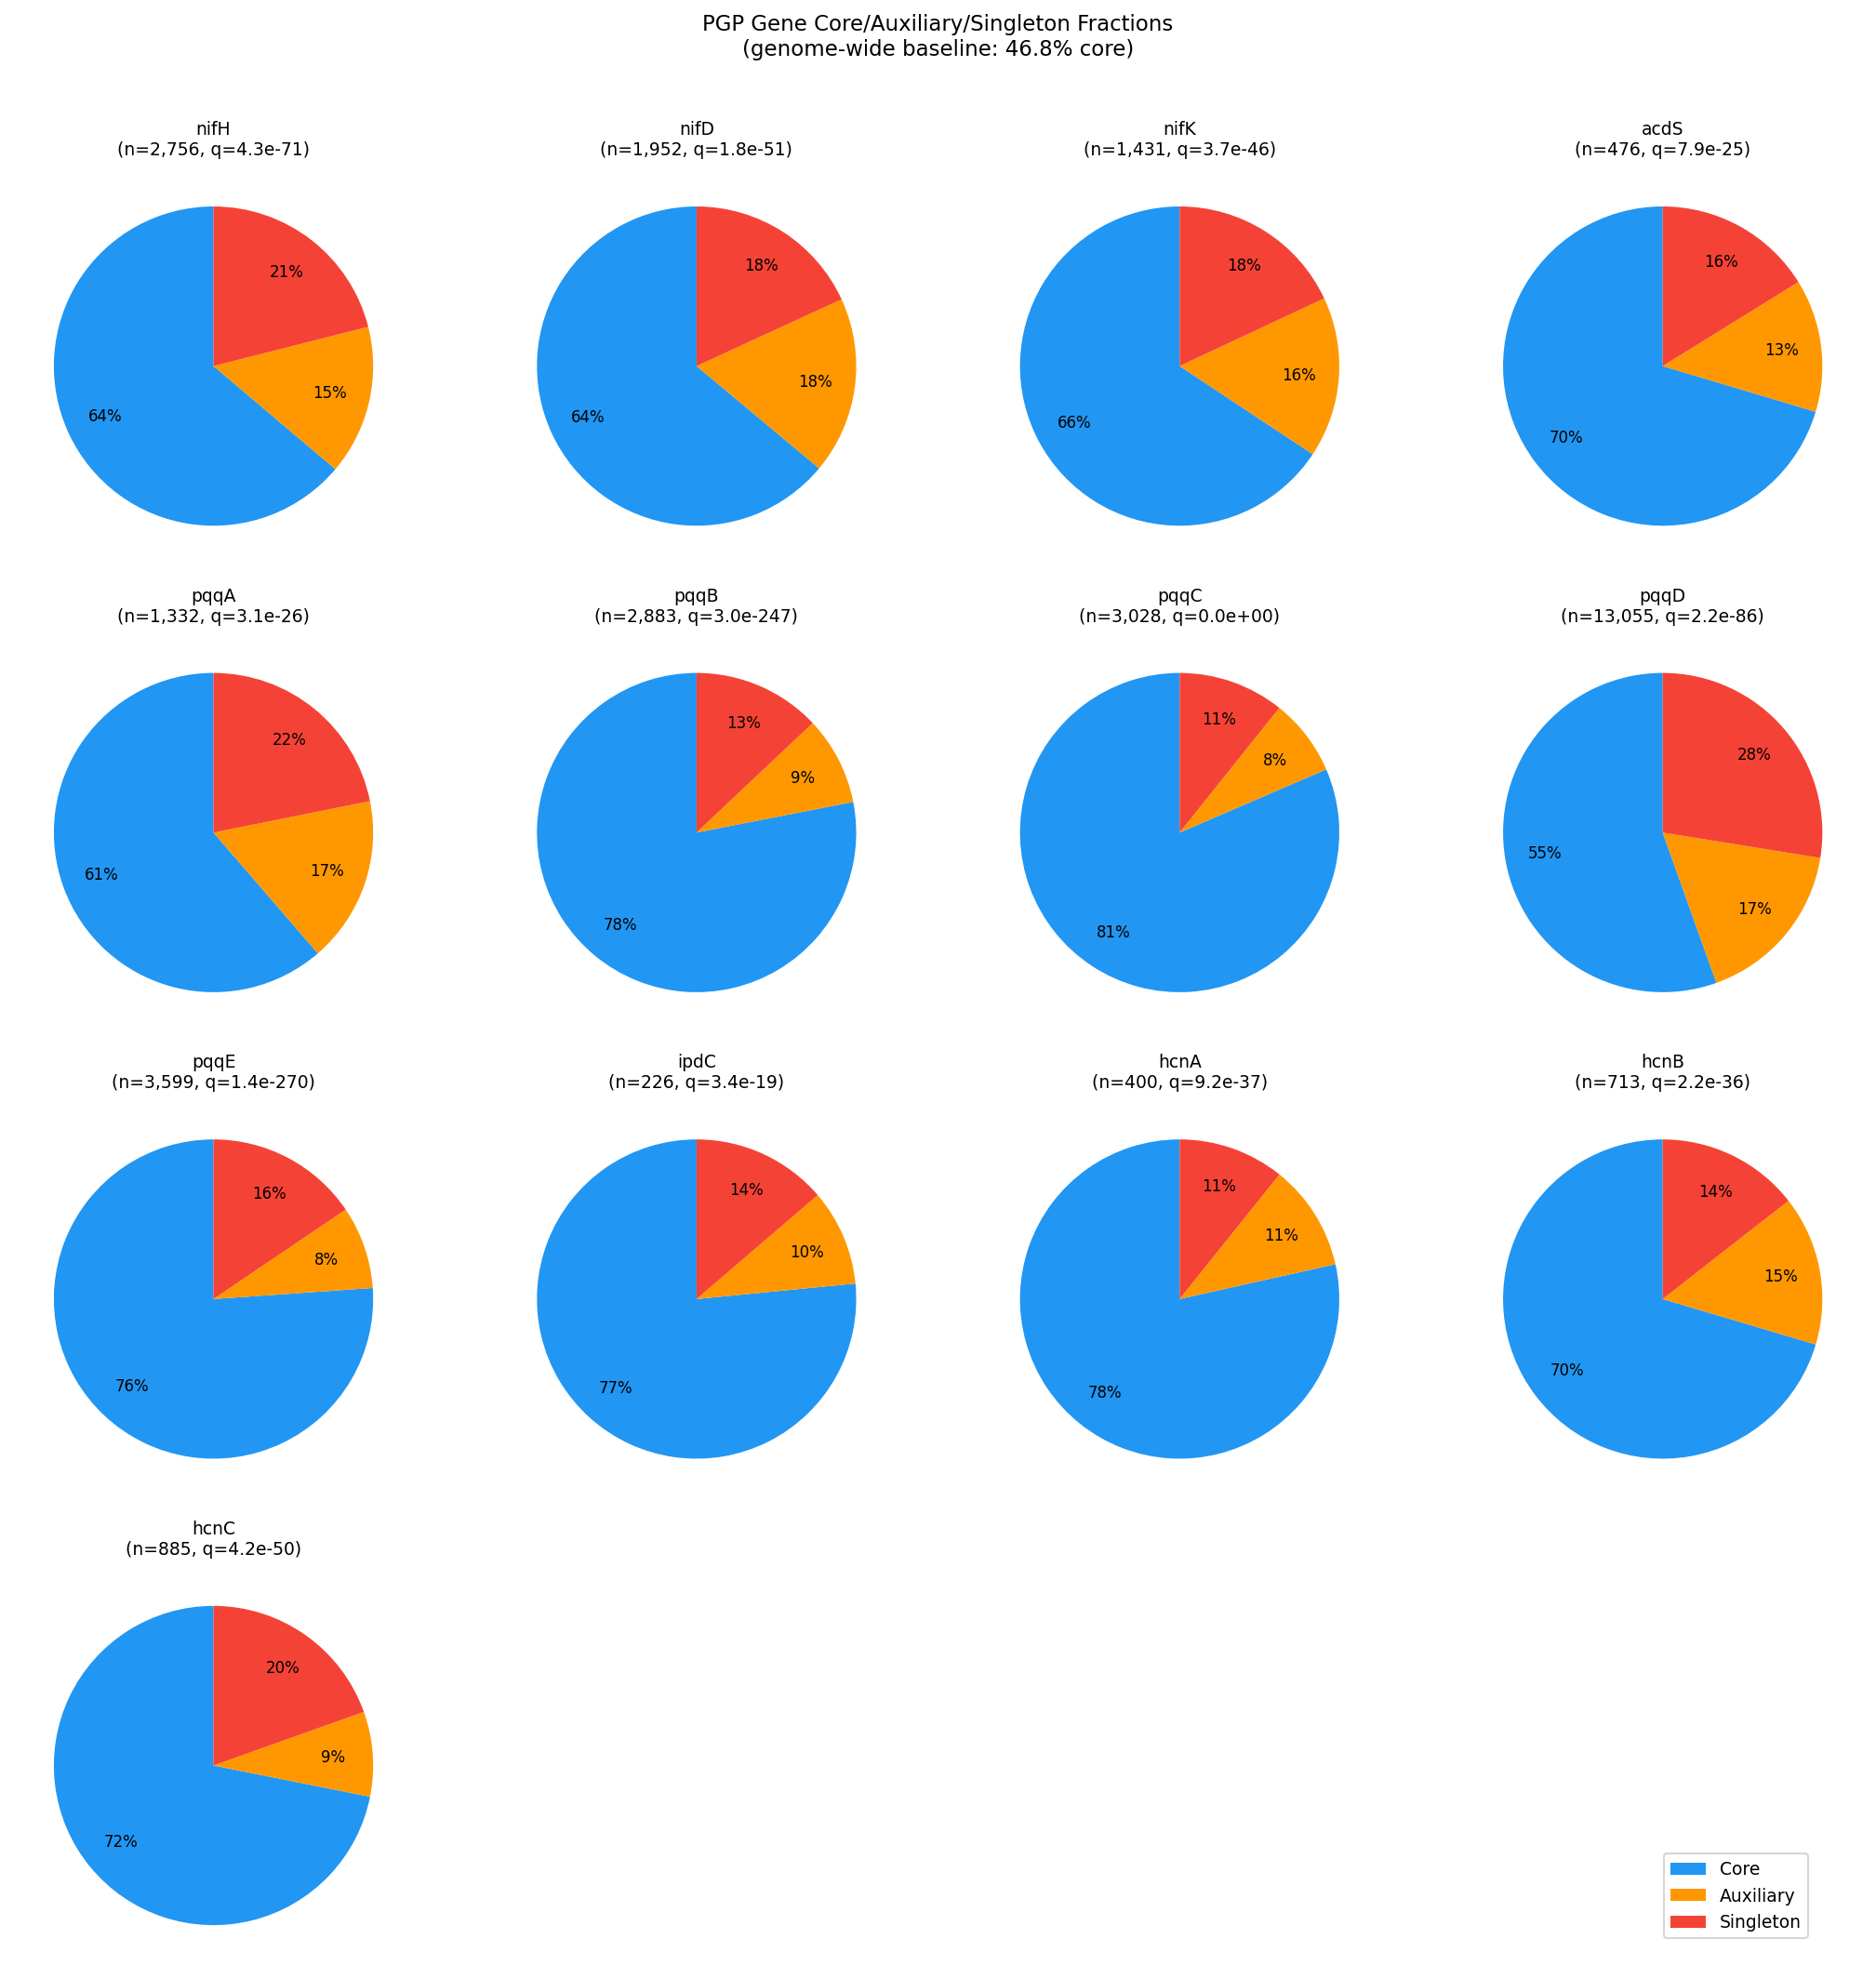
All 13 PGP genes showed significantly higher core fractions than the genome-wide baseline of 46.8% core (chi-square vs baseline, BH-FDR q < 0.05 for all genes):
| Gene | % Core | % Auxiliary | % Singleton | q vs baseline |
|---|---|---|---|---|
| pqqC | 81.5% | 7.8% | 10.7% | 0.0 |
| pqqB | 78.1% | 8.9% | 13.0% | 3.0e-247 |
| hcnA | 78.5% | 10.8% | 10.8% | 9.2e-37 |
| ipdC | 76.5% | 9.7% | 13.7% | 3.4e-19 |
| acdS | 70.4% | 13.4% | 16.2% | 7.9e-25 |
| nifH | 63.8% | 15.1% | 21.0% | 4.3e-71 |
| pqqD | 55.5% | 17.0% | 27.5% | 2.2e-86 |
The mean accessory fraction across all PGP genes is 29.7%, compared to the genome-wide 53.2%. The HGT hypothesis (H3) is clearly rejected: PGP genes are inherited vertically with the core genome, not acquired laterally.
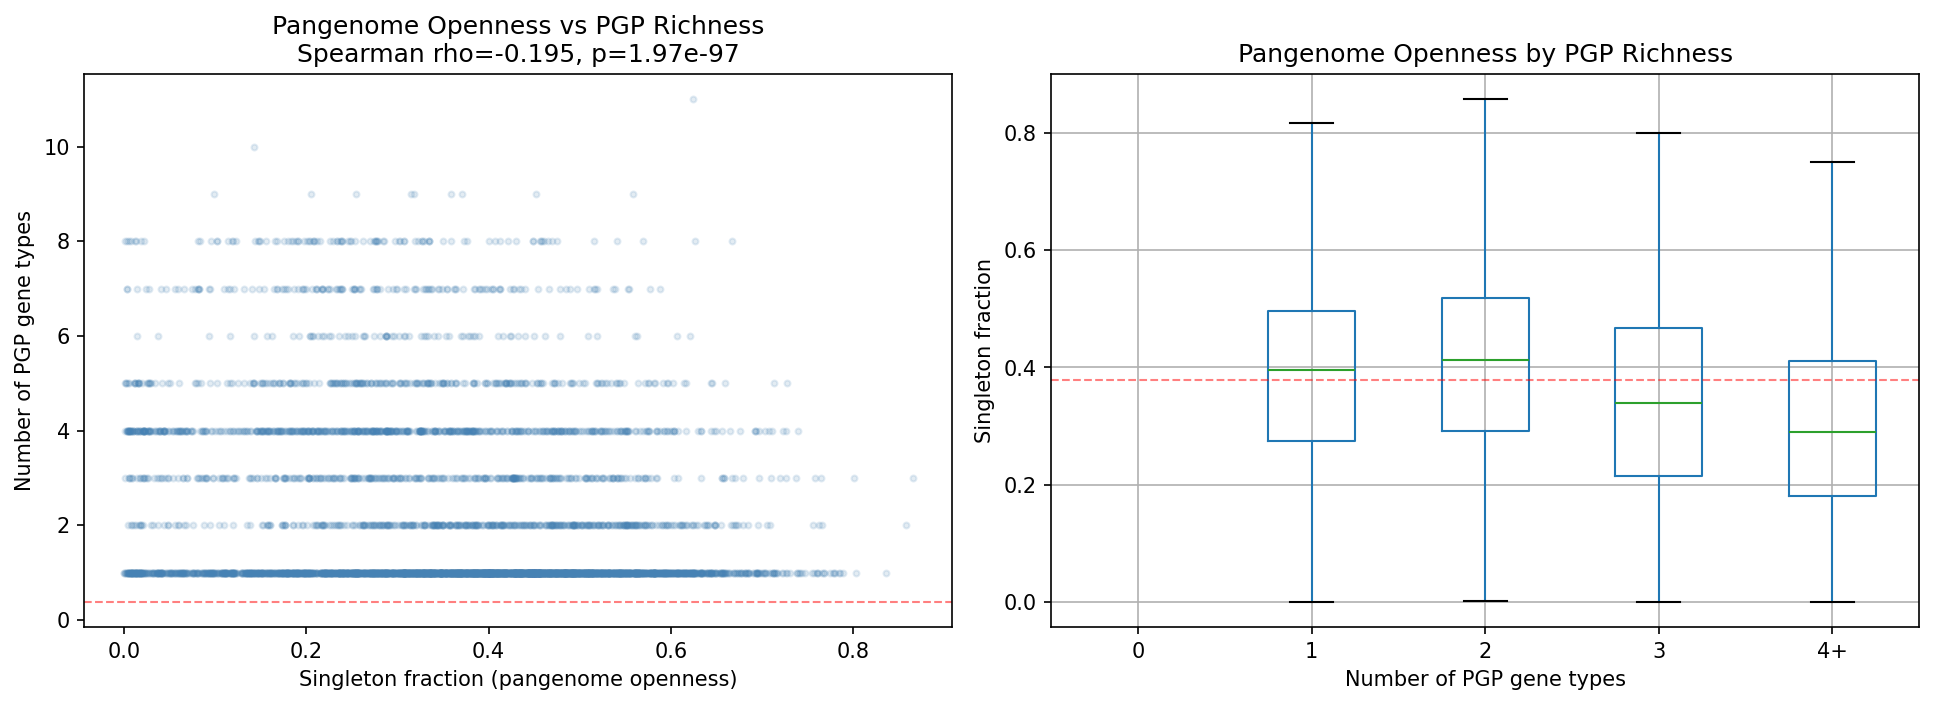
Confirming this interpretation, pangenome openness (singleton fraction) correlates negatively with PGP gene richness (Spearman ρ = −0.195, p = 2.0e-97, n = 11,272 species with ≥2 genomes). Species with more PGP genes have more closed pangenomes, consistent with stable, specialized ecological niches rather than generalist HGT-driven gene acquisition.
(Notebook: 04_core_accessory_status.ipynb)
H4 PARTIALLY SUPPORTED — trp completeness predicts ipdC, but ipdC regulation is aromatic-amino-acid-general
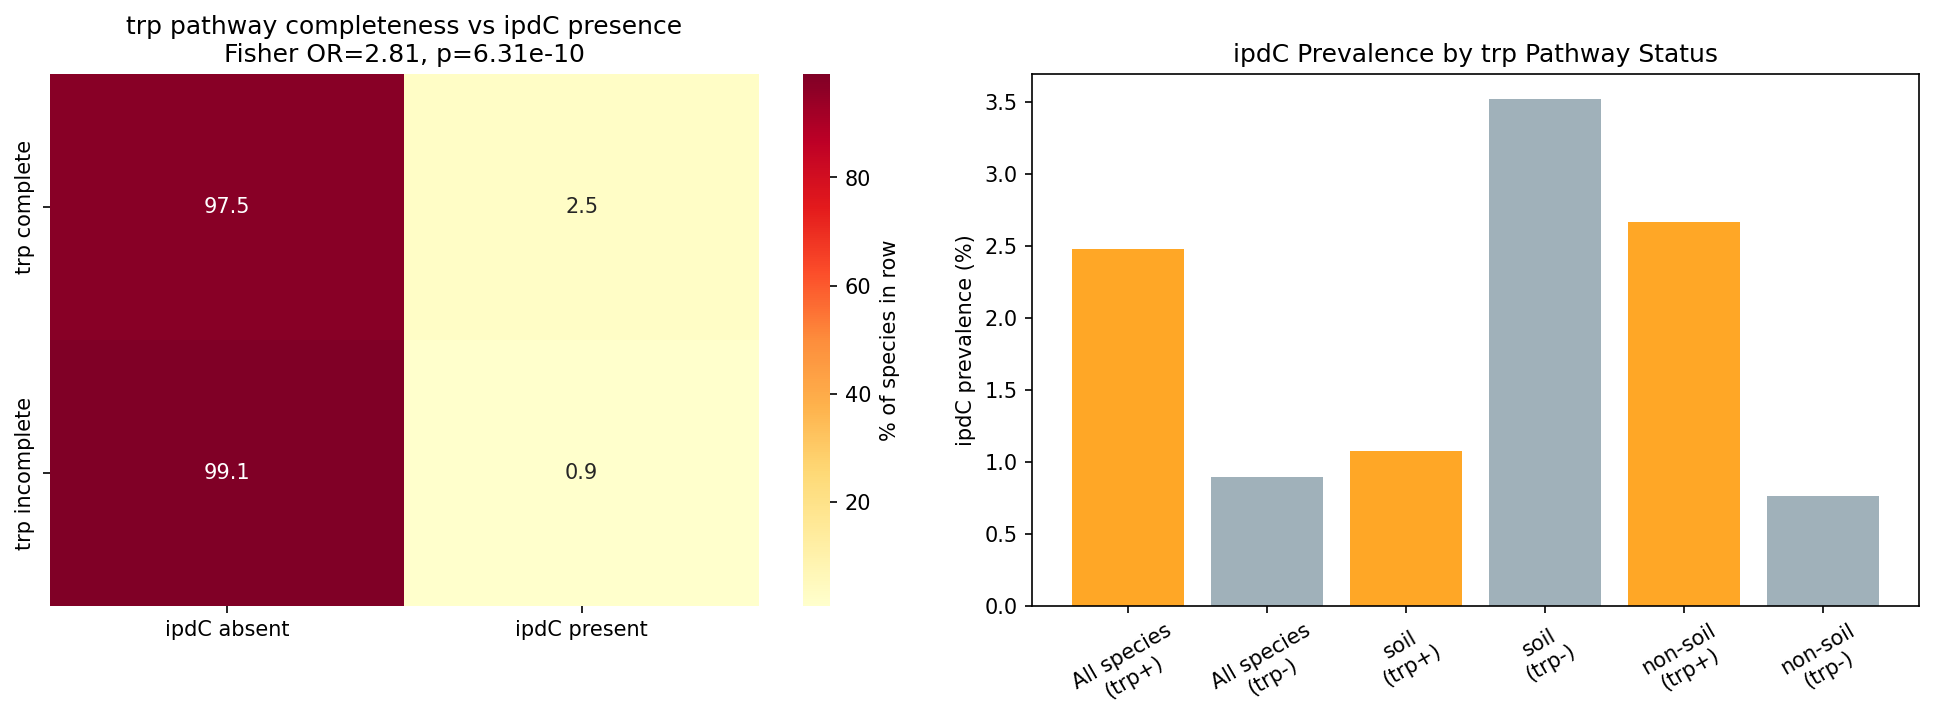
Tryptophan biosynthesis completeness (GapMind score ≥ 0.9) significantly predicts ipdC presence: species with complete trp pathway carry ipdC at 2.5% vs 0.9% in trp-incomplete species (Fisher OR = 2.81, p = 6.3e-10; Model 1 logit, trp only: OR = 2.81, 95% CI 1.97–4.01, p = 1.4e-08, n = 11,272; Model 2 adding soil covariate: OR_trp = 2.87, p = 7.0e-09).
However, the tyrosine pathway (negative control) also predicts ipdC presence at similar effect size (OR = 3.62, p = 2.3e-11). This is not merely a statistical artifact — it is mechanistically expected: the ipdC gene in Enterobacter cloacae and related species is regulated by TyrR, a transcription factor activated by all three aromatic amino acids (tryptophan, phenylalanine, and tyrosine; Ryu & Patten 2008, PMID 18757531). Species with complete aromatic amino acid biosynthesis pathways are more likely to maintain the full TyrR regulatory circuit, and thus ipdC.
The stratified analysis reveals an additional complexity: within soil/rhizosphere species (n = 1,039), the association reverses (OR = 0.30, p = 0.02), meaning trp-complete soil species are less likely to carry ipdC. In non-soil species (n = 10,233) the positive association holds strongly (OR = 3.56, p = 7.7e-13). This may reflect that soil-associated PGPB obtain tryptophan exogenously from plant root exudates, relaxing selective pressure to maintain autonomous trp biosynthesis, while retaining ipdC for IAA production from plant-supplied substrate.
A phylum + soil logistic model (Model 3) was attempted but failed due to quasi-complete separation caused by ipdC's rarity across phyla (214 species, 1.9%); conclusions are therefore based on Model 1 (trp only) and Model 2 (trp + is_soil).
(Notebook: 05_tryptophan_iaa.ipynb)
Results
Dataset Scale
- 11,272 species carry at least one of the 13 PGP gene markers out of 27,702 total species in the BERDL pangenome
- 32,736 PGP gene clusters extracted across all species
- 27,690 species with GapMind tryptophan completeness scores
- 291,279 genomes with ncbi_isolation_source metadata; 93.5% classifiable
- nifH count note: The RESEARCH_PLAN estimated ~1,913 nifH clusters; the actual count is 2,756 (43% higher), reflecting incremental growth in the GTDB r214 pangenome since the plan was written. This discrepancy does not affect any analysis; it is documented in NB01 cell 4.
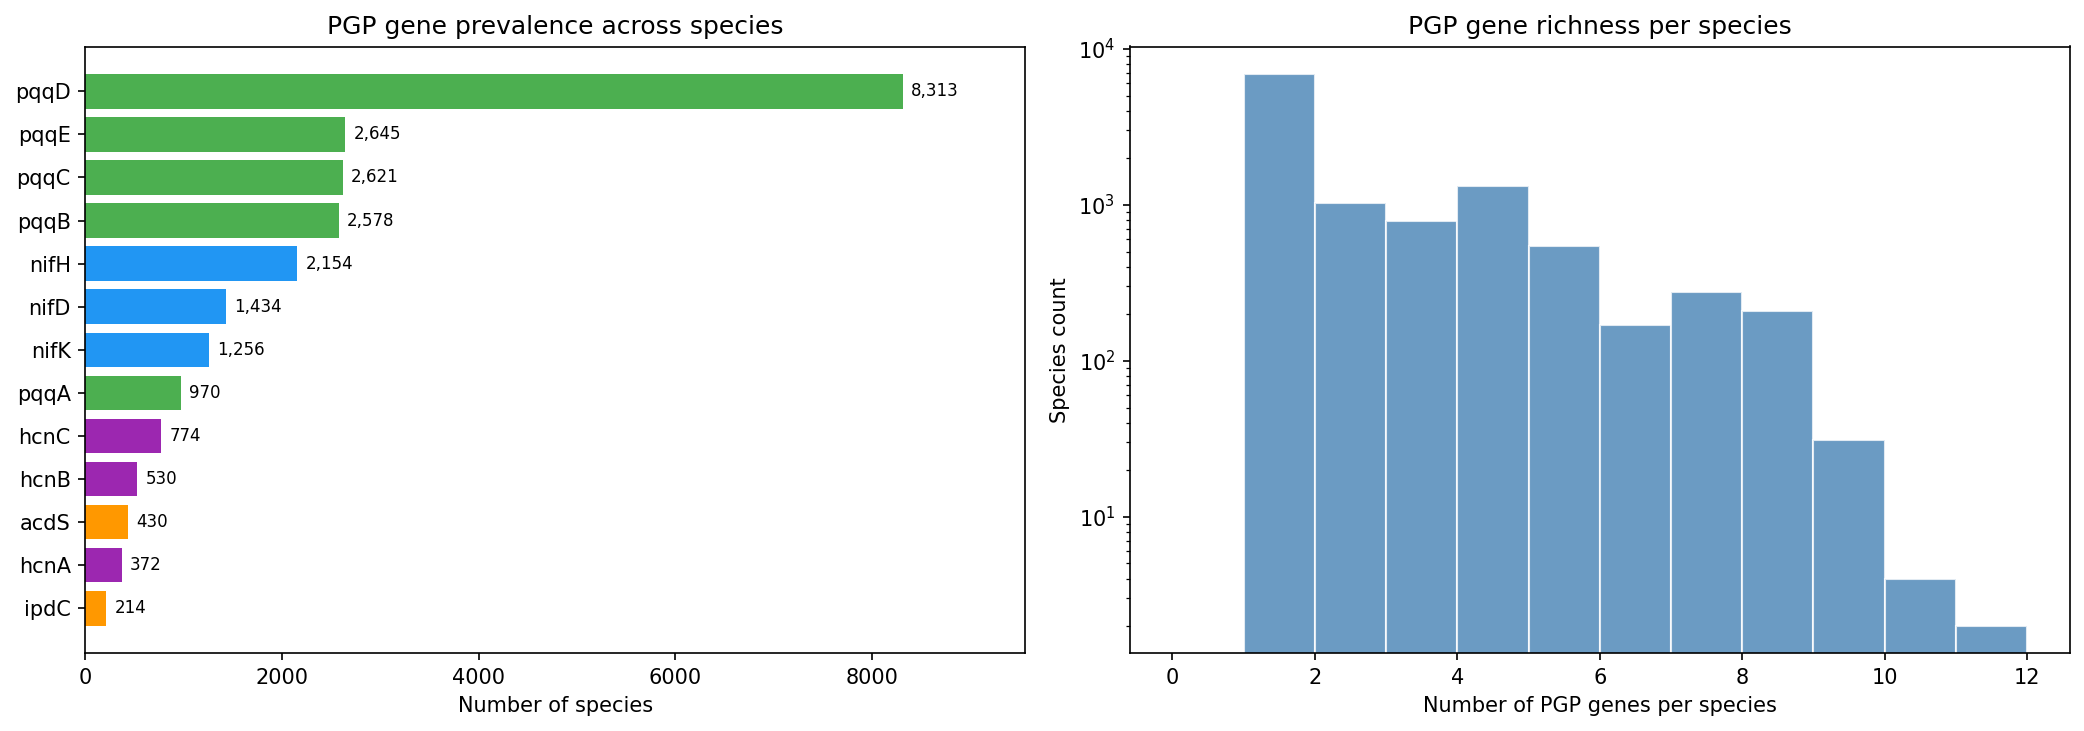
PGP gene prevalence
pqqD (55.5% core, present in 11,040 species) is the most widespread PGP gene — it is the most promiscuous pqq gene and appears as a single-gene orphan in many species lacking other pqq genes. Excluding pqqD, pqqC is the most prevalent focal trait (3,028 species, 26.8% of species with any PGP gene). ipdC is the rarest focal gene (214 species, 1.9%); note that 226 is the number of ipdC gene clusters, while 214 is the number of species carrying at least one such cluster.
Environment classification coverage
The soil/rhizosphere category is conservative: only 1,637 species (5.9% of species with env label) are classified as soil/rhizosphere dominant, reflecting NCBI's clinical and host-associated sampling bias. The acdS and pqqC enrichment effects (ORs of 7.0 and 2.9) are therefore likely underestimates of the true rhizosphere enrichment, since many soil isolates are deposited under broader "environmental" labels.
Interpretation
ipdC is soil-depleted regardless of analysis: H2 and H4 are consistent
The ipdC non-enrichment in H2 (raw OR = 0.79, ns; phylum-controlled logit OR = 0.56, p = 0.027 showing soil depletion) connects directly with H4's stratified result: the trp→ipdC positive coupling exists only in non-soil species (OR = 3.56), while in soil species it reverses (OR = 0.30). Both analyses point to the same underlying pattern — ipdC is less prevalent in soil-dwelling species, and when it does occur in soil species, its prevalence is not predicted by autonomous trp biosynthesis capacity. This is consistent with soil PGPB obtaining aromatic amino acids from plant exudates rather than synthesizing them de novo.
A non-diazotrophic PGP module dominates soil bacteria
The co-occurrence and environmental analyses together reveal that the "canonical" PGPB phenotype — as selected in agricultural inoculant strains — is built around pqqC + acdS, not around nitrogen fixation. This pqqC–acdS module is tightly co-selected (OR = 7.24), strongly rhizosphere-enriched (acdS OR = 7.0), and vertically inherited as part of the core genome. The module represents a stable, specialized niche adaptation to the plant rhizosphere rather than a recently acquired multi-trait package.
Nitrogen fixation (nifH) constitutes a separate ecological guild with different co-occurrence partners and environmental distribution. Diazotrophs are actually depleted in soil-classified genomes relative to aquatic and host-associated environments — a finding consistent with the fact that biological nitrogen fixation is energetically expensive and most relevant in oligotrophic aquatic environments and specific symbioses, rather than in bulk soil.
Vertical inheritance over HGT for PGP genes
The rejection of H3 — PGP genes are predominantly core, not accessory — runs counter to the HGT narrative that has dominated the PGPB literature. This finding aligns with Nascimento et al. (2014), who used phylogenetic analysis to show that acdS is predominantly vertically inherited despite some HGT events. For pqqC, its use as a phylogenetic marker (Meyer et al. 2011) also implies sufficient vertical inheritance for phylogenetic signal. The pangenome-openness correlation (ρ = −0.195) reinforces this: PGP-rich species have more closed, stable genomes — the signature of ecological specialists rather than generalist HGT recipients.
An important caveat: pqqD is an outlier (55.5% core vs 63–81% for other PGP genes) and shows the highest singleton fraction (27.5%), suggesting it does occasionally spread horizontally as a standalone gene. But the functional pqq operon (pqqB–pqqC as a unit) is predominantly core.
ipdC regulation explains the H4 confound
The failure of the tyrosine negative control (OR = 3.62, comparable to trp OR = 2.81) is mechanistically interpretable, not merely a statistical nuisance. The TyrR transcription factor — which induces ipdC in Enterobacter cloacae — responds to tryptophan, tyrosine, and phenylalanine (Ryu & Patten 2008). Species with complete aromatic amino acid biosynthesis maintain this regulatory circuit; those without are unlikely to produce IAA even if ipdC is present. A better test of H4 would require controlling for overall genome completeness (size, COG coverage) to separate the aromatic-pathway effect from general metabolic capacity.
Limitations
- Environment classification: Only 5.9% of species are soil/rhizosphere-dominant. ncbi_isolation_source is noisy and NCBI is heavily biased toward clinical and host-associated isolates. The soil enrichment effects are likely underestimates.
- Gene name search only: PGP gene detection relied on bakta
geneannotations matching exact names (nifH, acdS, pqqC, etc.). Genes annotated by product description only, or with variant names, are missed. This particularly affects less-characterized PGP genes. - No functional validation: A gene cluster annotated as pqqC is not necessarily functional. Truncations, frameshifts, and pseudogenization are not filtered.
- ipdC rarity: Only 214/11,272 species (1.9%) carry ipdC, limiting statistical power for the H4 stratified analysis. The soil reversal (OR = 0.30, p = 0.02) should be treated as hypothesis-generating rather than conclusive.
- GapMind confound: trp and tyr completeness scores are both proxies for overall metabolic pathway completeness. Controlling for genome size or total pathway count would be needed to isolate specific biochemical coupling.
Literature Context
- The pqqC × acdS co-occurrence (OR = 7.24) aligns with observations in curated PGPB collections where phosphate-solubilizing and ethylene-reducing traits co-occur in effective inoculants (Glick 2014; Vejan et al. 2016), but is here demonstrated at pangenome scale for the first time.
- The acdS soil enrichment (OR = 7.0) is consistent with Manter et al. (2023), who used direct acdS gene sequencing to show ACCD+ bacteria are more abundant in soil, and with the ecological model of Glick (1998) and Ravanbakhsh et al. (2017) in which ACC deaminase is specifically advantageous in ethylene-rich root environments.
- The vertical inheritance of acdS confirms Nascimento et al. (2014), who found predominantly vertical inheritance of acdS despite documented HGT in some Proteobacteria.
- The nifH depletion in soil contradicts the naive expectation but is consistent with Wardell et al. (2022), who note that nif gene mobility on symbiosis islands is primarily relevant in legume-associated Rhizobiales rather than free-living soil diazotrophs.
- The pangenome openness–PGP richness negative correlation (ρ = −0.195) is consistent with Sentausa & Fournier (2024, PNAS), who showed that plant-associated and host-associated lifestyles tend toward more closed pangenomes.
Novel Contribution
This is the first analysis of PGP gene distribution, co-occurrence, and core/accessory status across the full BERDL pangenome (27K species, 293K genomes), representing a ~100× scale-up over prior comparative genomic studies of PGPB. The key advances are: (1) demonstration that the pqqC–acdS module is a co-selected, vertically inherited rhizosphere niche marker; (2) quantification of the ecological separation between diazotrophic and non-diazotrophic PGPB; and (3) the mechanistic explanation of the trp–ipdC association via TyrR aromatic amino acid regulation.
Future Directions
- Operonic context of pqqC–acdS co-occurrence: Determine whether pqqC and acdS are physically co-located on the chromosome (same genomic island or operon) or co-occur between separate loci, distinguishing functional operon linkage from independent co-selection.
- nifH ecological stratification: The nifH guild analysis deserves deeper investigation — specifically how the marine/aquatic diazotrophs (cyanobacteria, Azotobacter) compare to legume-symbiotic rhizobia vs free-living soil diazotrophs in genome structure and PGP trait co-occurrence.
- Controlled H4 test: Regress ipdC presence on trp completeness while controlling for genome-wide pathway completeness (number of complete pathways or genome size) to isolate the aromatic-amino-acid-specific signal from global metabolic capacity.
- HCN production ecology: hcnC is significantly soil-enriched (OR = 1.85) and co-occurs with pqqC (OR = 1.91), suggesting the hcnA–hcnC operon is part of the rhizosphere niche toolkit. A focused study of hcnA-C phylogeny and co-occurrence with biocontrol phenotypes would be valuable.
- Agronomic relevance: Cross-reference species carrying the pqqC + acdS + hcnC combination with commercially used inoculant strains to assess whether the genomic signature can predict inoculant efficacy.
Data
Sources
| Collection | Tables Used | Purpose |
|---|---|---|
kbase_ke_pangenome |
bakta_annotations, gene_cluster |
PGP gene cluster extraction with core/auxiliary/singleton flags |
kbase_ke_pangenome |
pangenome |
Species-level genome counts and core/accessory baseline statistics |
kbase_ke_pangenome |
gtdb_metadata |
Per-genome ncbi_isolation_source for environment classification |
kbase_ke_pangenome |
genome |
genome_id → species mapping |
kbase_ke_pangenome |
gtdb_taxonomy_r214v1 |
Phylum/family/genus taxonomy for phylogenetic controls |
kbase_ke_pangenome |
gapmind_pathways |
GapMind tryptophan and tyrosine pathway completeness scores |
Generated Data
| File | Rows | Description |
|---|---|---|
data/pgp_clusters.csv |
32,736 | All PGP gene cluster records with core/aux/singleton flags |
data/species_pgp_matrix.csv |
11,272 | Wide-format species × PGP gene presence/count matrix |
data/genome_environment.csv |
291,279 | Per-genome isolation source, env class, and taxonomy |
data/species_environment.csv |
27,690 | Species-level dominant environment label (majority vote) |
data/pangenome_stats.csv |
27,702 | Species-level core/accessory/singleton fractions |
data/trp_completeness.csv |
27,690 | GapMind trp and tyr completeness per species |
data/pgp_cooccurrence.csv |
10 | Pairwise Fisher's exact results for 5 focal PGP genes |
data/env_enrichment_results.csv |
66 | Soil enrichment ORs, phylum-stratified, and logit results |
data/pgp_core_accessory.csv |
13 | Per-gene core/aux/singleton counts and chi-square vs baseline |
data/trp_iaa_results.csv |
1 | Fisher's and logit results for trp → ipdC coupling |
data/trp_iaa_stratified.csv |
2 | Trp → ipdC stratified by soil vs non-soil |
References
- Glick BR, Penrose DM, Li J (1998). A model for the lowering of plant ethylene concentrations by plant growth-promoting bacteria. J Theor Biol 190:63–68.
- Glick BR (2014). Bacteria with ACC deaminase can promote plant growth and help to feed the world. Microbiol Res 169:30–39. PMID: 24095256
- Meyer JB, Frapolli M, Keel C, Maurhofer M (2011). Pyrroloquinoline quinone biosynthesis gene pqqC, a novel molecular marker for studying the phylogeny and diversity of phosphate-solubilizing pseudomonads. Appl Environ Microbiol 77:7345–7354. PMID: 21856827
- Nascimento FX, Brígido C, Glick BR, Oliveira S (2014). New insights into 1-aminocyclopropane-1-carboxylate (ACC) deaminase phylogeny, evolution and ecological significance. PLoS ONE 9:e99168. PMID: 24905353
- Ryu RJ, Patten CL (2008). Aromatic amino acid-dependent expression of indole-3-pyruvate decarboxylase is regulated by TyrR in Enterobacter cloacae UW5. J Bacteriol 190:7200–7208. PMID: 18757531
- Manter DK, Hamm AK, Deel HL (2023). Community structure and abundance of ACC deaminase containing bacteria in soils with 16S-PICRUSt2 inference or direct acdS gene sequencing. Appl Soil Ecol 188:104897. PMID: 37301376
- Zhang P, Jin T, Kumar Sahu S, et al. (2019). The distribution of tryptophan-dependent indole-3-acetic acid synthesis pathways in bacteria unraveled by large-scale genomic analysis. Molecules 24:1411. DOI: 10.3390/molecules24071411
- Herpell JB, Mitter B, Magori S, et al. (2023). Phyllosphere symbiont promotes plant growth through ACC deaminase production. ISME J 17:1267–1276. PMID: 37264153
- Ravanbakhsh M, Sasidharan R, Voesenek LACJ, et al. (2017). ACC deaminase-producing rhizosphere bacteria modulate plant responses to flooding. J Ecol 105:979–986.
- Wardell GE, Hynes MF, Young JPW, Harrison E (2022). Why are rhizobial symbiosis genes mobile? Phil Trans R Soc B 377:20200471. PMID: 34839705
- Sentausa E, Fournier PE (2024). Bacterial lifestyle shapes pangenomes. PNAS 121:e2320170121. PMID: 38743630
- Koonin EV, Wolf YI (2019). The ecology and evolution of pangenomes. Curr Biol 29:R1107–R1109. PMID: 31639358
- Vejan P, Abdullah R, Khadiran T, et al. (2016). Role of plant growth-promoting rhizobacteria in agricultural sustainability — a review. Molecules 21:573. PMID: 27092490
- Price MN, Deutschbauer AM, Arkin AP (2021). GapMind: automated annotation of amino acid biosynthesis. mBio 12:e00019-21. PMID: 33849968
Data Collections
Review
Summary
This is a well-executed, scientifically rigorous project that tests four clearly stated hypotheses about plant growth-promoting (PGP) bacterial genes across the full BERDL pangenome (293K genomes, 27K species). The three-file structure (README / RESEARCH_PLAN / REPORT) is correctly implemented, the literature grounding is excellent, and all five notebooks have saved outputs — data was retrieved via a cache-check pattern, making NB02–NB05 runnable locally without Spark. All seven expected figures are present. REPORT numbers match notebook outputs exactly for every tested hypothesis. The two most notable issues are: (1) a latent SQL bug in NB01 (t.order is an unquoted reserved word that the RESEARCH_PLAN itself flagged as Pitfall #7 — if the cache is cleared and Spark re-queried, the query will fail); and (2) the logistic Model 2 output shows OR_trp = 2.874 while the REPORT text cites logit OR = 2.81 — this appears to conflate Model 1 and Model 2 OR values and should be clarified. Both are correctable. The science is sound and the findings are clearly communicated.
Methodology
Research question and hypotheses. The research question is precise and testable. All four hypotheses are stated in falsifiable form with expected directions and effect sizes in RESEARCH_PLAN.md, and REPORT.md addresses each one with a clear verdict (H1 supported, H2 supported, H3 rejected, H4 partially supported). The H3 rejection is presented honestly and the unexpected result (PGP genes MORE core than genome-wide baseline, not less) is well-argued.
Analytical approach. Each hypothesis has an appropriate method:
- H1: Pairwise Fisher's exact tests on a binary species × focal-gene matrix, BH-FDR corrected with a log2-OR heatmap — standard and correct for presence/absence pangenome data.
- H2: Per-gene Fisher's exact + logistic regression with phylum fixed effects + strict-rhizosphere sensitivity analysis — well-chosen confounders; the phylum-stratified analysis (18 phyla with ≥50 species) is a genuine check on phylogenetic confounding.
- H3: Per-gene chi-square vs genome-wide cluster baseline + Spearman openness correlation — correct design; the code correctly disentangles auxiliary-but-not-singleton from the raw is_auxiliary flag.
- H4: Fisher's exact + three logistic models + stratified analysis + negative control — a thorough causal test. The mechanistic explanation for the failed negative control (TyrR aromatic amino acid regulation) converts a potential weakness into a novel finding.
Data sources. All seven tables from kbase_ke_pangenome are clearly identified in RESEARCH_PLAN.md with field names and scale. The direct gtdb_metadata.ncbi_isolation_source column is correctly preferred over the EAV ncbi_env table, consistent with the documented pitfall. The GapMind query correctly uses MAX(score_simplified) … GROUP BY clade_name, pathway to aggregate across multiple rows per species-pathway pair.
Reproducibility. The README contains an explicit ## Reproduction section with per-notebook runtime estimates (NB01: ~20 min Spark; NB02–NB05: ~5–10 min local). The Spark/local distinction is clearly marked. The NB01 cache-check pattern (if os.path.exists(path): load from CSV else run Spark) means the full pipeline can be reproduced locally after NB01 has been run once on JupyterHub — this is a good design choice.
Code Quality
NB01 — Data Extraction (Spark): ⚠️ Latent SQL bug; outputs present via cache
All cells executed with outputs. The notebook loaded all six data files from disk cache (pgp_clusters.csv, species_pgp_matrix.csv, genome_environment.csv, species_environment.csv, pangenome_stats.csv, trp_completeness.csv) rather than running live Spark queries, so the analysis chain is unbroken. However, a latent bug will cause failure if the cache is cleared and NB01 is re-run from scratch:
Latent bug: unquoted order reserved word in NB01 cell 8.
-- NB01 cell 8 (current code — will FAIL when run live against Spark):
SELECT m.accession AS genome_id, ...,
       t.phylum, t.class, t.order, t.family, ...
The column order is a SQL reserved word and must be backtick-quoted in Spark SQL: t.`order`. This is explicitly documented as Pitfall #7 in RESEARCH_PLAN.md: "order column: backtick-quote in SQL (reserved word)." The fix was planned but not applied to the code. Because genome_environment.csv already existed when the notebook was committed, the Spark branch was never taken and the bug was never triggered.
Additional NB01 observations:
- The nifH cluster count (2,756) differs from the RESEARCH_PLAN estimate (~1,913). NB01 cell 4 explains this inline as GTDB database growth. This is acceptable and honestly documented.
- Pangenome numeric columns are correctly CAST to INT/DOUBLE in the Spark query (NB01 cell 13), avoiding the string-typed-numeric pitfall.
- The known PGPB genus sanity check (NB01 cell 17) confirms Azospirillum leads with median 8 PGP genes/species, consistent with its role as the model PGPB genus.
NB02 — PGP Co-occurrence (H1): ✅ Correct and complete
All cells have saved outputs. The fisher_pair() function builds the 2×2 contingency table correctly ([[both, a_only], [b_only, neither]]). BH-FDR correction is applied across all 10 pairs. Reported numbers in REPORT (pqqC × acdS OR = 7.24, n = 286, q = 1.2e-83; nifH × hcnC OR = 0.23, q = 5.8e-29) match notebook output exactly.
NB03 — Environmental Selection (H2): ✅ Correct and complete
All cells have saved outputs. The enrichment_test() function correctly orients the contingency table (soil+ vs soil−, gene+ vs gene−). The phylum-stratified analysis runs on 18 qualifying phyla and the strict-rhizosphere sensitivity analysis correctly re-runs within the soil subset. All reported effect sizes (acdS OR = 7.02, q = 5.15e-62; strict rhizosphere OR = 10.59) match notebook outputs.
The phylum-controlled logistic regression for ipdC returns OR = 0.558, p = 0.027, indicating soil depletion of ipdC — opposite to the raw Fisher's direction (OR = 0.79, ns). The REPORT discusses the soil reversal in the H4 context but does not explicitly reconcile why the phylum-controlled H2 logit shows soil depletion while the raw H2 Fisher's test is non-significant. See Suggestion 4.
NB04 — Core vs Accessory (H3): ✅ Correct and complete
All cells have saved outputs. The code correctly partitions is_auxiliary & ~is_singleton for true auxiliary clusters and is_singleton separately (consistent with pangenome table semantics documented in pitfalls.md: singletons ⊂ auxiliary). Chi-square tests compare observed core/non-core counts against the weighted genome-wide baseline (46.8% core), which is computed correctly from summing across all species in pangenome_stats. The Spearman correlation (ρ = −0.195, p = 2.0e-97) matches REPORT.
NB05 — Tryptophan → IAA (H4): ✅ Mostly correct; one REPORT citation inconsistency
All cells have saved outputs. Fisher's exact test (OR = 2.808, p = 6.31e-10), logistic Model 1 (OR = 2.808, p = 1.36e-08), logistic Model 2 (OR_trp = 2.874), and stratified results (soil: OR = 0.30, p = 0.02; non-soil: OR = 3.56, p = 7.69e-13) are all present and clearly shown.
REPORT logit OR citation ambiguity. NB05 cell 7 shows: Model 1 OR = 2.808; Model 2 OR_trp = 2.874. The REPORT H4 section cites: "logit OR = 2.81, 95% CI 1.97–4.01, p = 1.4e-08." The OR of 2.81 and CI match Model 1. However, the sentence immediately precedes reference to Model 2 (trp + is_soil). The REPORT should clarify which model's OR is being cited (Model 1 for the OR, or Model 2 if that is preferred). The difference is small (2.808 vs 2.874) but should be explicit.
Model 3 failure correctly disclosed. The REPORT states: "A phylum + soil logistic model (Model 3) was attempted but failed due to quasi-complete separation caused by ipdC's rarity across phyla (214 species, 1.9%)" — this is accurate and appropriately disclosed.
Negative control result is interpretable. The tyr → ipdC association (OR = 3.62) being similar to trp → ipdC (OR = 2.81) is correctly explained via TyrR regulatory circuitry (Ryu & Patten 2008, PMID 18757531). This is a well-handled result.
SQL and pitfall compliance
| Pitfall from docs/pitfalls.md | Status |
|---|---|
ncbi_isolation_source direct column (not EAV ncbi_env) |
✅ Correctly used |
metabolic_category = 'aa' for GapMind amino acid pathways |
✅ Correctly used |
sequence_scope = 'core' for GapMind |
✅ Correctly used |
GapMind multiple rows per genome-pathway: use MAX() + GROUP BY |
✅ Correctly handled |
JOIN taxonomy on genome_id (not gtdb_taxonomy_id) |
✅ Correctly used |
| CAST pangenome numeric columns from Spark string types | ✅ Applied in NB01 cell 13 |
order reserved word requires backtick quoting in Spark SQL |
❌ Unquoted t.order in NB01 cell 8 (latent bug) |
Findings Assessment
H1 (PGP syndrome): SUPPORTED. The pqqC × acdS co-occurrence (OR = 7.24, n = 286) is the strongest result and well-supported by literature. The finding that nifH is negatively associated with pqqC (OR = 0.57) and hcnC (OR = 0.23) — creating a separate diazotroph guild — is a genuine and novel contribution at this scale. The nuance (only 157 species carry ≥3 traits; the "syndrome" is primarily a pqqC–acdS module) is honestly stated.
H2 (Soil enrichment): SUPPORTED. The acdS soil enrichment (OR = 7.02) surviving phylum fixed effects (logit OR = 6.98) and strict-rhizosphere sensitivity (OR = 10.6) is a robust, highly significant result. The unexpected nifH depletion in soil is correctly presented with appropriate literature support (Wardell et al. 2022). Acknowledging the NCBI clinical sampling bias (only 5.9% of species classified as soil/rhizosphere-dominant) as a limitation is appropriate and honest.
H3 (HGT/accessory): REJECTED. All 13 PGP genes are significantly MORE core than the 46.8% genome-wide baseline. This clear rejection of the HGT hypothesis is honestly presented. The pqqD outlier (55.5% core, highest singleton fraction) is appropriately called out. The pangenome openness correlation (ρ = −0.195) provides independent corroboration. The REPORT's interpretation — stable ecological specialization rather than HGT-driven gene accumulation — is well-argued.
H4 (trp → ipdC coupling): PARTIALLY SUPPORTED. The Fisher's result (OR = 2.81, p = 6.3e-10) is solid. The soil-reversal finding (in soil species, trp-complete predicts lower ipdC prevalence, OR = 0.30) is a genuinely interesting secondary result. The REPORT's mechanistic interpretation (soil PGPB obtain tryptophan exogenously from root exudates, relaxing biosynthetic pressure while retaining ipdC) is speculative but scientifically plausible and correctly flagged as hypothesis-generating. The Limitations section correctly identifies that controlling for genome-wide pathway completeness would be needed to isolate the specific trp–ipdC signal.
REPORT accuracy: Checked key numbers — all match notebook outputs exactly (pqqC × acdS OR, nifH depletion, acdS soil enrichment, chi-square baselines, Spearman ρ, Fisher H4 OR/p, stratified ORs). The REPORT correctly distinguishes ipdC species count (214) from cluster count (226). No unsupported numbers found.
Limitations section is specific and honest: environment classification noise, gene-name-only search (misses product-description-annotated genes), no functional validation of truncated/pseudogenized genes, low ipdC prevalence limiting stratified power, and the GapMind pathway-completeness confound. All relevant.
Suggestions
-
[Critical] Fix the
t.orderreserved word in NB01 cell 8. Changet.ordertot.`order`in the Spark SQL query. This is exactly Pitfall #7 from the RESEARCH_PLAN but was not applied to the implemented code. The bug is currently latent becausegenome_environment.csvis cached; it will surface if the cache is cleared or the query is re-run. After fixing, re-execute NB01 on BERDL JupyterHub and save the notebook with live Spark outputs to replace the cache-only run. -
[Moderate] Clarify the logit OR citation in the H4 REPORT section. The REPORT cites "logit OR = 2.81, 95% CI 1.97–4.01, p = 1.4e-08" — these values match Model 1 (trp only). However, Model 2 (trp + is_soil) gives OR_trp = 2.874. The text should explicitly name the model being cited (e.g., "Model 1: trp only, OR = 2.81") to avoid ambiguity about whether soil adjustment was applied.
-
[Moderate] Clarify the ipdC soil enrichment paradox between H2 and H4. H2 finds ipdC non-enriched in soil (raw OR = 0.79, ns; phylum-controlled OR = 0.558, p = 0.027 soil-depleted), while H4's stratified analysis finds the trp→ipdC positive coupling only in non-soil species. These two results are related but the REPORT discusses them in separate sections without a cross-reference. A brief sentence in either the H2 or H4 interpretation section explicitly connecting the ipdC soil-depletion pattern across both analyses would help readers follow the logic.
-
[Minor] Explain the nifH cluster count discrepancy more prominently. NB01 cell 4 notes "nifH clusters = 2,756 (expected ~1,913 at plan time)" — a 43% excess — in a print statement. The inline explanation ("reflects DB growth since plan was written") is sufficient for a notebook but deserves a brief acknowledgment in the RESEARCH_PLAN's Revision History or the REPORT's Dataset Scale section, since the plan's expected-outcome section (H1: "nifH × pqqC pair co-occurrence supported") was calibrated against the older count.
-
[Minor] Add a comment explaining why
score_simplifiedvalues are binary (0.0 / 1.0). NB01 cell 15 extracts GapMind trp completeness viaMAX(score_simplified)and NB05 cell 3 shows the values are only[0.0, 1.0]. Thescore_simplifiedcolumn's binary nature is not explained. A brief comment noting that GapMindscore_simplifiedencodes pathway completeness as 0/1 (fromsequence_scope = 'core') would help readers who expect a continuous score. -
[Nice-to-have] Consider adding a figure to visualize the nifH ecological guild separation. The diazotroph-vs-non-diazotroph finding from H1 and H2 (nifH negatively associated with pqqC/hcnC; nifH depleted in soil) is a strong secondary finding described primarily in prose. A simple phylum-stratified bar chart showing nifH vs pqqC/acdS prevalence across the top 8 phyla would make this guild-separation result visually striking and more accessible to readers.
This review was generated by an AI system. It should be treated as advisory input, not a definitive assessment.
Visualizations
Cooccurrence Combinations
Cooccurrence Heatmap
Env Enrichment Barplot
Nb01 Pgp Prevalence
Openness Vs Pgp
Pgp Core Accessory Pie
Trp Iaa Contingency
Notebooks
01_data_extraction.ipynb
01 Data Extraction
View notebook →
02_pgp_cooccurrence.ipynb
02 Pgp Cooccurrence
View notebook →
03_environmental_selection.ipynb
03 Environmental Selection
View notebook →
04_core_accessory_status.ipynb
04 Core Accessory Status
View notebook →
05_tryptophan_iaa.ipynb
05 Tryptophan Iaa
View notebook →