PaperBLAST Data Explorer
CompletedResearch Question
What does the kescience_paperblast collection contain, how current is it, and what are its coverage patterns across organisms, domains of life, and functional databases?
Research Plan
Hypothesis
This is a data characterization project, not a hypothesis-driven analysis. The goal is to produce a reference document describing the PaperBLAST collection on BERDL.
Revision History
- v2 (2026-02-22): Added Notebook 3 (sequence clustering) to plan
- v1 (2026-02-22): Initial plan and analysis complete
Overview
PaperBLAST (Price & Arkin, mSystems 2017) links protein sequences to scientific literature via text mining of PubMed Central. This project characterizes the BERDL-hosted copy: scale, taxonomic coverage, temporal currency, cross-database linkages, and limitations.
Key Findings
Finding 1: One organism dominates nearly half of all literature
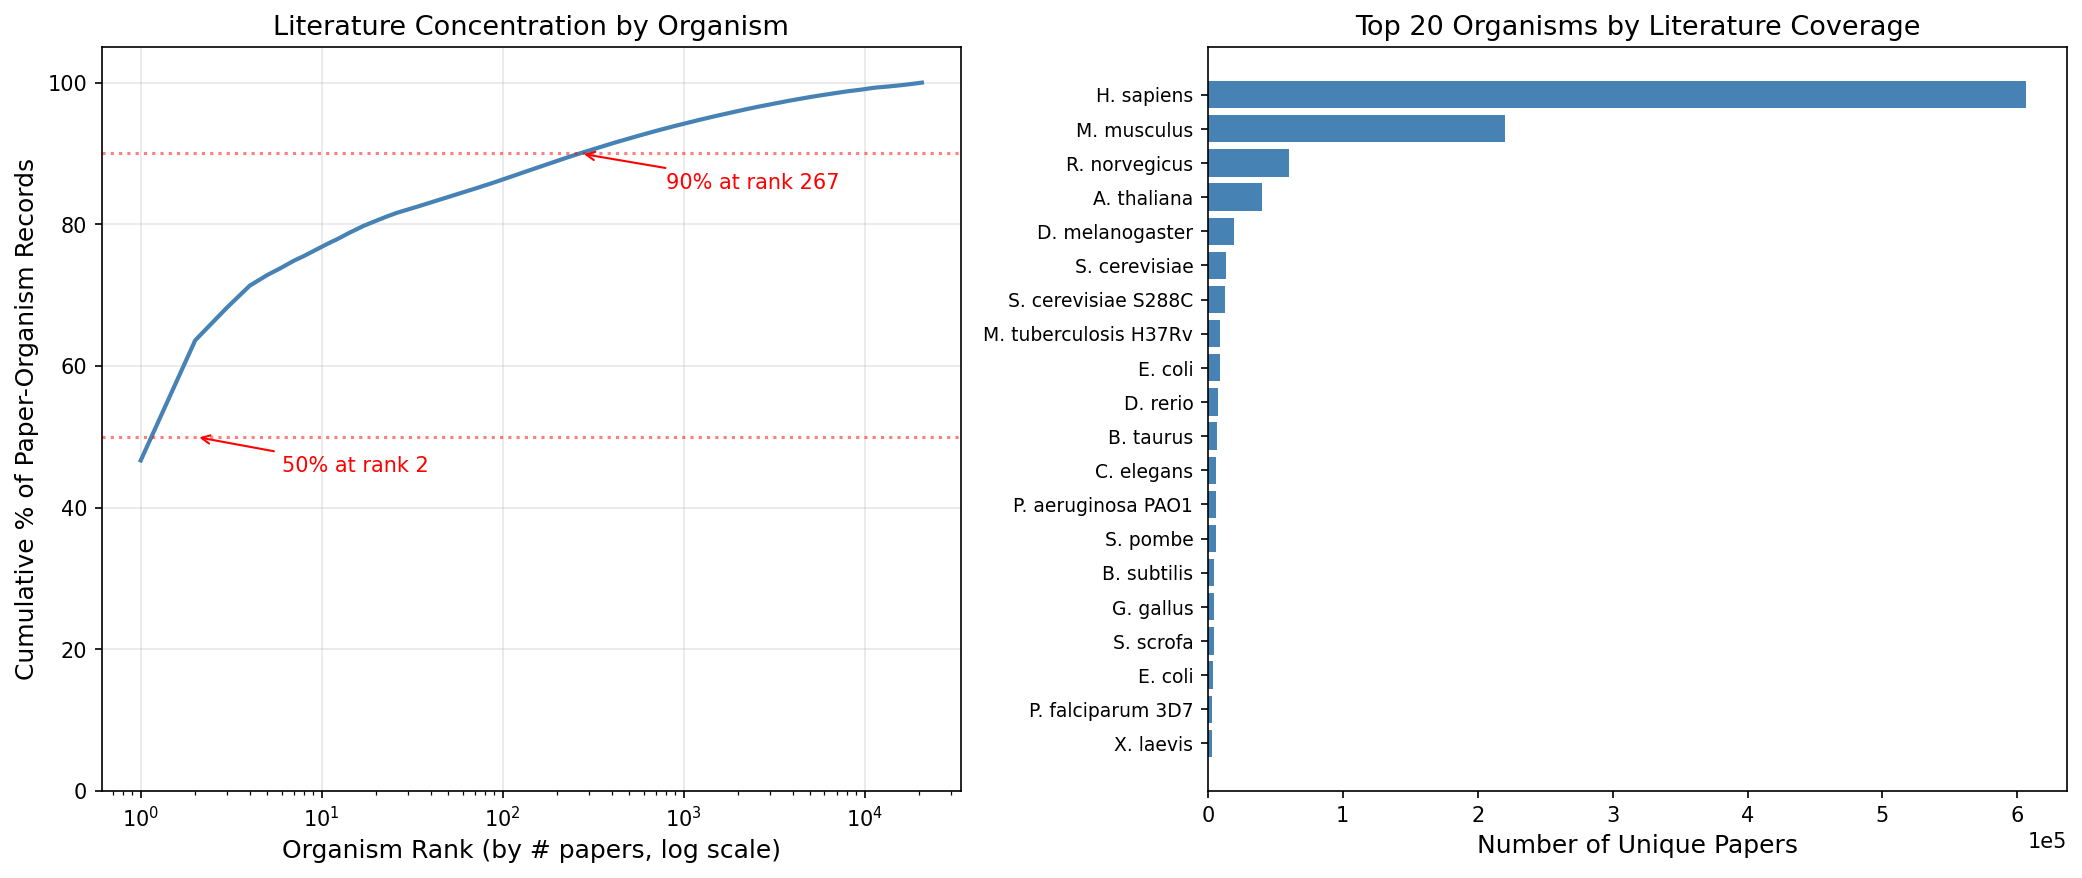
Homo sapiens alone accounts for 46.7% of all gene-paper records in PaperBLAST. The top 5 organisms (H. sapiens, M. musculus, R. norvegicus, A. thaliana, D. melanogaster) capture 72.8%. Of 20,723 organisms with any literature, the top 1,000 capture 94.2%, leaving the remaining 19,723 organisms sharing just 5.8% of the literature.
(Notebook: 02_coverage_skew.ipynb)
Finding 2: 65.6% of genes have exactly one paper
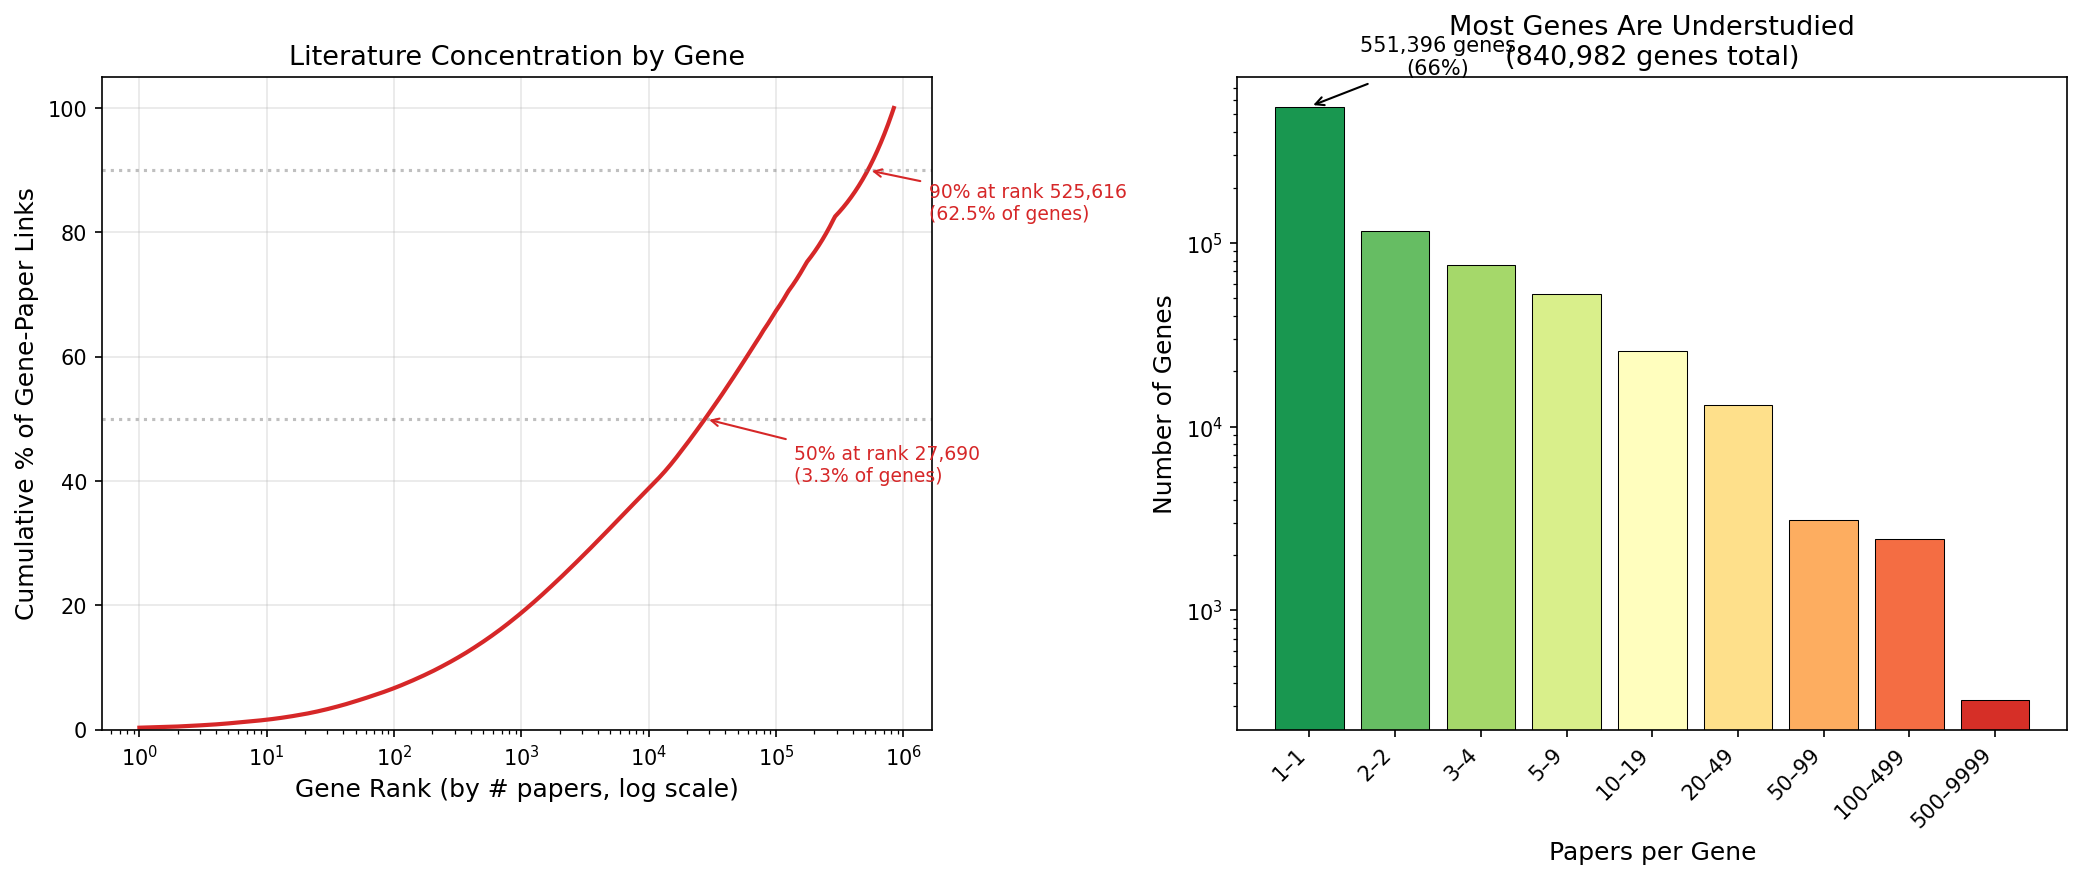
The distribution of papers per gene is extremely skewed. Of 841K genes with any text-mined paper link, 551K (65.6%) have exactly 1 paper. The median is 1, the mean is 3.8. The top 50 most-referenced genes are all human — led by p53 (9,988 papers), TNF (6,002), and EGFR (5,895). Just 6% of genes (50K) account for 57.7% of all gene-paper links.
(Notebook: 02_coverage_skew.ipynb)
Finding 3: Literature inequality is extreme — Lorenz curves
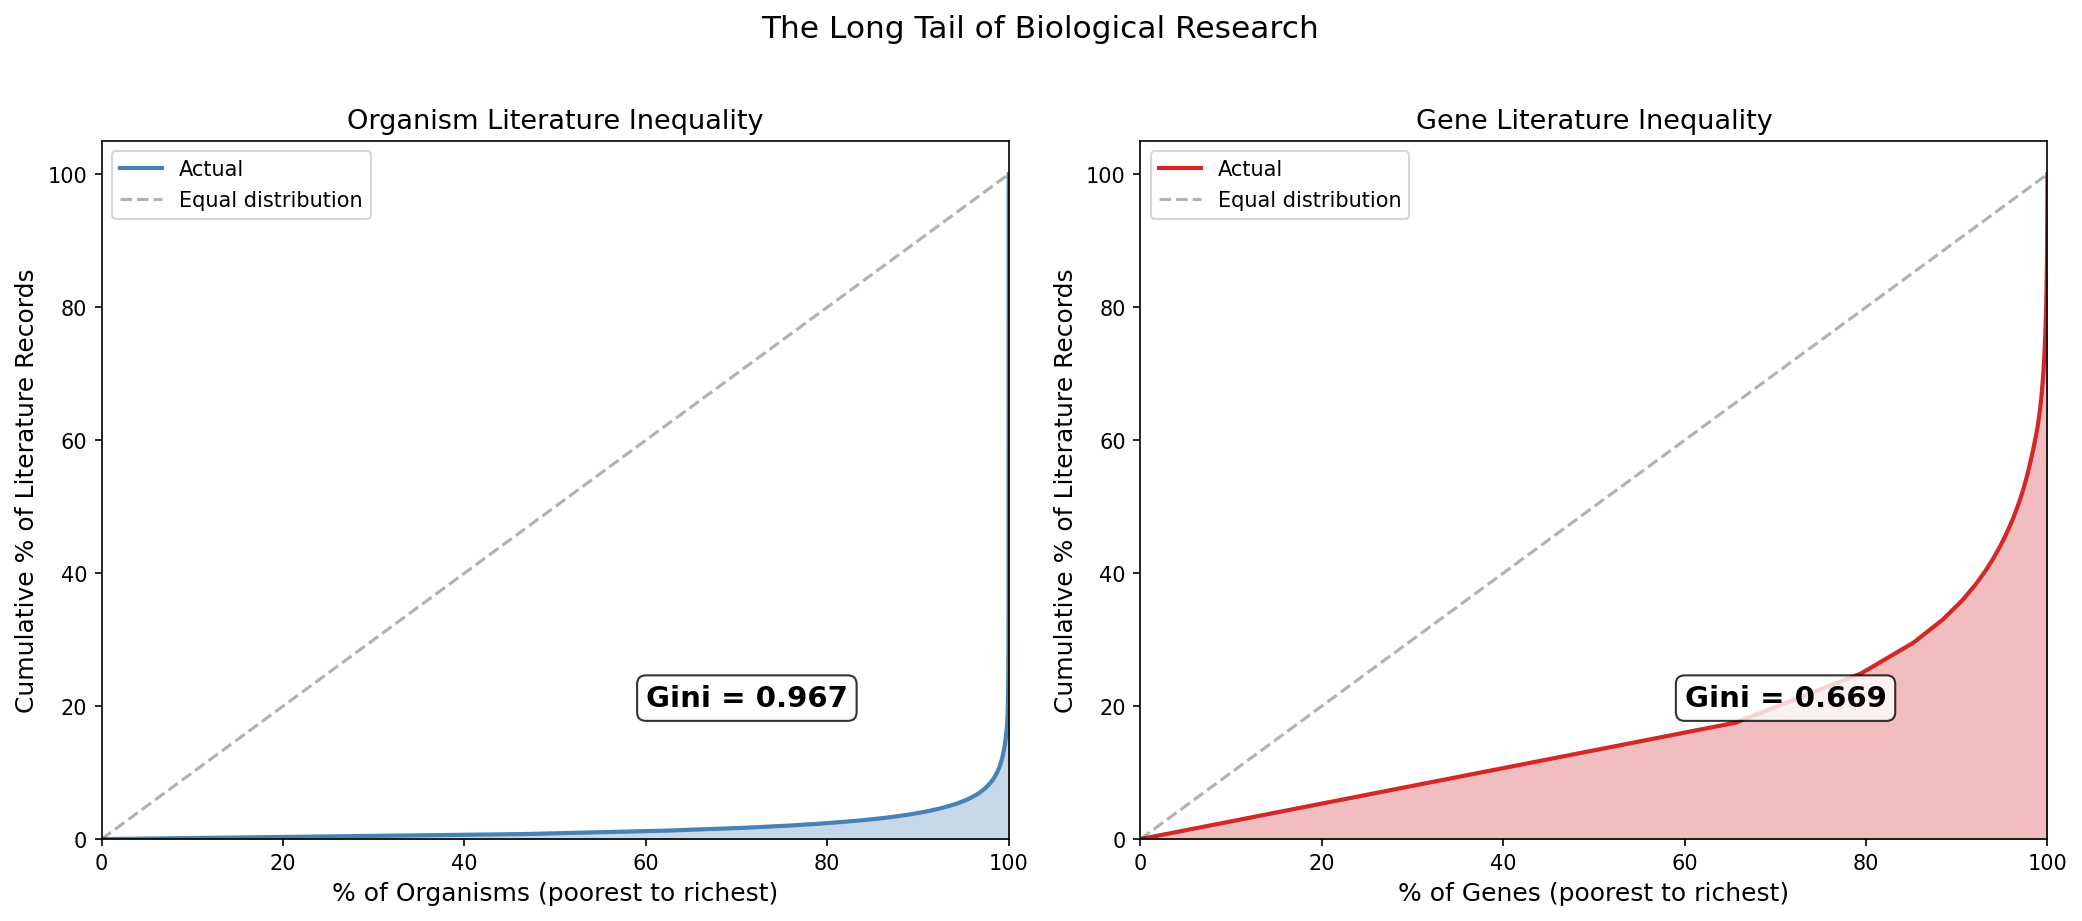
Lorenz curves quantify the inequality. For organisms, the Gini coefficient is 0.967 (where 1.0 is perfect inequality), indicating near-total concentration. For genes, the Gini is 0.669 — still very high. This mirrors wealth-inequality patterns in economics — a small fraction of biological entities receive nearly all research attention.
(Notebook: 02_coverage_skew.ipynb)
Finding 4: Bacterial research is concentrated on pathogens
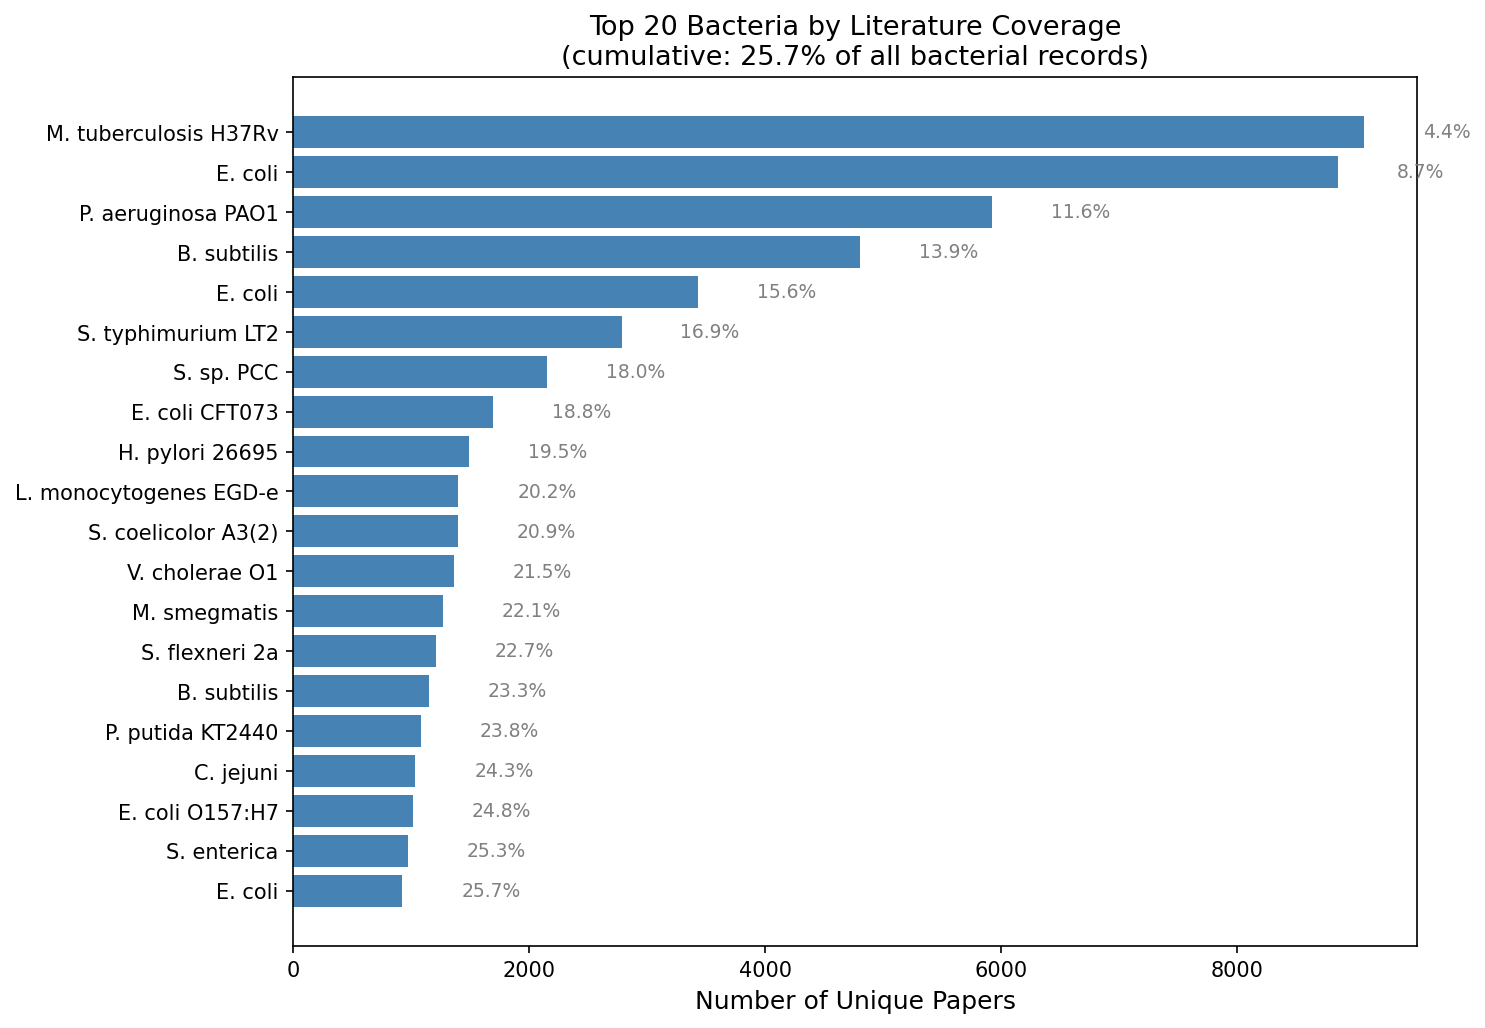
Among 15,312 bacterial organisms, the top 100 capture 44.3% of bacterial literature. The top 3 bacteria are all well-known pathogens or model organisms: M. tuberculosis H37Rv (9,079 papers), E. coli K-12 (8,860), and P. aeruginosa PAO1 (5,928). Environmental and non-pathogenic organisms are dramatically underrepresented.
(Notebook: 02_coverage_skew.ipynb)
Finding 5: 345K protein families from 816K sequences
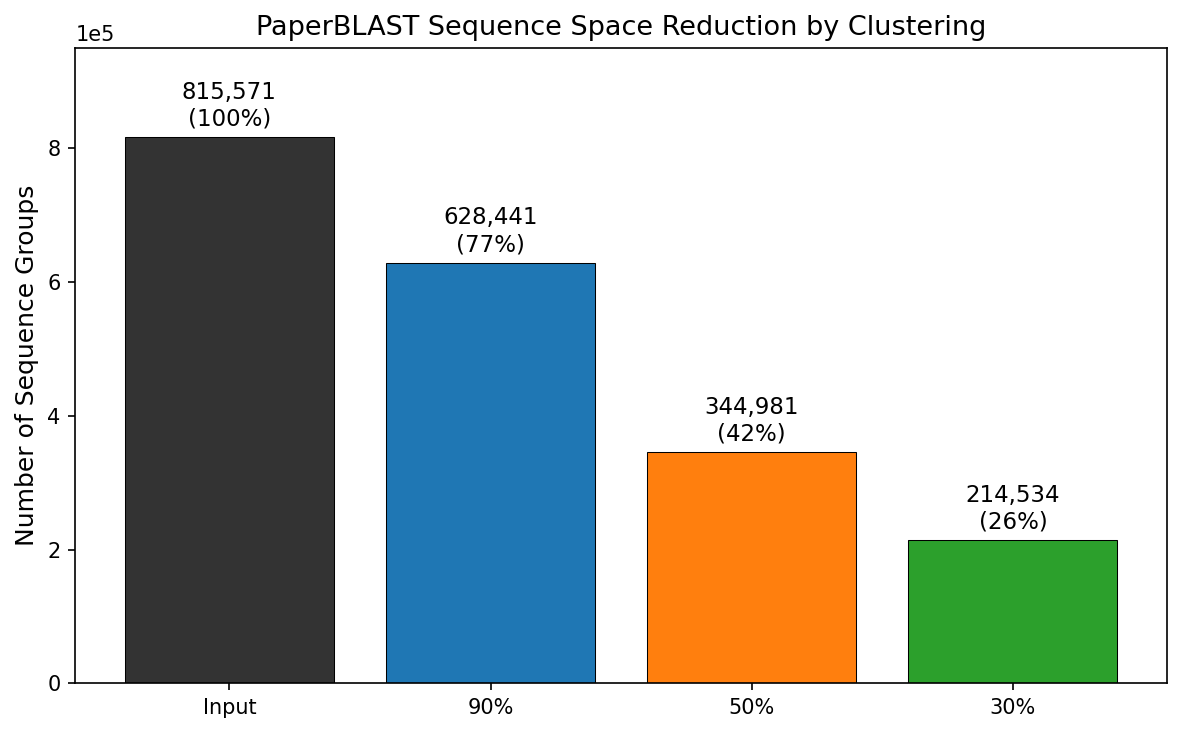
MMseqs2 clustering of 815,571 PaperBLAST protein sequences at three identity thresholds reveals: 628K clusters at 90% (77% — low strain-level redundancy), 345K at 50% (protein family level), and 215K at 30% (superfamily level). The largest families are housekeeping proteins: HSP70/BiP (650 members at 50%), GAPDH (609), enolase (552), GroEL (443).
(Notebook: 03_sequence_clustering.ipynb)
Finding 6: 55% of protein families are dark or dim
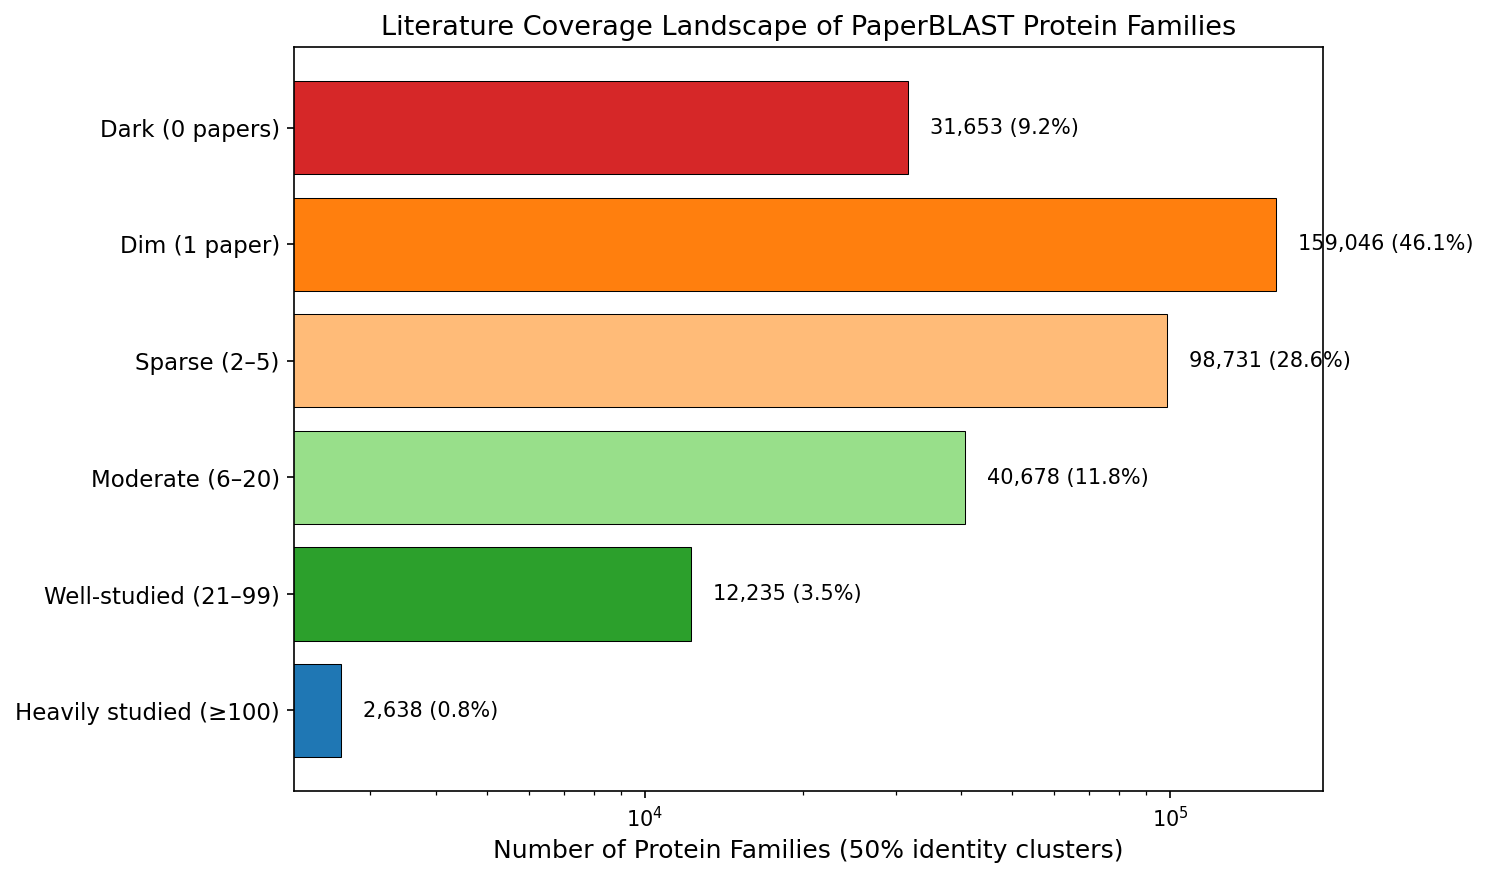
At 50% identity, 9.2% of protein families (31,653) have zero papers across all members, and 46.1% (159,046) have exactly 1 paper. Only 4.3% of families (14,904) have 20 or more papers. 5,218 multi-member families — representing 14,534 sequences — have no literature whatsoever. These are the "dark" protein families.
(Notebook: 03_sequence_clustering.ipynb)
Results
Database Scale and Structure
The kescience_paperblast collection on BERDL contains 12.4 million rows across 14 tables. The core data structure links genes to papers through text mining of PubMed Central full-text articles, supplemented by curated annotations from 13 databases and structural data from the PDB.
| Table | Rows | Description |
|---|---|---|
| genepaper | 3,195,890 | Gene-to-paper links (text-mined) |
| site | 2,089,192 | PDB binding/active/modified sites |
| snippet | 1,951,949 | Text excerpts mentioning genes |
| generif | 1,358,798 | GeneRIF functional summaries |
| gene | 1,135,366 | Gene/protein metadata |
| uniq | 815,571 | Unique protein sequences |
| curatedpaper | 599,587 | Curated gene-paper links |
| curatedgene | 255,096 | Curated annotations (SwissProt, BRENDA, etc.) |
(Notebook: 01_paperblast_overview.ipynb)
Temporal Coverage
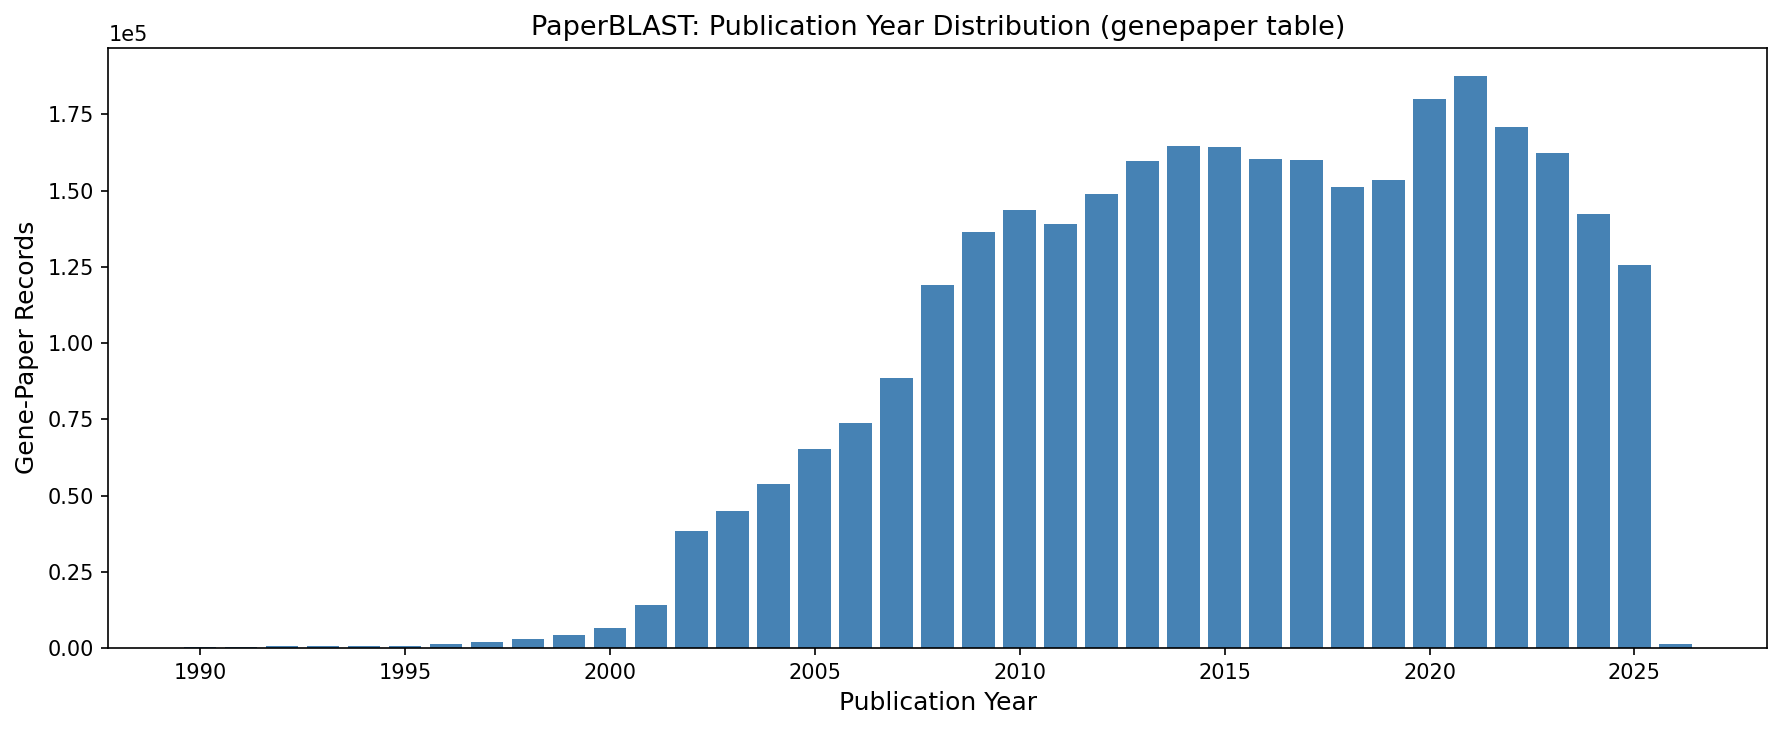
The database covers papers from 1951 to 2026. Publications peak around 2020–2021, with 30.6% of records from 2020 onwards. The 2025 data includes 125,438 records from 22,271 papers. 1,425 records from 2026 are present, indicating the snapshot was taken in early 2026.
(Notebook: 01_paperblast_overview.ipynb)
Taxonomic Coverage
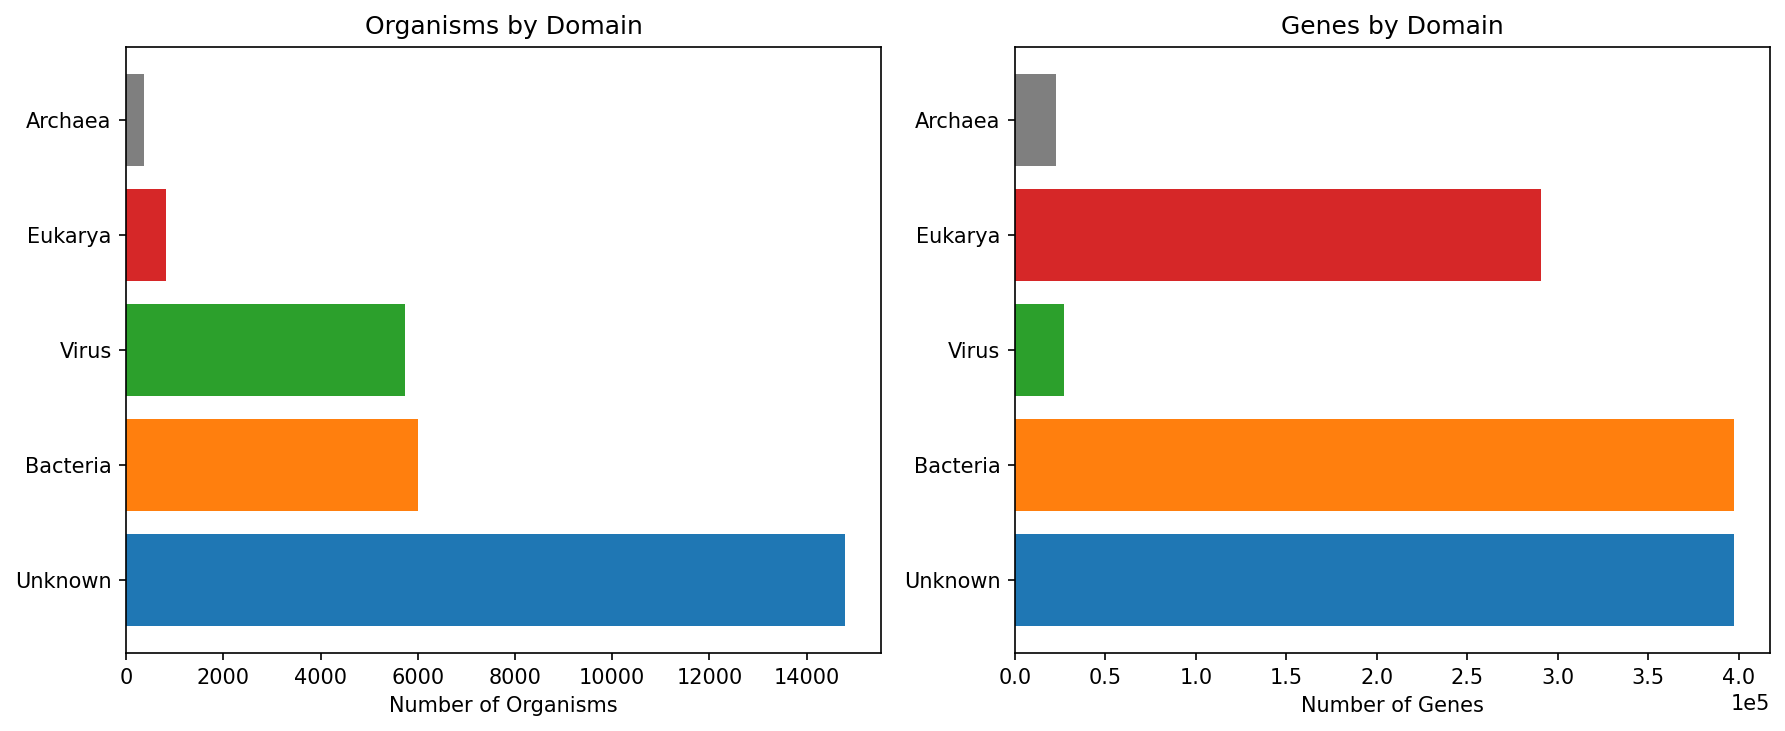
The 1.1M genes span 27,718 organisms across all domains of life. Bacteria dominate by organism count (6,000) but Eukarya dominate by gene count (291K) due to the massive over-representation of human and model organism genes. 14,798 organisms fell into an "Unknown" domain classification, indicating that the database includes many organisms not easily classified by name heuristics alone.
| Domain | Organisms | Genes | % of Genes |
|---|---|---|---|
| Bacteria | 5,997 | 397,544 | 35.0% |
| Unknown | 14,798 | 397,511 | 35.0% |
| Eukarya | 822 | 290,537 | 25.6% |
| Virus | 5,730 | 27,199 | 2.4% |
| Archaea | 371 | 22,575 | 2.0% |
(Notebook: 01_paperblast_overview.ipynb)
Papers per Gene: The Many-to-Many Structure
845K genes are linked to 1.1M unique papers via 3.2M many-to-many associations. Each gene averages 3.8 papers and each paper mentions 2.9 genes. The similar counts (~1.1M each) are somewhat coincidental — driven by the fact that most genes have few papers and most papers mention few genes. 25.6% of genes in the gene table (290K) have no text-mined paper link at all and rely solely on curated or GeneRIF annotations.
(Notebook: 02_coverage_skew.ipynb)
Curated Databases
SwissProt contributes the most curated entries (110K proteins, 182K unique papers). PaperBLAST includes approximately 19% of the full SwissProt database (~570K reviewed entries as of 2024) — the subset that could be matched to PMC open-access literature. EcoCyc has the highest paper density per protein (5.3), reflecting its deep curation of E. coli metabolism.
| Database | Proteins | Papers | Papers/Protein |
|---|---|---|---|
| SwissProt | 110,171 | 181,916 | 1.7 |
| biolip | 42,571 | 23,768 | 0.6 |
| BRENDA | 33,012 | 43,760 | 1.3 |
| MetaCyc | 12,700 | 46,176 | 3.6 |
| EcoCyc | 4,198 | 22,304 | 5.3 |
(Notebook: 01_paperblast_overview.ipynb)
Structural Data
PaperBLAST includes site annotations for 132,179 PDB structures with 2.1M site records across 4 types: binding (1.69M), functional (182K), modified (112K), and mutagenesis (104K). The 48,991 unique ligands are topped by zinc ions (65K sites), chlorophyll A (58K), calcium ions (53K), and heme (44K).
(Notebook: 01_paperblast_overview.ipynb)
Sequence Clustering
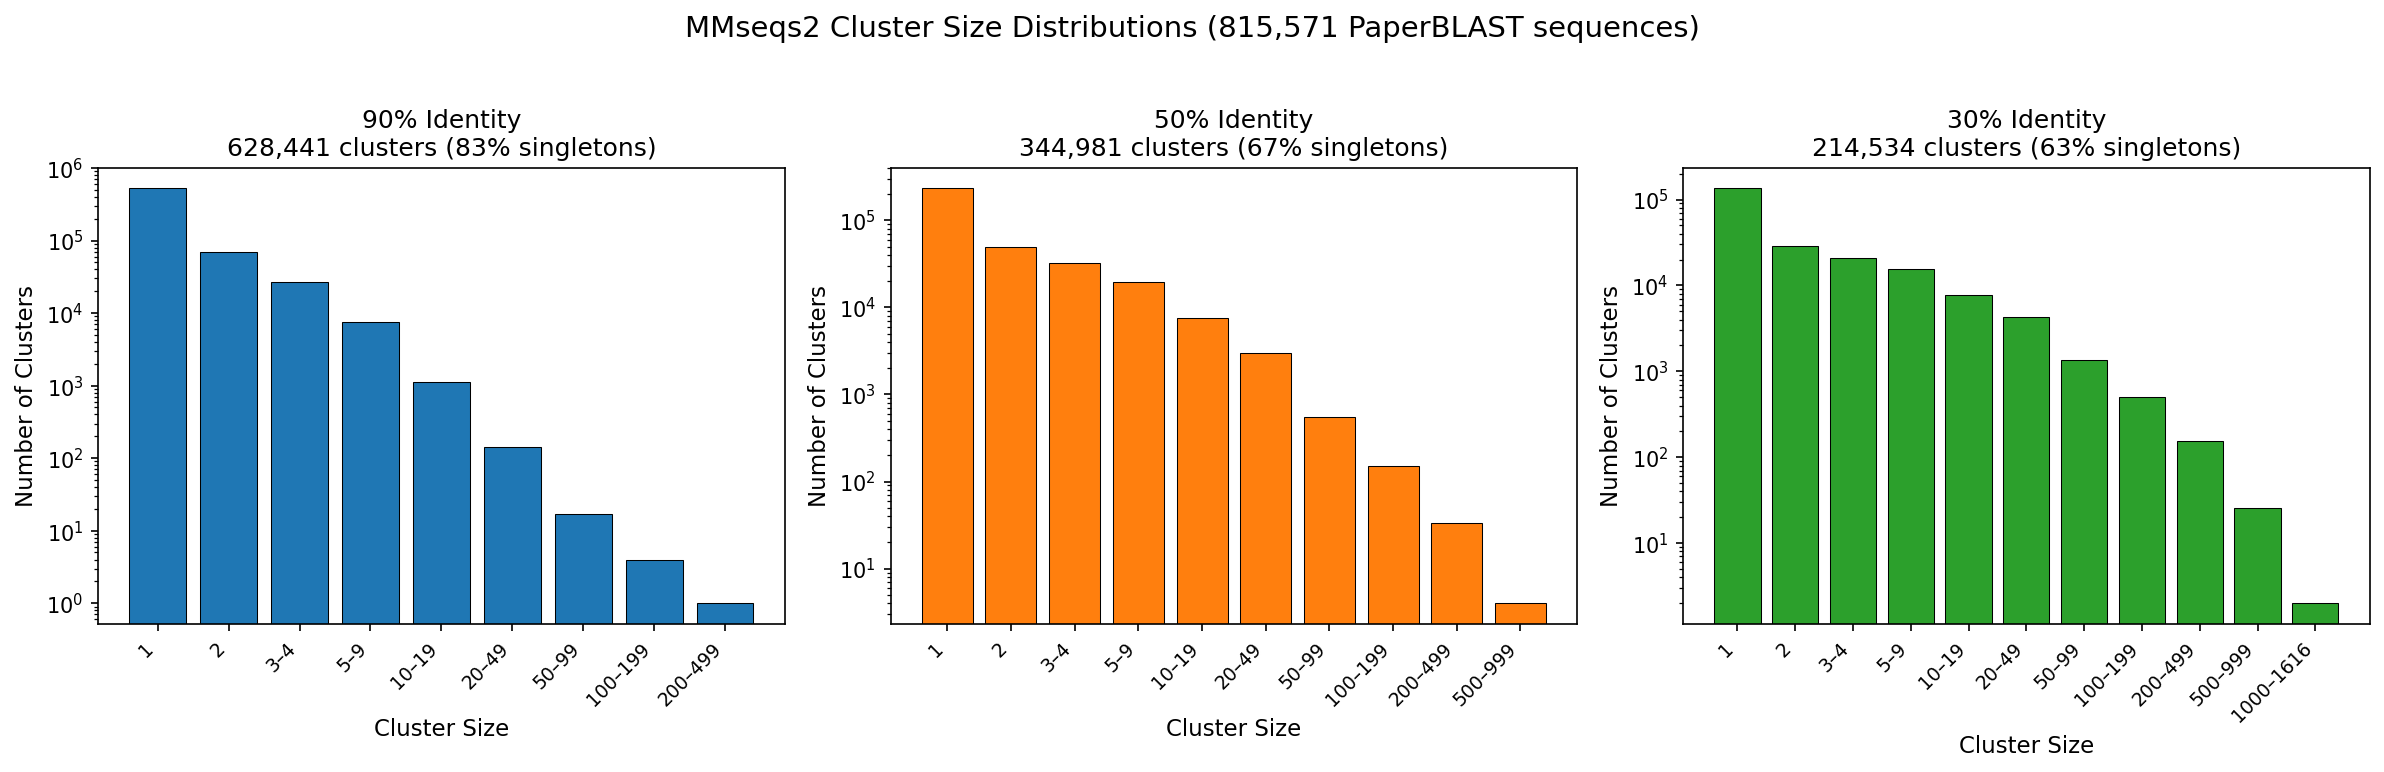
At 90% identity, 83.3% of clusters are singletons — indicating that most PaperBLAST sequences are already non-redundant at the strain level. The largest 90% cluster is actin (212 members). At 50% identity, 67.5% are singletons; at 30%, 62.8%.
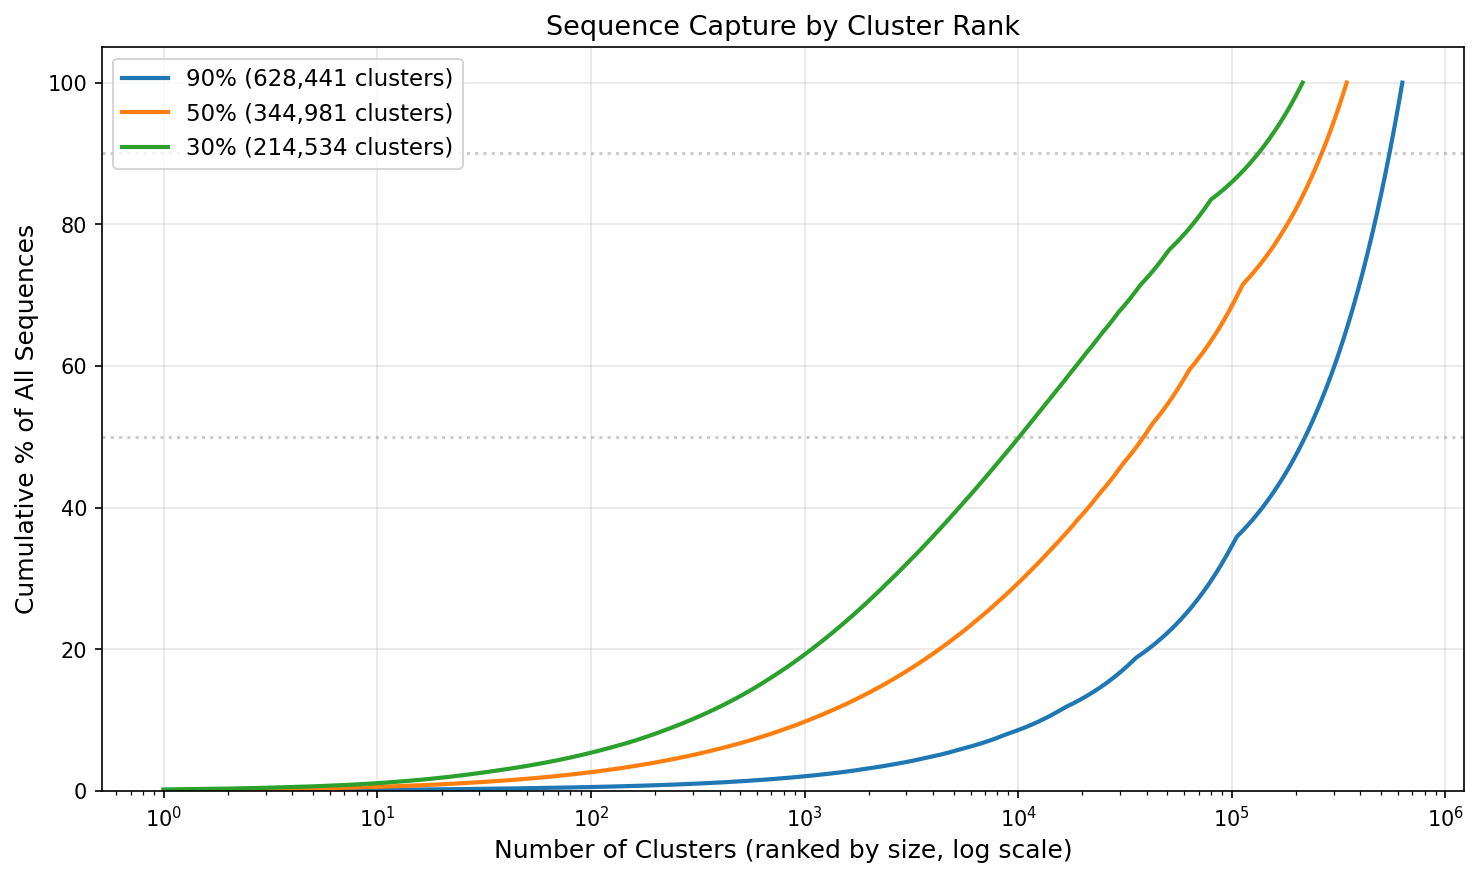
The cumulative capture curves show that at 30% identity, a relatively small number of large superfamily clusters capture a substantial fraction of all sequences, while the long tail of singleton families accounts for the remainder.
Clustering and Literature: Larger Families Are Better Studied
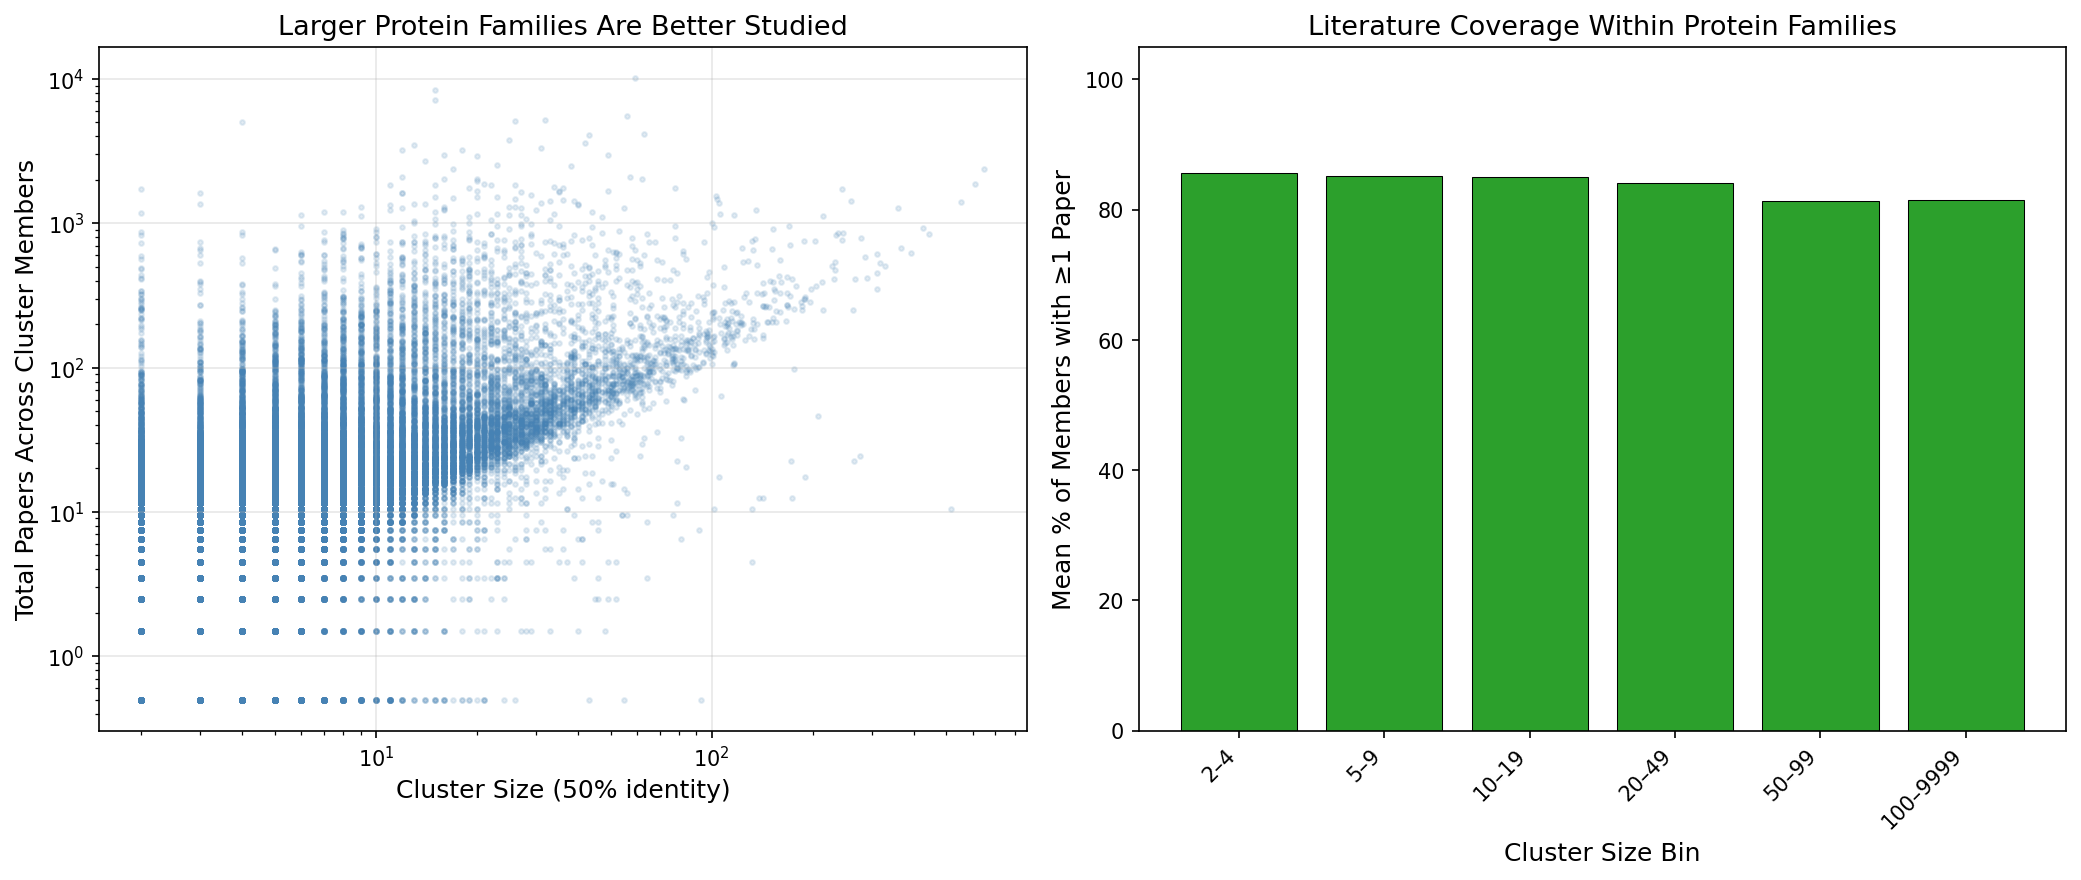
There is a positive relationship between protein family size and literature coverage. 95.4% of multi-member 50% identity clusters have at least one member with a paper, but the remaining 4.6% (5,218 families) represent genuinely unstudied protein families. The "dark" families are dominated by REBASE methyltransferases and biolip structural entries — highly specialized proteins that lack published functional studies.
(Notebook: 03_sequence_clustering.ipynb)
Papers per Gene Distribution
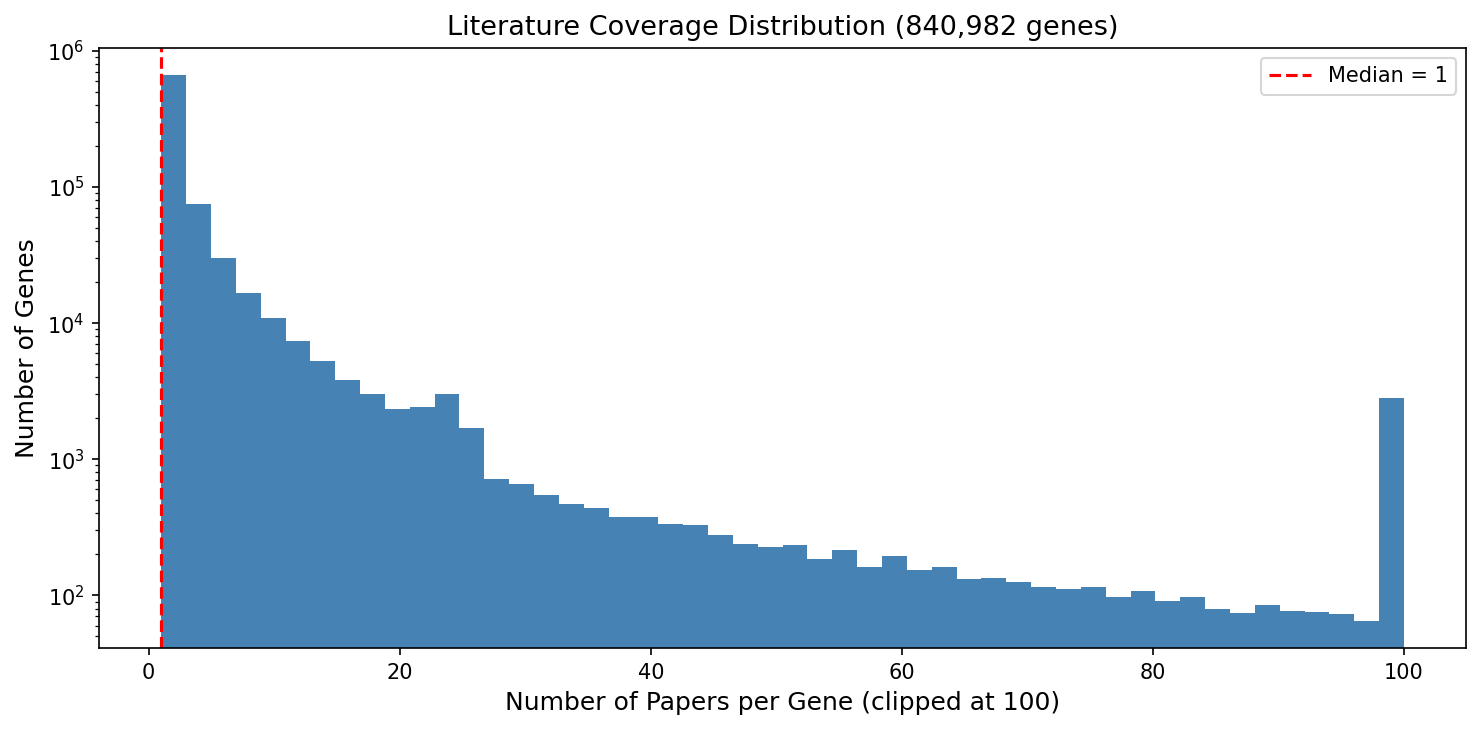
The log-scale histogram reveals the extreme right skew of the papers-per-gene distribution. The vast majority of genes cluster at 1 paper, with a long tail extending to nearly 10,000 papers for p53.
(Notebook: 01_paperblast_overview.ipynb)
Interpretation
Literature Context
The extreme concentration of biological research on a small number of genes and organisms is well-documented. Stoeger et al. (2018) showed that the most-studied human genes continue to attract the most new research, creating a self-reinforcing "rich-get-richer" dynamic. They demonstrated that gene attention can be predicted from a small set of chemical, physical, and biological properties — meaning the bias is systematic, not random. Our finding that the top 50 genes are exclusively human cancer/disease genes is consistent with their analysis.
The concept of "dark" or poorly characterized protein families aligns with work on the "dark proteome" by Perdigao et al. (2015), who estimated that approximately 40% of protein residues fall in "dark" regions with no structural or functional information. Our finding that 55% of protein families at 50% identity have 0 or 1 papers extends this observation to the literature domain. Rocha et al. (2023) coined the term "functional unknomics" to describe the systematic study of conserved genes of unknown function, noting that significant and unexplored biology is encoded in the unstudied portion of genomes.
The PaperBLAST database itself was created by Price & Arkin (2017) specifically to address the challenge of connecting protein sequences to relevant literature. Their follow-up work on interactive tools for functional annotation (Price & Arkin, 2024) and Curated BLAST (Price & Arkin, 2019) further developed the approach of using literature text mining to aid gene function discovery.
Novel Contribution
This analysis provides the first comprehensive characterization of the BERDL-hosted PaperBLAST collection at the protein family level. By combining sequence clustering with literature coverage data, we quantify the "dark matter" of protein biology: 5,218 multi-member protein families (at 50% identity) have zero literature coverage. The Lorenz curve analysis and per-domain breakdowns provide presentation-ready figures for communicating the magnitude of the research coverage gap.
The cross-database linkage analysis reveals that 129,823 VIMSS cross-references connect PaperBLAST to the Fitness Browser, creating a path from literature coverage to experimental fitness phenotypes — a resource for identifying functionally important but understudied genes.
Limitations
- Text mining ≠ functional characterization: A gene mentioned in a paper may be tangential to the study. The 65.6% with 1 paper likely includes many incidental mentions.
- PMC open-access only: PaperBLAST only mines full-text from PubMed Central. Papers behind paywalls are missed, creating a systematic bias against fields/journals with lower open-access rates.
- Domain classification is approximate: The heuristic organism-to-domain mapping classified 35% of organisms as "Unknown." A formal taxonomy lookup would improve accuracy.
- Clustering identity thresholds are arbitrary: The 50% identity cutoff for "protein family" is conventional but does not correspond to a universal biological boundary.
- SwissProt coverage is partial: Only 19% of SwissProt is in PaperBLAST, likely because many SwissProt entries lack matching PMC full-text. This means curated knowledge exists for many proteins that PaperBLAST cannot connect to.
- No negative controls: We cannot easily distinguish genes that are genuinely unstudied from genes whose literature was missed by text mining.
Future Directions
- Cross-reference with Fitness Browser: Use the 130K VIMSS links to identify fitness-important genes that lack literature — candidates for "high-impact understudied genes."
- Formal taxonomy integration: Replace heuristic domain classification with NCBI taxonomy lookup to accurately quantify Bacteria/Archaea/Eukarya/Virus coverage.
- Temporal trend analysis: Track whether literature concentration is increasing or decreasing over time — are we studying a broader or narrower set of genes each year?
- Dark family characterization: For the 5,218 dark protein families, use AlphaFold structure prediction and domain annotation to infer putative functions.
- Literature graph analysis: Build a gene-gene co-citation network from genepaper data to identify functionally related but differentially studied gene clusters.
Data
Sources
| Collection | Tables Used | Purpose |
|---|---|---|
kescience_paperblast |
genepaper, gene, snippet, generif, curatedgene, curatedpaper, uniq, site, hassites, pdbligand, paperaccess, seqtoduplicate, pdbclustinfo, seqhassite |
All 14 tables — gene-paper links, metadata, sequences, structural data |
Generated Data
| File | Rows | Description |
|---|---|---|
data/organism_gene_counts.csv |
27,718 | Gene counts per organism with domain classification |
data/year_distribution.csv |
74 | Publication year distribution (1951–2026) |
data/curated_databases.csv |
13 | Curated database breakdown |
data/papers_per_gene.csv |
840,982 | Paper count per gene |
data/top50_organisms.csv |
50 | Top 50 organisms by paper count |
data/top50_genes.csv |
50 | Top 50 genes by paper count |
data/cluster_sizes_90pct.csv |
628,441 | Cluster sizes at 90% identity |
data/cluster_sizes_50pct.csv |
344,981 | Cluster sizes at 50% identity |
data/cluster_sizes_30pct.csv |
214,534 | Cluster sizes at 30% identity |
data/cluster_literature_50pct.csv |
344,981 | Cluster-level literature coverage at 50% identity |
data/clustering_summary.txt |
— | MMseqs2 clustering summary |
Remote Data (MinIO)
| Path | Description |
|---|---|
cts/io/psdehal/paperblast_explorer/all_sequences.fasta |
815,571 protein sequences (380 MB) |
cts/io/psdehal/output/mmseqs_full/ |
Raw MMseqs2 clustering output TSVs |
References
- Price MN, Arkin AP. (2017). "PaperBLAST: Text Mining Papers for Information about Homologs." mSystems 2:e00039-17. PMID: 28845461.
- Price MN, Arkin AP. (2019). "Curated BLAST for Genomes." mSystems 4:e00072-19. PMID: 31164459.
- Price MN, Arkin AP. (2024). "Interactive tools for functional annotation of bacterial genomes." Database 2024:baae089.
- Stoeger T, Gerlach M, Morimoto RI, Nunes Amaral LA. (2018). "Large-scale investigation of the reasons why potentially important genes are ignored." PLoS Biol 16:e2006643. PMID: 30226837.
- Perdigao N, Heinrich J, Stolte C, et al. (2015). "Unexpected features of the dark proteome." Proc Natl Acad Sci USA 112:15898-15903. PMID: 26627242.
- Rocha JJ, Jayaram SA, Stevens TJ, et al. (2023). "Functional unknomics: Systematic screening of conserved genes of unknown function." PLoS Biol 21:e3002222. PMID: 37590228.
- Arkin AP, Cottingham RW, Henry CS, et al. (2018). "KBase: The United States Department of Energy Systems Biology Knowledgebase." Nat Biotechnol 36:566-569. PMID: 29979655.
Data Collections
Review
Summary
This is a well-executed data characterization project that thoroughly profiles the kescience_paperblast collection on BERDL. The three notebooks flow logically from a database inventory (NB01) through literature concentration analysis (NB02) to sequence-level clustering (NB03), and all key findings are clearly documented in a comprehensive REPORT.md. The analysis uncovers genuinely interesting patterns — H. sapiens accounts for 46.7% of all gene-paper records, 65.6% of genes have exactly one paper, and 5,218 multi-member protein families have zero literature coverage — with appropriate caveats and strong literature framing. The main technical concerns are a Gini coefficient computation that requires ascending sort but receives descending-sorted data, a eukaryote (soybean, Glycine max) that slips into the top-20 bacteria list due to an incomplete exclusion filter, and a RESEARCH_PLAN that does not describe the sequence clustering notebook. These issues are fixable and do not invalidate the project's core findings.
Methodology
Research question: Clearly stated and appropriately scoped as a characterization study rather than a hypothesis test. The framing in RESEARCH_PLAN.md is honest about this distinction, which is appropriate.
Approach: Sound. Covering all 14 tables, measuring temporal currency, taxonomic breadth, literature concentration, and sequence-level redundancy gives a thorough portrait of the collection. The addition of MMseqs2 clustering (NB03) goes beyond the stated plan to useful effect.
Data sources: All 14 kescience_paperblast tables are used and cross-referenced. The CTS job ID (c10c4a0f-3d57-4219-9329-501b74c8f29a) for the MMseqs2 clustering run is documented, which aids reproducibility of NB03.
Gap — NB03 not in RESEARCH_PLAN: The sequence clustering analysis is a substantive third notebook that adds Finding 5 (345K protein families) and Finding 6 (dark families). It is not described in RESEARCH_PLAN.md at all. The plan should be updated to include it, or a note should explain that it was added after the initial plan was written.
Reproducibility gap in README: The ## Reproduction section only shows how to run NB01. NB02 is straightforward (loads NB01 outputs from data/), but NB03 requires the cluster TSV files (clusters_{30,50,90}pct.tsv) which are either pre-generated locally or must be downloaded from MinIO (cts/io/psdehal/...). A reader following the README would have no idea NB02 and NB03 exist or how to run them. The REPORT.md does document the dependency chain and CTS job, but that information belongs (at least summarized) in the README reproduction guide.
Code Quality
Spark usage: Excellent. All notebooks aggregate in Spark before calling .toPandas(). No full-table pulls. The COUNT(DISTINCT ...) aggregations, GROUP BY patterns, and use of direct spark.sql() are all appropriate. String-typed columns are handled correctly (e.g., CAST(year AS INT), CAST(protein_length AS INT)) — a pitfall that is documented in docs/pitfalls.md and properly avoided here.
Spark import: from berdl_notebook_utils.setup_spark_session import get_spark_session is used throughout, which is the correct import for JupyterHub notebooks. ✓
NB03 local execution: NB03 cleverly separates concerns — the heavy Spark queries (cluster representative lookups) are isolated to cells 7–8 and 15, while the main cluster analysis runs locally from TSV files. This allows downstream review without Spark access.
Bug — Gini coefficient computed on incorrectly sorted data (NB02, Cell 17): The Gini formula used requires values sorted in ascending order (smallest to largest), but org_papers_sorted and ppg_sorted are both sorted descending (largest first). For a distribution as skewed as this one, the formula will produce a negative value rather than a value near 1.0. The Lorenz curves themselves are also effectively inverted (anti-Lorenz: cumulative share starting from the richest) rather than the conventional form (starting from the poorest). The REPORT's prose conclusions about inequality (e.g., "1% of organisms receive the vast majority") remain valid because they derive from the cumulative-sum columns (cum_pct) rather than the Gini value, but the Gini numbers and the Lorenz curve shape in lorenz_curves.png should be reviewed and corrected. Fix: add .sort_values('n_papers', ascending=True).reset_index(drop=True) before computing Gini in both panels.
Bug — Glycine max misclassified as bacterium (NB02, Cell 19): The is_bacterium() heuristic excludes common eukaryotes by keyword but does not include 'glycine' in its exclusion list. As a result, Glycine max (soybean, rank 23 overall with 1,147 papers) appears at rank 16 in the top-20 bacterial list. This is a eukaryote, not a bacterium, and its presence inflates the top-20 list by displacing the actual 20th-ranked bacterium. The REPORT states "the top 3 bacteria are all well-known pathogens or model organisms" which is correct, but the top-20 figure and table contain an erroneous entry. Fix: add 'glycine ' to the euk exclusion keywords in is_bacterium().
Minor numerical inconsistency (NB03, Cells 10 vs 18): Cell 10 reports "Clusters with ≥100 papers: 2,638" (using >=), while the summary in Cell 18 uses > 100 (strictly greater) and prints 2,607. The REPORT cites 2,638, matching Cell 10. The discrepancy is small but the threshold definition (≥100 vs >100) should be made consistent, and the figure legend in literature_coverage_landscape.png should match the prose.
Notebook organization: All three notebooks follow a clean setup → query → analysis → visualization pattern with markdown section headers. The use of DATA_OUT and FIG_OUT path constants is good practice.
requirements.txt: Only pandas, numpy, and matplotlib are listed. This covers NB03 but omits the cluster-level dependency berdl_notebook_utils (needed for NB01/NB02) and does not specify Python version. The file is better than nothing but would benefit from a comment explaining that NB01/NB02 also require the BERDL JupyterHub environment.
Findings Assessment
Finding 1 (H. sapiens = 46.7%): Directly supported by Cell 3 of NB02 output. ✓
Finding 2 (65.6% of genes have 1 paper): Directly supported by Cell 12 of NB01 histogram output. ✓
Finding 3 (Lorenz curves): Qualitatively supported — the extreme concentration is real and visible. However, as noted under Code Quality, the Lorenz curve implementation uses descending-sorted data, which produces an anti-Lorenz form, and the Gini values need verification. The stated conclusions about inequality are directionally correct.
Finding 4 (bacterial research concentrated on pathogens): Directionally correct and well-supported, but Glycine max should not appear in the top-20 list (see bug above).
Finding 5 (345K protein families): Directly supported by NB03 cluster count outputs. ✓
Finding 6 (55% dark or dim families): Numbers add up: 9.2% dark + 46.1% dim = 55.3%. Consistent with Cell 16 output. ✓
Limitations: The REPORT's limitations section is thorough and honest — text-mining false positives, PMC open-access bias, heuristic domain classification, and arbitrary clustering thresholds are all acknowledged. This is one of the stronger limitations sections seen in BERIL projects.
Future directions: The 5 proposed directions are specific, feasible, and grounded in the data. The VIMSS cross-reference link to the Fitness Browser (Finding 5 → "high-impact understudied genes") is a particularly actionable follow-on.
Incomplete analysis: None detected. All cells have output, all figures exist, all data files listed in the REPORT are present in data/.
Suggestions
-
[Critical] Fix Gini computation sort order (NB02, Cell 17): Sort
papers_arrandpapers_arr_gascending before computing Gini. Regeneratelorenz_curves.pngand update any quoted Gini values. The Lorenz curve x-axis framing should also be reconsidered — conventional Lorenz curves start from the poorest, not the richest. -
[High] Remove Glycine max from the bacterial filter (NB02, Cell 19): Add
'glycine '(with trailing space to avoid matching "Streptolysin/glycine") to the eukaryote exclusion list inis_bacterium(). Regeneratetop20_bacteria.pngand update the REPORT accordingly. -
[High] Update RESEARCH_PLAN.md to include NB03: Add a "Notebook 3: Sequence Clustering Analysis" section describing the MMseqs2 clustering approach, thresholds, and analysis goals. This brings the plan into alignment with what was actually done.
-
[Medium] Expand README reproduction section: Add steps for NB02 and NB03. Note that NB03 depends on the cluster TSV files that are either already in
data/(if working from this repo) or must be downloaded from MinIO pathcts/io/psdehal/.... A brief dependency diagram (NB01 → NB02, CTS job → NB03) would help a new reader. -
[Medium] Reconcile ≥100 vs >100 threshold (NB03): Make the cutoff for "heavily studied" clusters consistent between Cells 10 and 18. Update the REPORT and figure caption to match. The difference is 31 clusters, so it won't change any narrative conclusions, but consistency matters.
-
[Low] Annotate requirements.txt: Add a comment that
berdl_notebook_utilsis also required for NB01/NB02, with a pointer to the BERDL JupyterHub environment. Consider specifyingpython>=3.10or equivalent. -
[Low] Add RESEARCH_PLAN.md and references.md to README Quick Links: The Quick Links section currently only links to
notebooks/. Linking to the research plan and references file would improve navigability for readers using the README as an entry point.
This review was generated by an AI system. It should be treated as advisory input, not a definitive assessment.
Visualizations
Cluster Cumulative Capture
Cluster Size Distributions
Cluster Vs Literature
Domain Distribution
Gene Coverage Skew
Literature Coverage Landscape
Lorenz Curves
Organism Coverage Skew
Papers Per Gene
Sequence Space Reduction
Top20 Bacteria
Year Distribution