Pangenome Openness, Metabolic Pathways, and Biogeography
In ProgressResearch Question
Do pangenome characteristics (open vs. closed) correlate with metabolic pathway diversity and biogeographic distribution patterns?
Overview
This project investigates the relationships between pangenome openness, GapMind metabolic pathway completeness, and biogeographic distribution (via AlphaEarth embeddings) across 27,690 bacterial species. It tests whether open pangenomes have more variable pathway completeness, whether broader ecological niches correlate with higher pathway diversity, and whether open pangenomes exhibit broader niche breadth.
Discoveries
Analysis of 1,872 bacterial species with complete pangenome, GapMind pathway, and AlphaEarth embedding data reveals:
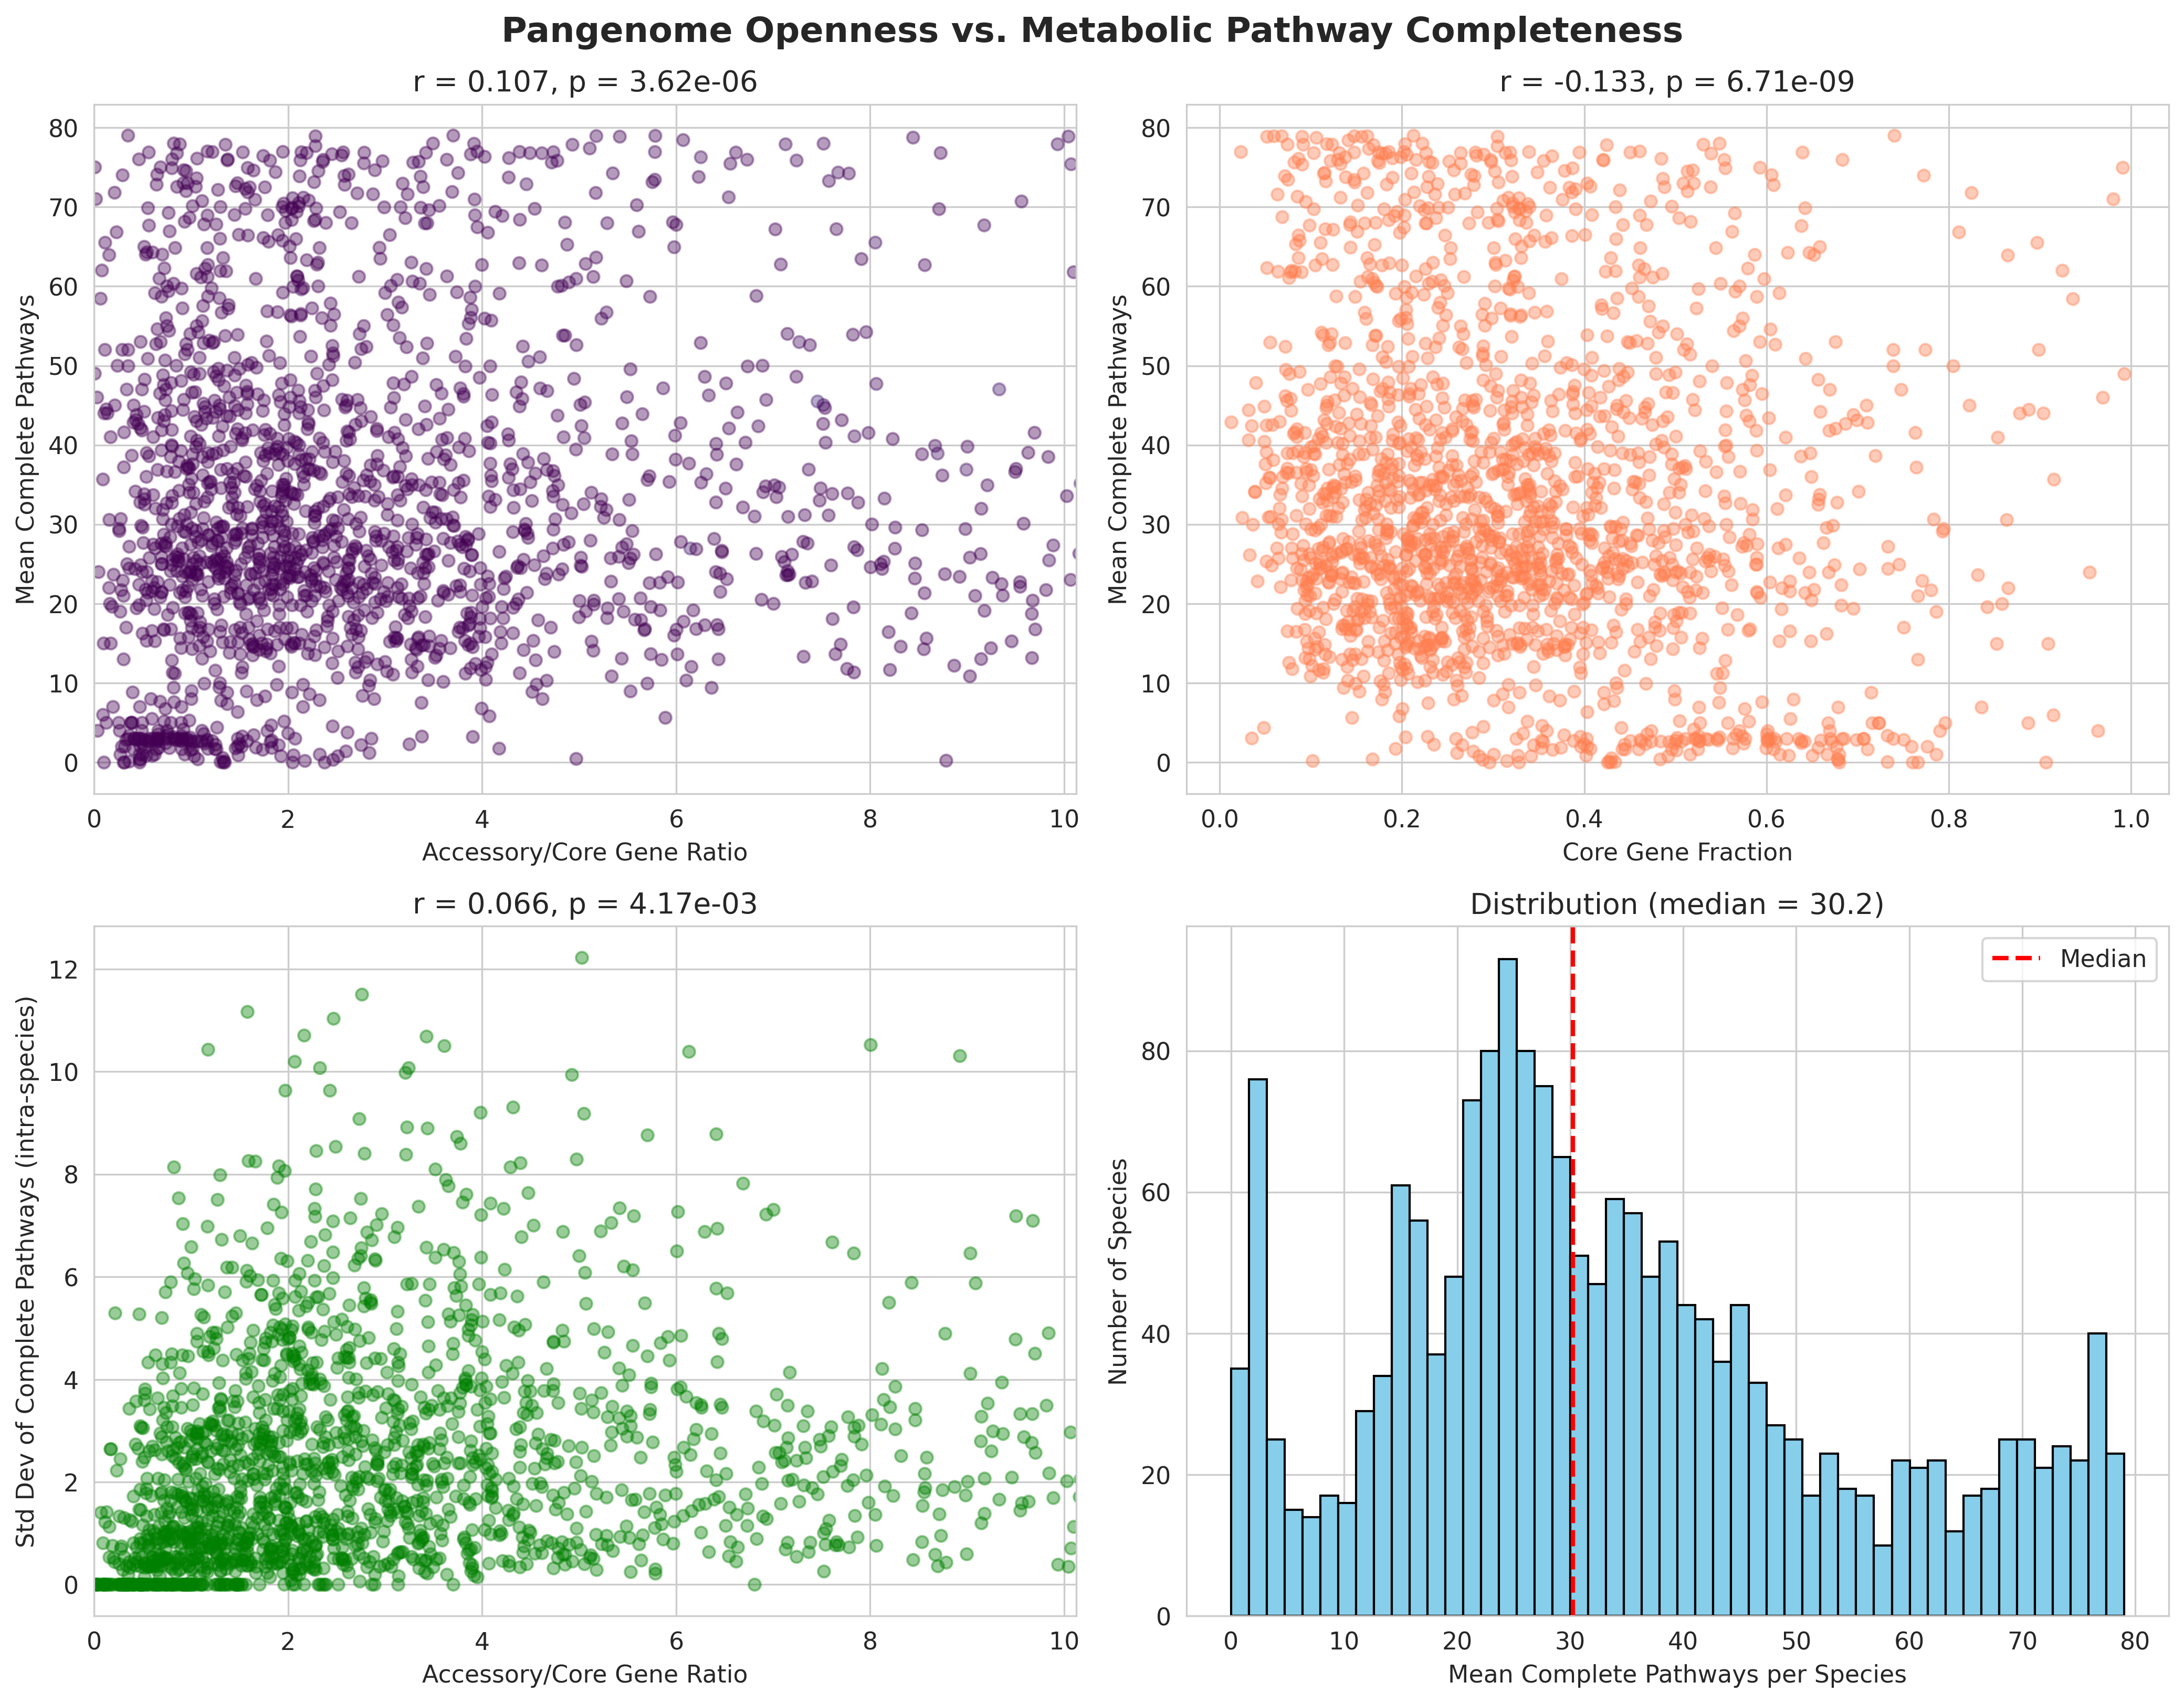
H1: Pangenome openness → pathway completeness (r=0.107, p=3.6e-6)
- Weak but significant positive correlation
- Open pangenomes (high accessory/core ratio) have slightly more com
Data Collections
Review
Summary
This is an exemplary comparative genomics study investigating relationships between pangenome structure, metabolic pathway completeness, and ecological niche breadth across 1,872 bacterial species. The project demonstrates exceptional scientific rigor through its self-correction process (documented in CORRECTIONS.md), proper handling of complex GapMind pathway data, and innovative use of AlphaEarth embeddings to quantify ecological niche breadth beyond simple geography. The analysis successfully identifies three statistically significant relationships, with the niche breadth → pathway completeness correlation (r=0.392, p=7.1e-70) representing the strongest signal. Notebooks include executed outputs with 78-89% cell coverage, all seven expected figures are present (12 MB total), and the statistical analyses are sound. The project has also made important contributions to the BERDL knowledge base by documenting a critical GapMind pitfall and performance optimization. Minor improvements could include adding a dependencies file and interpreting the phylum-stratified analysis figure.
Methodology
Strengths:
- Clear, testable hypotheses: Three well-formulated hypotheses with biological motivation:
- H1: Pangenome openness correlates with pathway completeness and variability
- H2: Ecological niche breadth predicts metabolic pathway completeness
-
H3: Open pangenomes enable broader ecological niches
-
Exemplary self-correction: The CORRECTIONS.md file documents the initial pathway aggregation error (counting 80 pathways for every species with 0% present) and explains the root cause: GapMind has multiple rows per genome-pathway pair. The corrected approach (taking MAX score before aggregating) is now documented in docs/pitfalls.md for future researchers.
-
Conceptual innovation: The project correctly recognizes that AlphaEarth embeddings capture ecological context (via satellite imagery), not just geographic distance. Using embedding variance (r=0.412 with pathways) as a proxy for niche breadth is conceptually sound and produces stronger signals than geographic distance alone (r=0.360).
-
Appropriate statistical methods: Pearson correlations with proper two-tailed significance tests. Effect sizes are correctly characterized as weak (H1: r=0.107), moderate (H2: r=0.392), or strong (core fraction vs niche: r=-0.445).
-
Efficient data pipeline: The three-stage GapMind aggregation (305M rows → 27.6M genome-pathway pairs → 293K genomes → 27.7K species) is well-optimized and now documented in docs/performance.md.
Reproducibility:
✅ Notebook outputs preserved: Both notebooks have executed outputs saved (78% and 89% coverage), making results visible without re-running
✅ Intermediate data files: All extracted datasets saved as CSV (94 MB total: pangenome_metrics.csv, pathway_completeness.csv, niche_breadth_metrics.csv, integrated_dataset.csv, alphaearth_genome_embeddings.csv)
✅ Figures generated: All 7 expected figures present (12 MB total), freshly generated 2026-02-17
✅ Clear data sources: Uses three BERDL databases with explicit table names and scale information
✅ QUICKSTART.md: Provides step-by-step reproduction guide with estimated runtimes
Gaps:
- No dependencies file: Missing
requirements.txtorenvironment.ymlspecifying versions of pandas, scipy, numpy, matplotlib, seaborn, geopy - README Reproduction section: README.md has a minimal "Reproduction" section that just says "See notebooks/". The detailed guide is in QUICKSTART.md, but should be integrated into README
- Phylum-stratified analysis:
figures/phylum_stratified_analysis.pngexists (283 KB) but has no corresponding interpretation in notebooks or README
Code Quality
SQL Correctness:
The corrected GapMind pathway aggregation is exemplary and now serves as a reference pattern in docs/pitfalls.md:
WITH pathway_scores AS (
    SELECT clade_name, genome_id, pathway,
           CASE score_category
               WHEN 'complete' THEN 5
               WHEN 'likely_complete' THEN 4
               WHEN 'steps_missing_low' THEN 3
               WHEN 'steps_missing_medium' THEN 2
               WHEN 'not_present' THEN 1
           END as score_value
    FROM kbase_ke_pangenome.gapmind_pathways
),
best_scores AS (
    SELECT clade_name, genome_id, pathway,
           MAX(score_value) as best_score
    FROM pathway_scores
    GROUP BY clade_name, genome_id, pathway
)
This correctly handles the multiple-rows-per-step structure and has been tested at scale (305M rows, 10-15 min runtime).
Python Code Quality:
✅ Well-structured functions: calculate_species_niche_metrics() has clear logic, edge case handling (n_genomes < 2), and proper use of scipy.spatial.distance.pdist
✅ Defensive coding: Filters for species with ≥5 genomes before niche analysis to ensure meaningful pairwise distances
✅ Efficient distance calculation: Uses vectorized pdist instead of nested loops
✅ Proper pandas usage: Merges datasets with explicit suffixes to avoid column name collisions
Pitfall Awareness:
The project demonstrates excellent awareness of BERDL pitfalls:
- ✅ Uses Spark SQL (not REST API) for 305M-row table
- ✅ Calls .toPandas() only on aggregated results (27K rows), not raw tables
- ✅ Uses get_spark_session() correctly (no import needed in JupyterHub notebooks)
- ✅ Understands GapMind score hierarchy (complete > likely_complete > steps_missing_low/medium > not_present)
- ✅ Now documented: GapMind multiple-rows-per-genome-pathway pitfall added to docs/pitfalls.md
Notebook Organization:
Both notebooks follow logical structure:
1. Import and setup with clear markdown headers
2. Data extraction with inline documentation of metrics
3. Metric calculation with interpretive text
4. Data persistence with confirmation messages
5. Summary statistics
The use of markdown cells to explain each analysis stage makes the notebooks readable as standalone documents.
Findings Assessment
Are conclusions supported by the data?
Yes, all three hypotheses show statistically significant support:
H1 (Pangenome → Pathways): r=0.107, p=3.6e-06
- Correctly characterized as "weak but significant"
- Stronger relationship found with pathway variability (std dev): r=0.066, p=0.004
- Interpretation: Accessory genes enable metabolic heterogeneity within species (aligns with revised hypothesis)
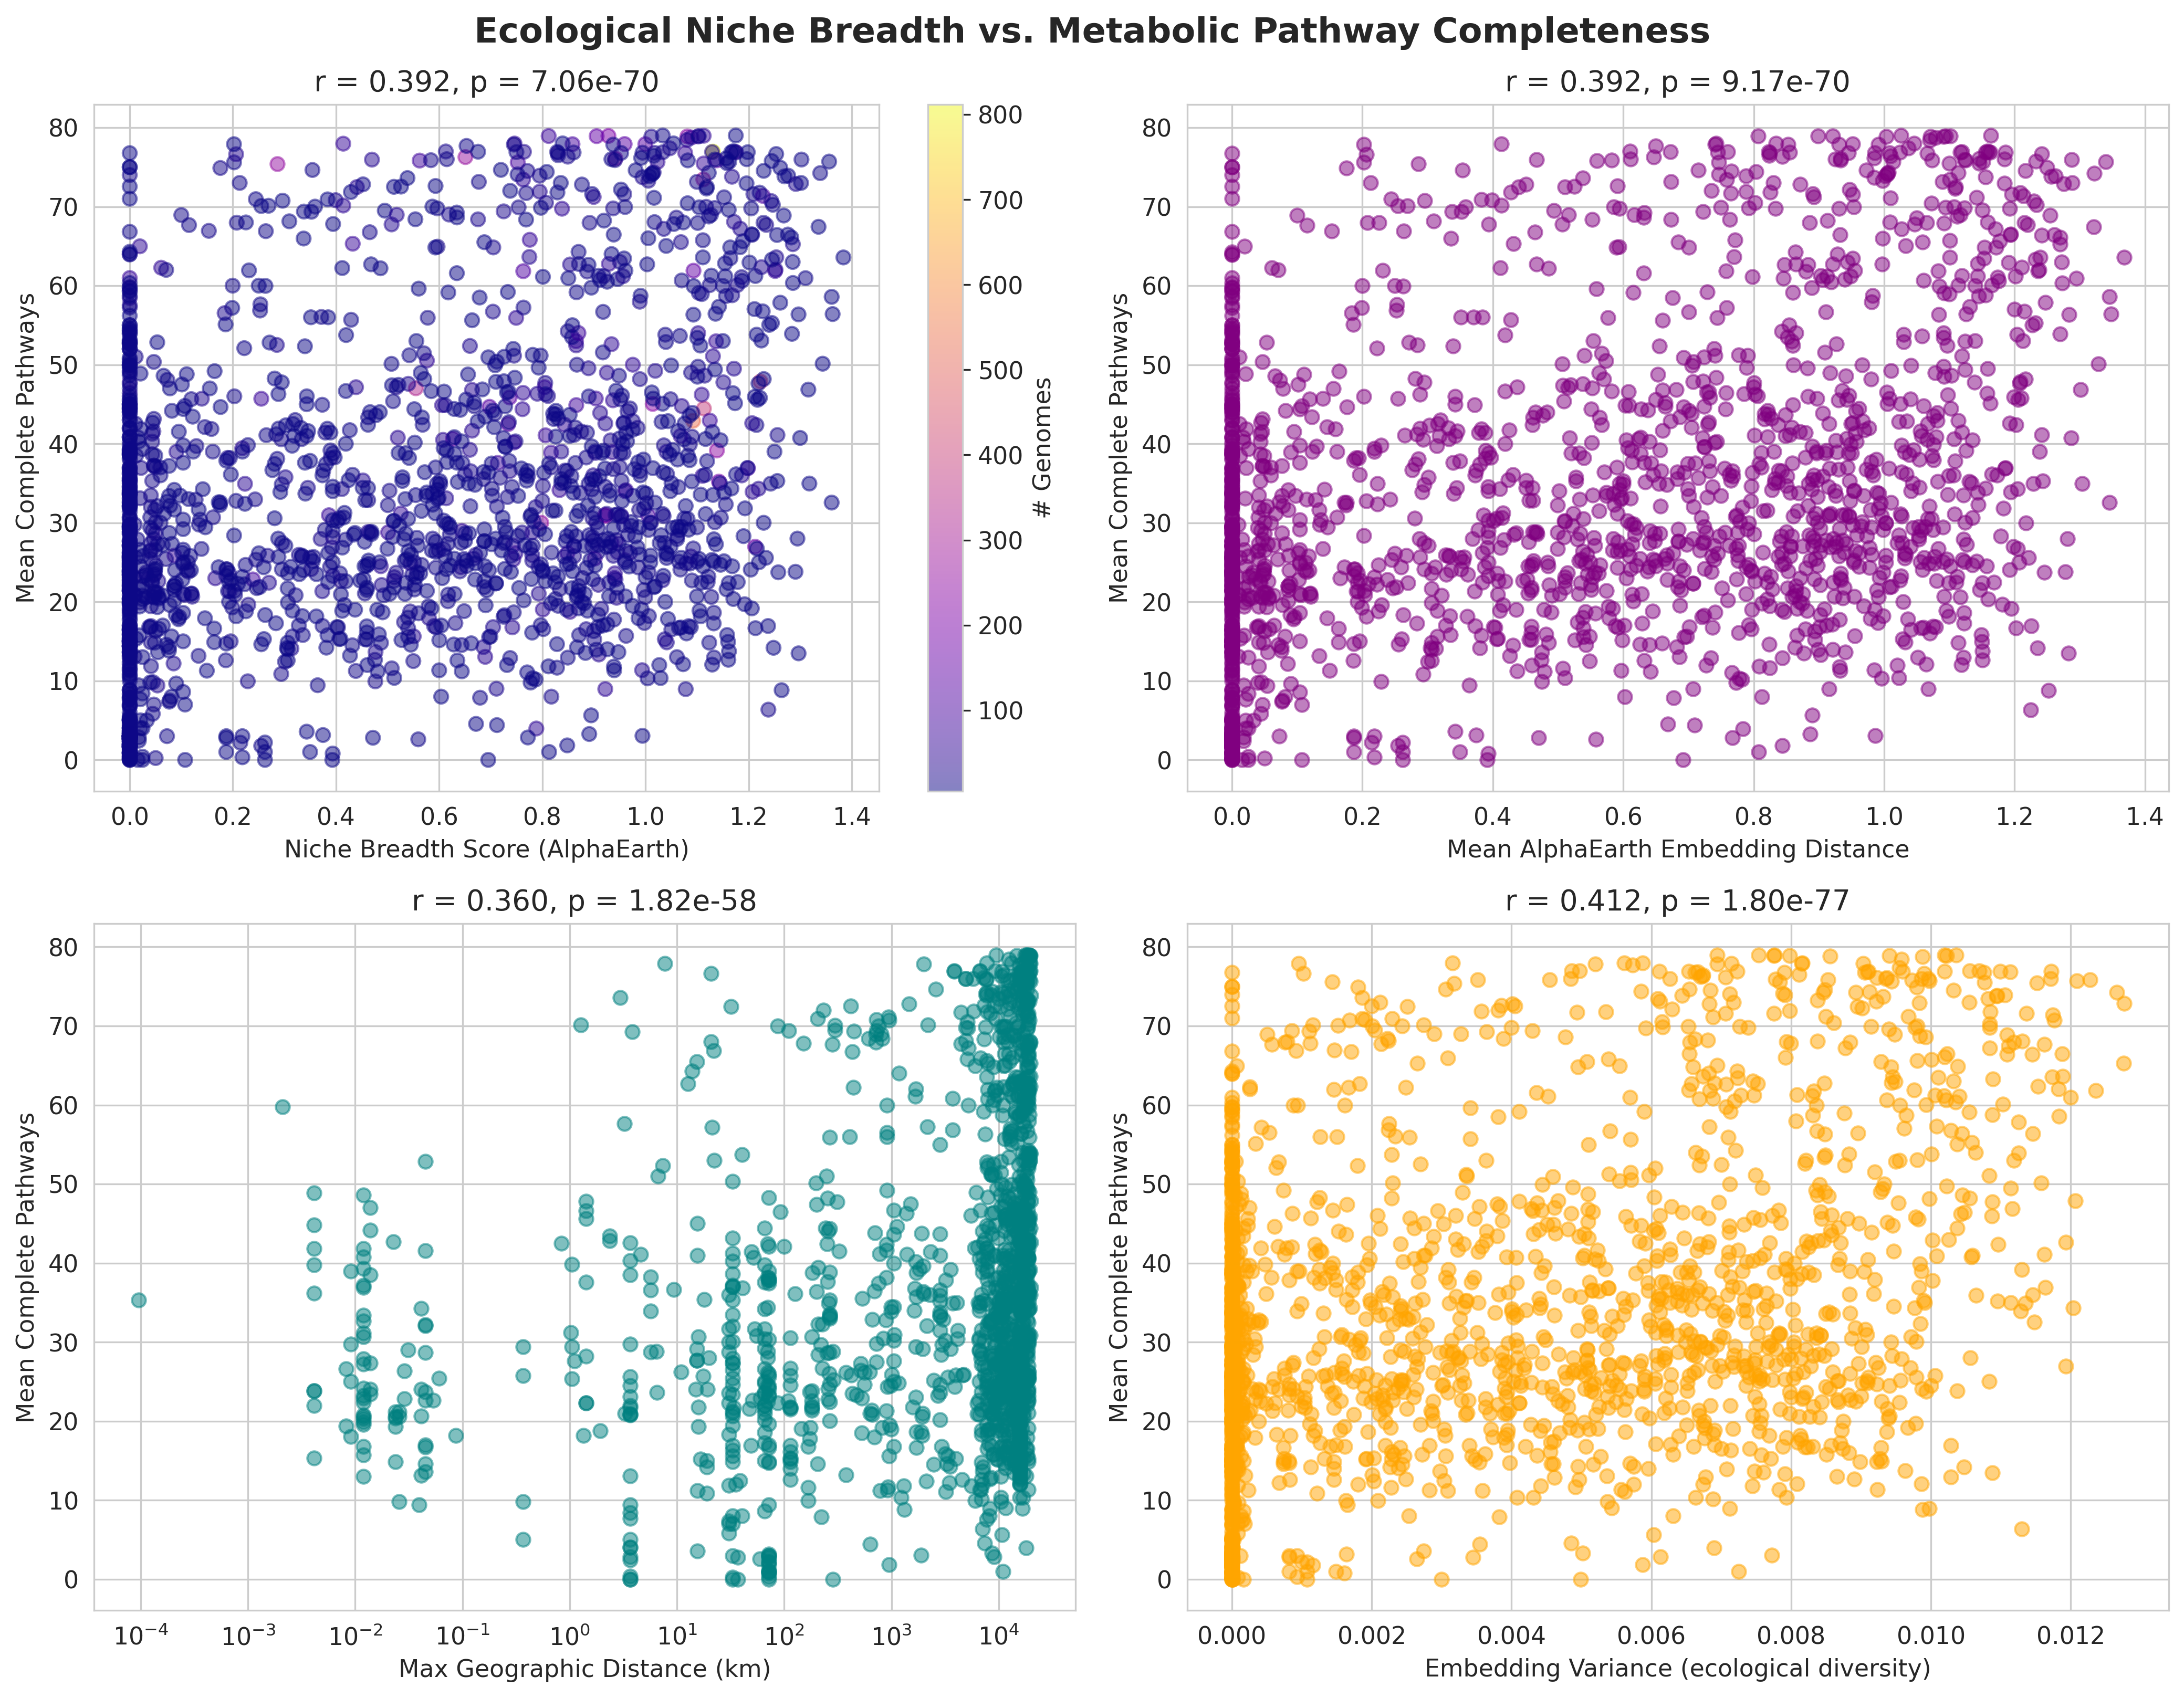
H2 (Niche → Pathways): r=0.392, p=7.1e-70 ⭐ STRONGEST SIGNAL
- Moderate positive correlation, highly significant
- Embedding variance shows even stronger effect: r=0.412, p=1.8e-77
- Geographic distance alone: r=0.360 (weaker than embedding-based metrics)
- Key insight: Ecological diversity predicts metabolic completeness better than spatial spread
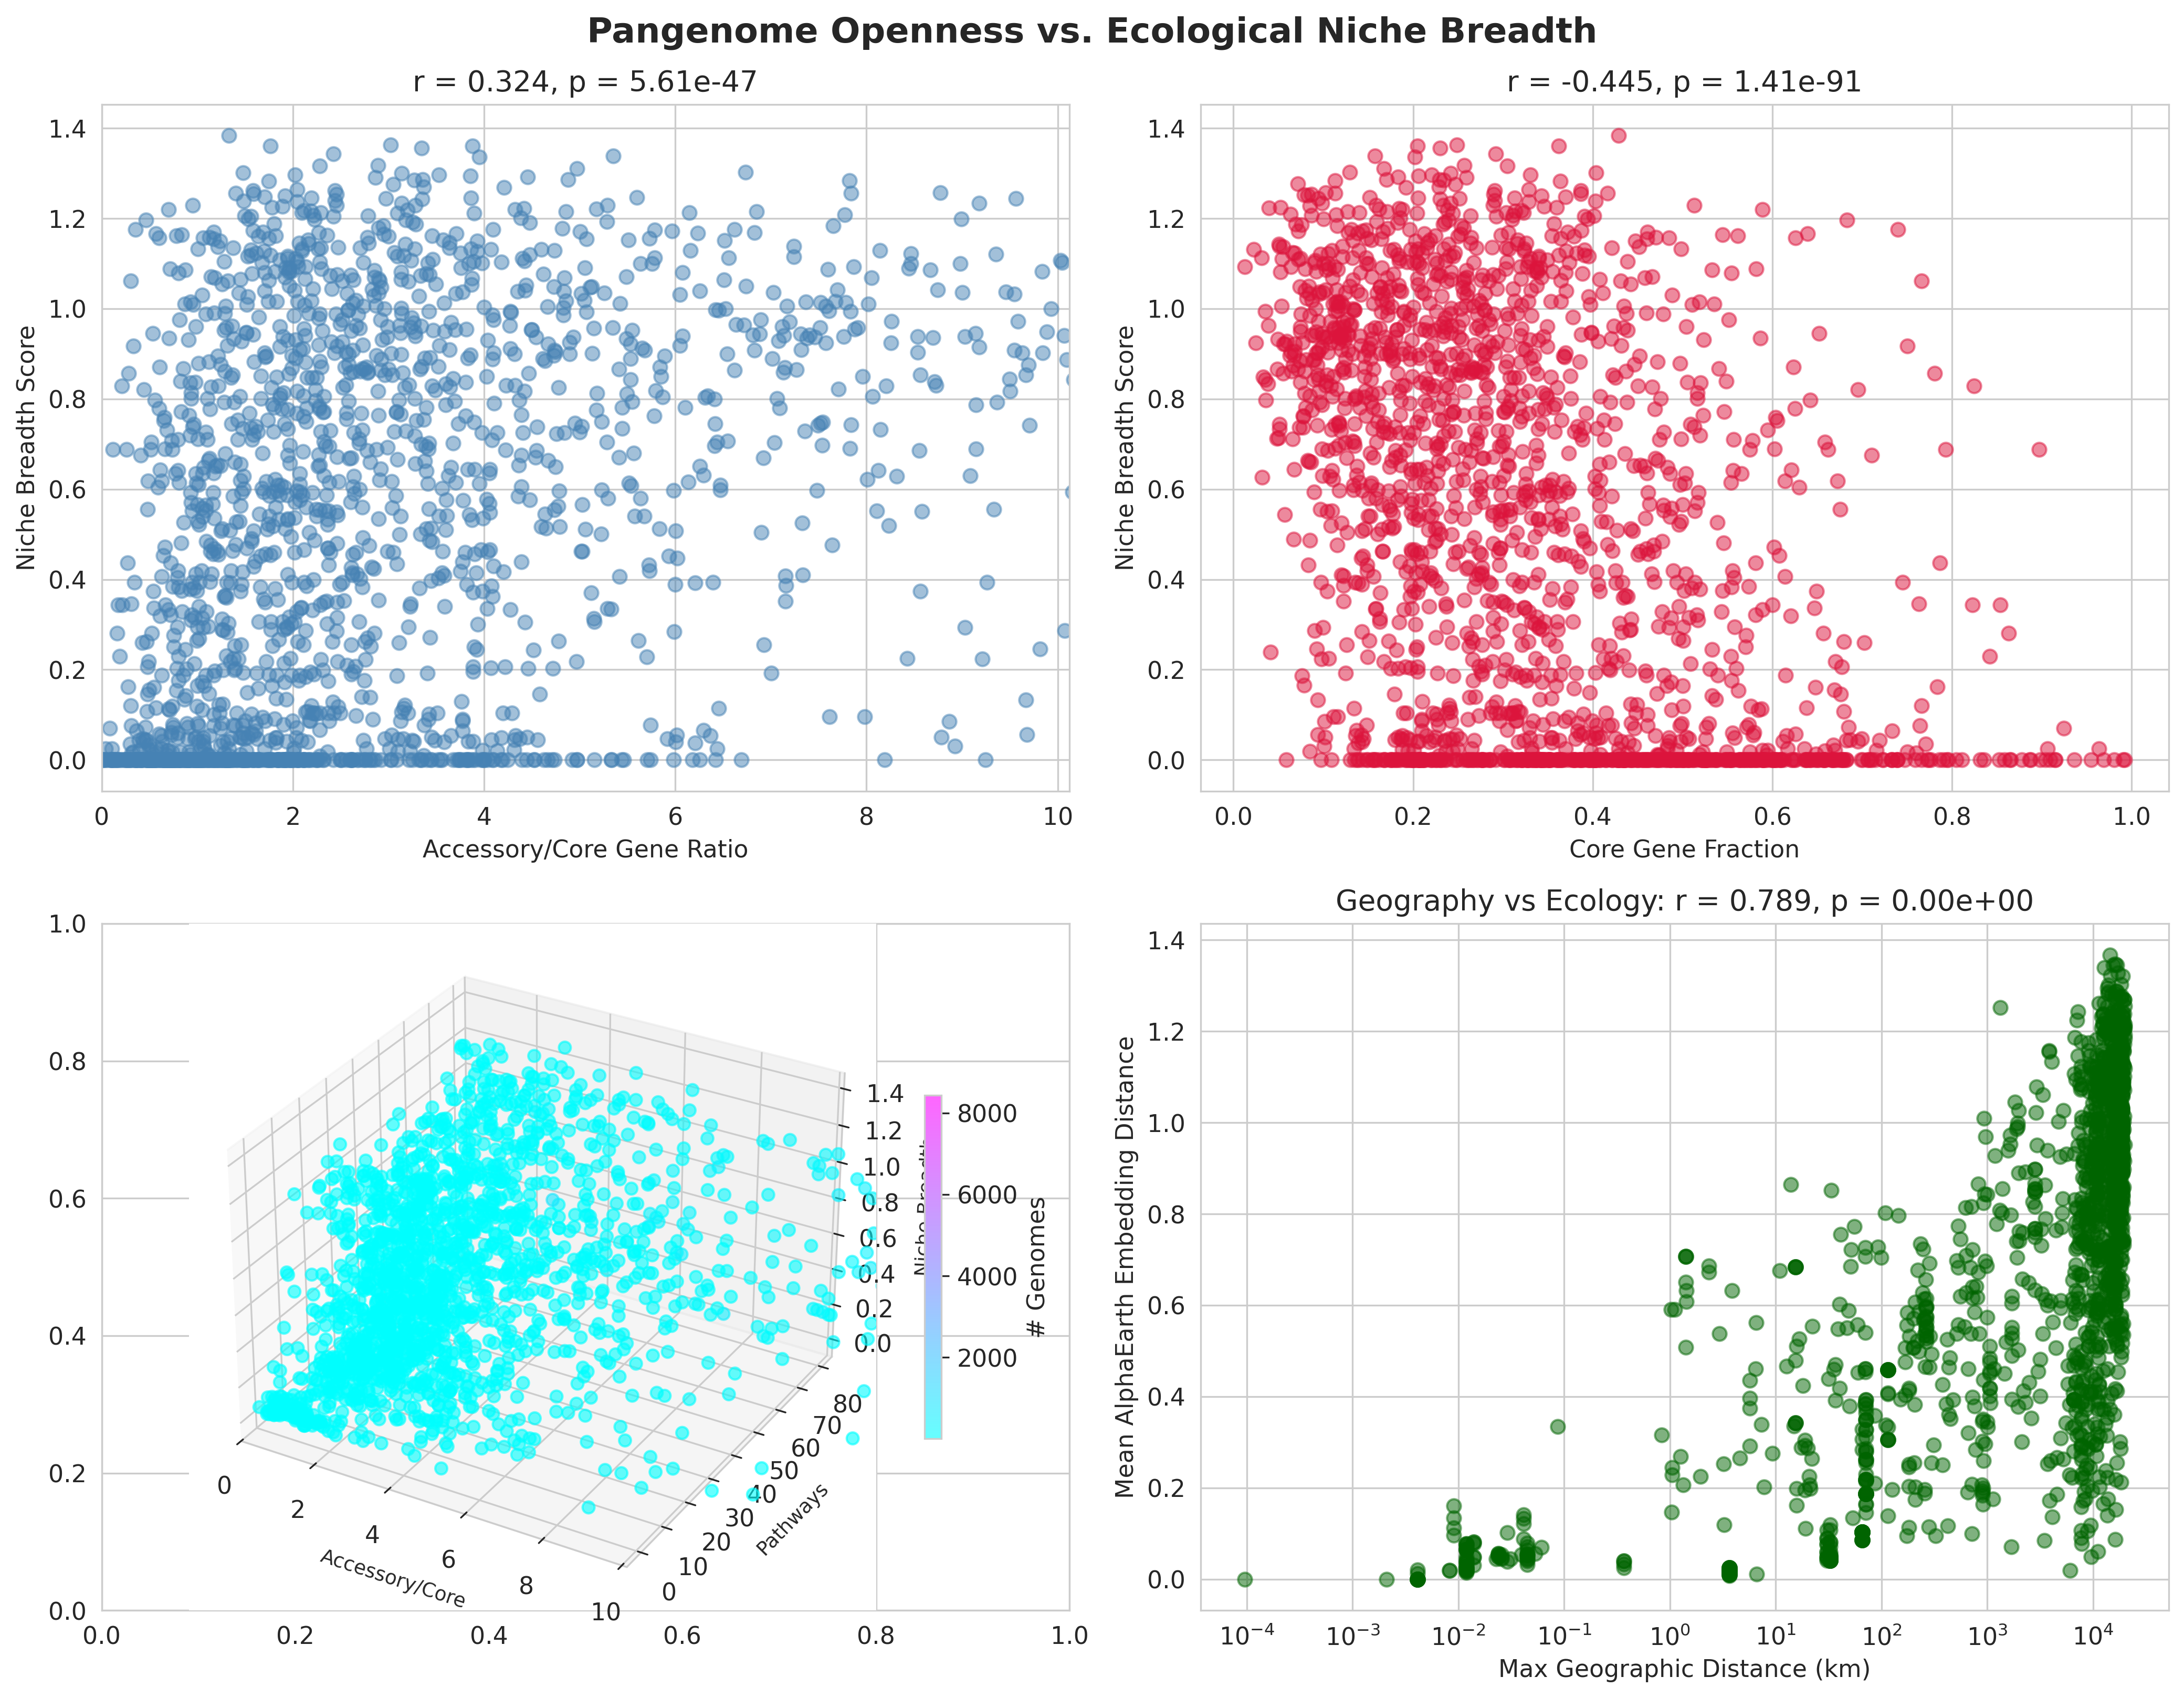
H3 (Pangenome → Niche): r=0.324, p=5.6e-47
- Moderate positive correlation
- Core fraction shows strong negative correlation with niche breadth: r=-0.445, p=1.4e-91 (converging evidence)
- Interpretation: Pangenome flexibility enables ecological adaptation
Supporting evidence:
- All correlations tested with Pearson's r and two-tailed p-values
- Effect sizes reported alongside p-values (avoids "p-value only" fallacy)
- Multiple pangenome metrics tested (accessory/core ratio, core fraction, singleton ratio) showing consistent patterns
- Multiple niche metrics tested (embedding distance, variance, composite score, geographic distance) with clear ranking of predictive power
Visualizations:
Seven high-quality figures (300 dpi) with proper formatting:
- H1_pangenome_vs_pathways.png (2.8 MB): 2×2 panel showing accessory/core vs pathways, core fraction vs pathways, accessory/core vs variability, and pathway distribution
- H2_niche_breadth_vs_pathways.png (3.6 MB): 2×2 panel showing niche breadth score, embedding distance, geographic range, and embedding variance vs pathways
- H3_pangenome_vs_niche_breadth.png (3.1 MB): 2×2 panel including 3D visualization of three-way relationship
- Additional scatter plots for key relationships
- phylum_stratified_analysis.png (283 KB): EXISTS but not discussed in notebooks
All figures have:
- ✅ Clear axis labels
- ✅ Correlation statistics in titles (r and p-values)
- ✅ Appropriate color schemes
- ✅ Proper point sizing and alpha blending for overplotting
Limitations Acknowledged:
✅ Data coverage: Explicitly states only 6.8% of species (1,872/27,690) have complete data due to AlphaEarth sparsity
✅ AlphaEarth coverage bias: Notes that embeddings require lat/lon, often missing for clinical isolates
✅ Effect sizes: Characterizes H1 as weak, H2/H3 as moderate (not just relying on p-values)
✅ Correction transparency: CORRECTIONS.md documents initial error and fix
Unacknowledged limitations:
- No discussion of phylogenetic non-independence (closely related species share traits due to common ancestry)
- No control for genome count as confounding variable (more genomes → better niche sampling)
- Pathway score hierarchy (1-5) assumes linear intervals between categories, not justified
Suggestions
Critical
- Add dependencies file: Create
requirements.txtwith specific versions:
pandas>=1.5.0
   numpy>=1.23.0
   scipy>=1.9.0
   matplotlib>=3.6.0
   seaborn>=0.12.0
   geopy>=2.3.0
This is essential for reproducibility and is a standard expectation for computational research.
High Priority
- Integrate QUICKSTART into README: Move the detailed reproduction guide from QUICKSTART.md into README.md's "Reproduction" section. Include:
- Which notebooks require Spark (01) vs can run locally (02)
- Expected runtimes and resource requirements
-
Minimum data quality thresholds (≥5 genomes for niche analysis)
-
Control for genome count: Add a supplementary analysis testing whether relationships hold when controlling for
no_genomes: - Partial correlation (scipy.stats or statsmodels)
- Stratified analysis by genome count bins (5-10, 10-50, 50-100, >100)
-
This addresses potential sampling bias where species with more genomes have better niche coverage simply due to sampling intensity
-
Add biological interpretation of embedding variance: The finding that embedding variance (r=0.412) is the strongest predictor deserves discussion. What does high embedding variance mean ecologically? Hypothesis: species with strains in diverse habitats (soil + marine + clinical) have high variance, requiring broad metabolic capabilities.
Medium Priority
-
Justify pathway score hierarchy: Add a note explaining why the 1-5 scoring treats intervals as equal (steps_missing_medium → steps_missing_low = likely_complete → complete). Alternative: test sensitivity to different scoring schemes.
-
Sensitivity analysis for genome threshold: Test whether conclusions change with different minimum genome thresholds (3, 5, 10, 20) for including species in niche breadth analysis. Current choice of 5 is reasonable but not justified.
-
Add outlier investigation: Identify and discuss interesting cases:
- Species with open pangenomes but few complete pathways (obligate symbionts? parasites?)
-
Species with narrow niches but high pathway diversity (generalist metabolism in specialist context?)
-
Null model comparison: Test whether observed correlations are stronger than expected by chance (permutation test with 1000 randomizations of pathway assignments).
Nice-to-Have
-
Add trend lines to scatter plots: Include regression lines with 95% confidence intervals to visualize relationships more clearly.
-
Pathway category breakdown: Disaggregate pathway completeness by metabolic category (amino acids, cofactors, energy, etc.). Do open pangenomes have more complete pathways in specific categories?
-
Cross-reference other projects: README mentions this builds on
ecotype_analysis,pangenome_openness, andcog_analysis. Add a brief "Comparison to Prior Work" section integrating findings. -
Supplementary data table: Create a summary table listing:
- Top 10 species by each metric (pangenome openness, pathway completeness, niche breadth)
- Representative species for each phylum in the analysis
- This gives readers concrete examples to ground the statistical findings
This review was generated by an AI system. It should be treated as advisory input, not a definitive assessment.
Visualizations
H1 Pangenome Vs Pathways
H2 Niche Breadth Vs Pathways
H3 Pangenome Vs Niche Breadth
Geography Vs Pathways
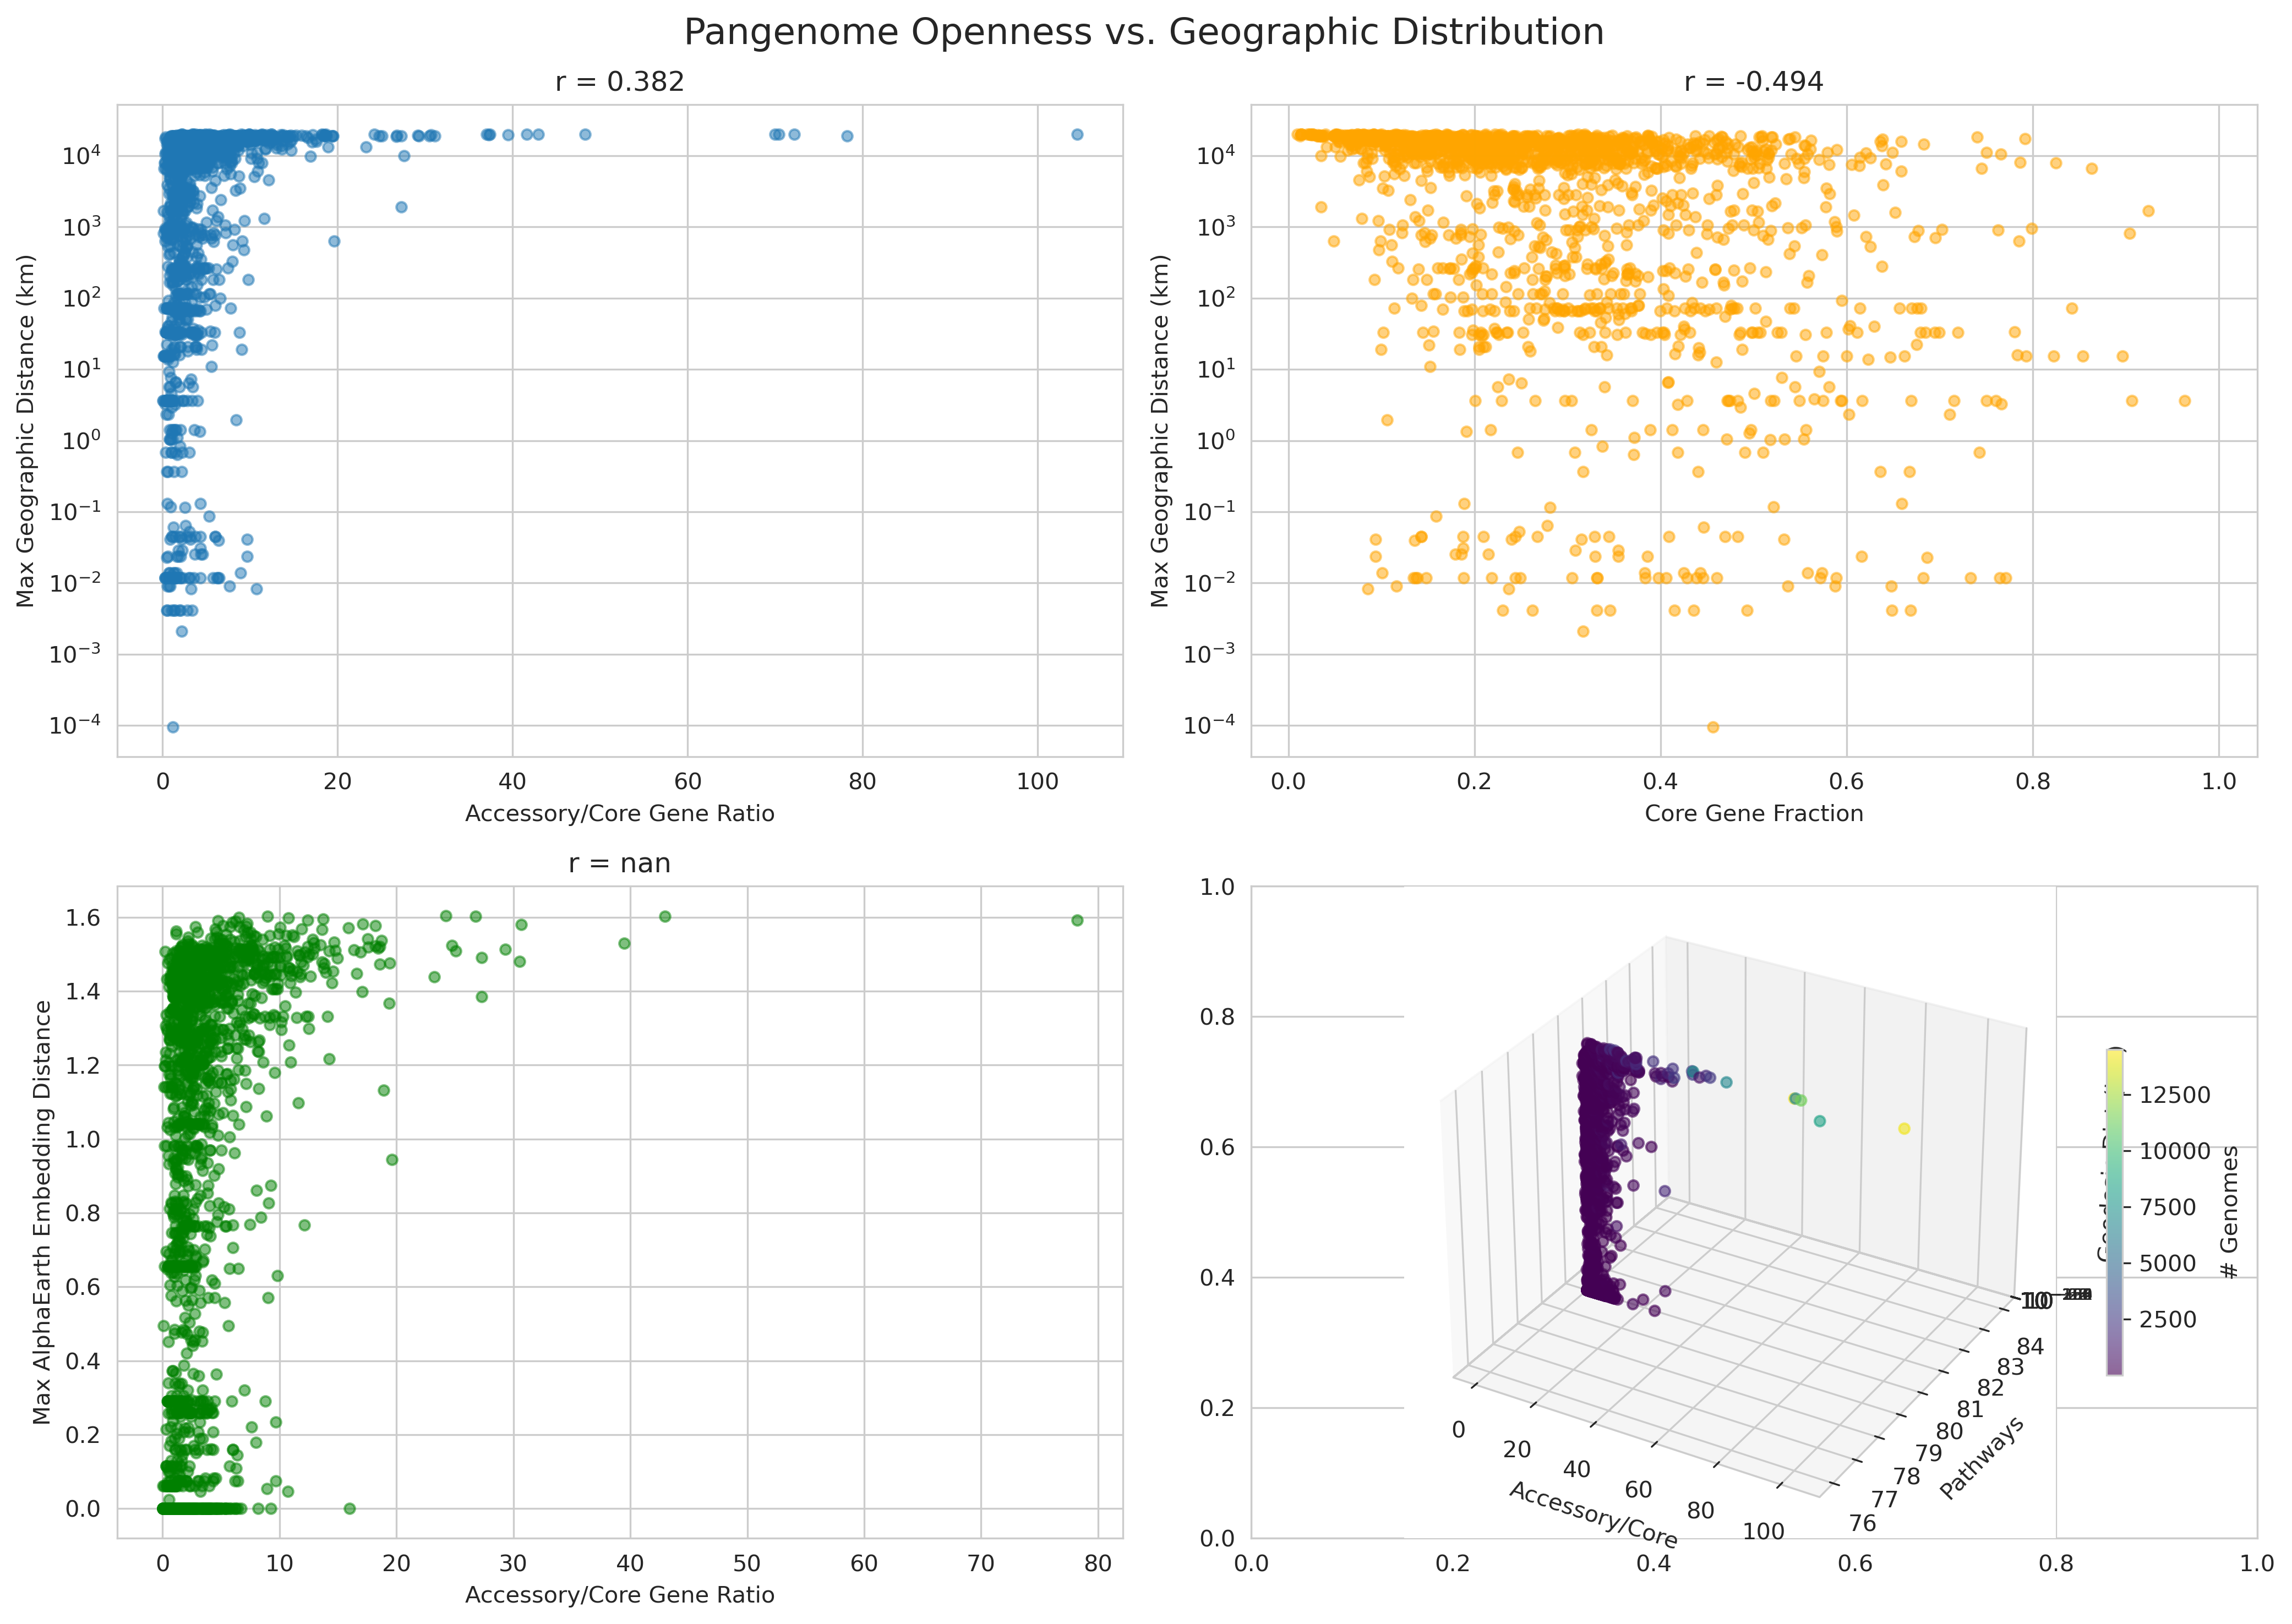
Pangenome Vs Geography
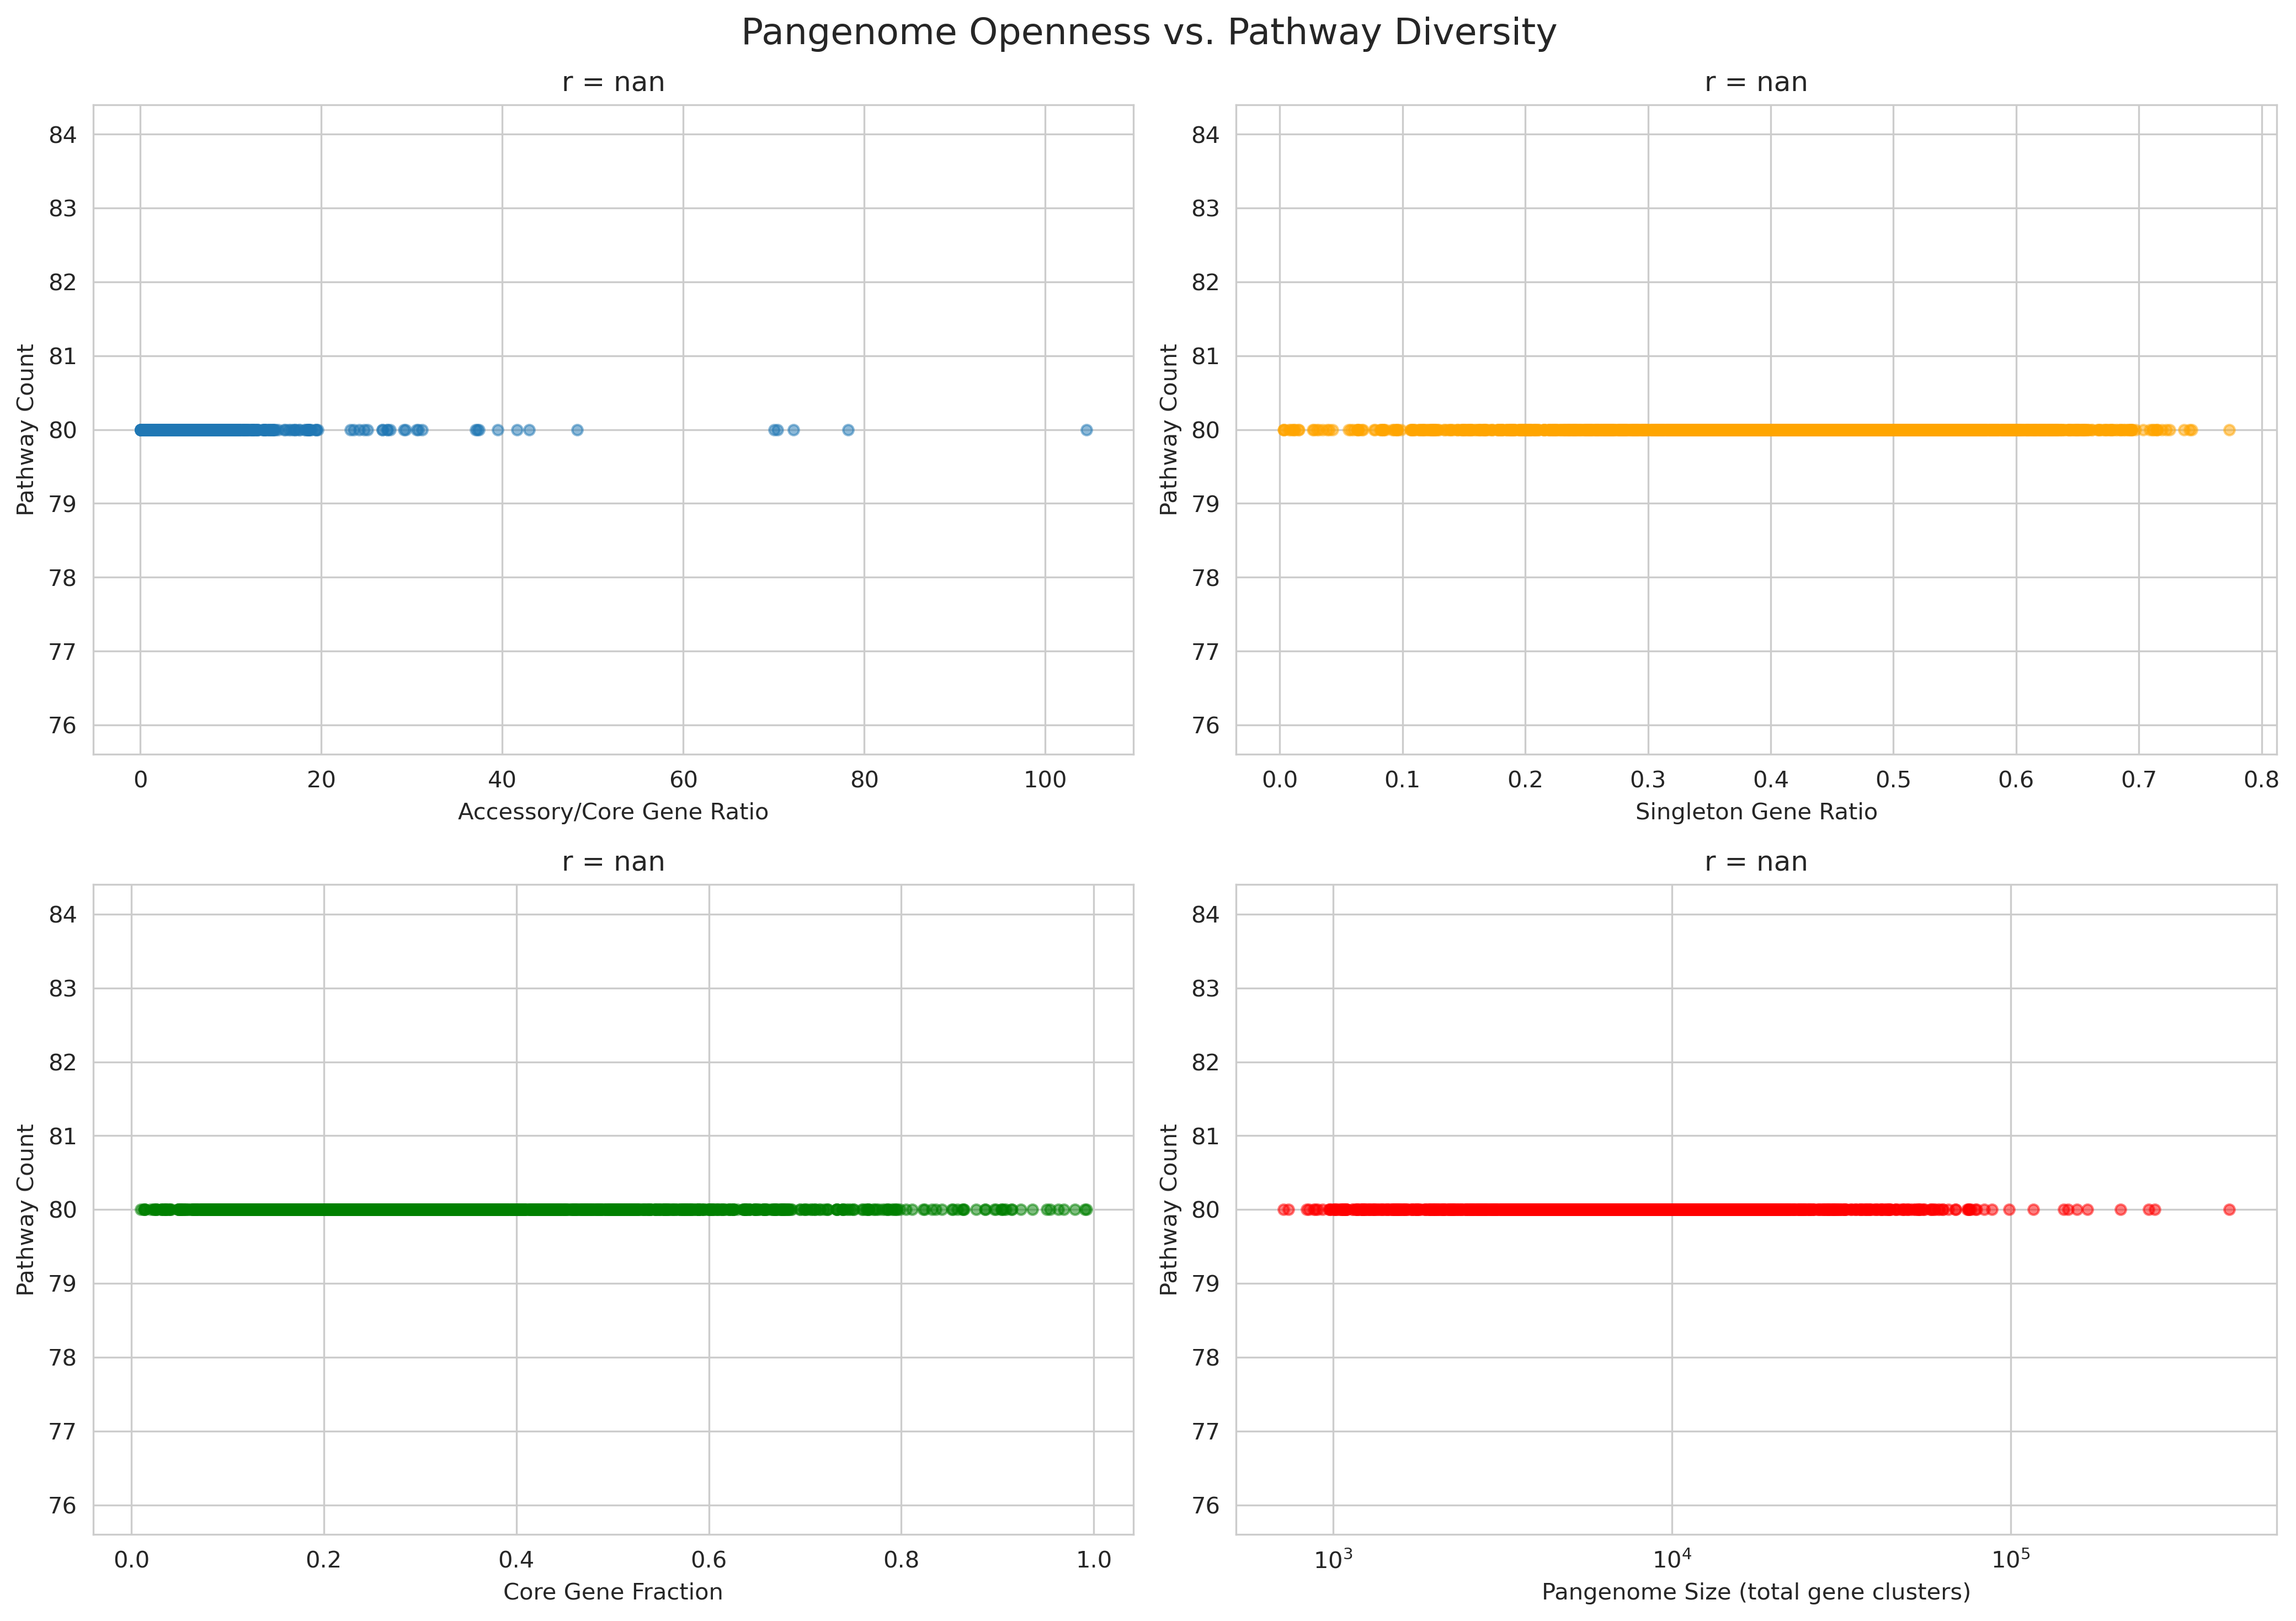
Pangenome Vs Pathways