CF Protective Microbiome Formulation Design
In ProgressResearch Question
Can we build a multi-criterion framework that explains measured P. aeruginosa PA14 inhibition from metabolic competition, growth kinetics, and patient ecology data, and use it to design optimal 1–5 organism commensal formulations for competitive exclusion in CF lungs?
Overview
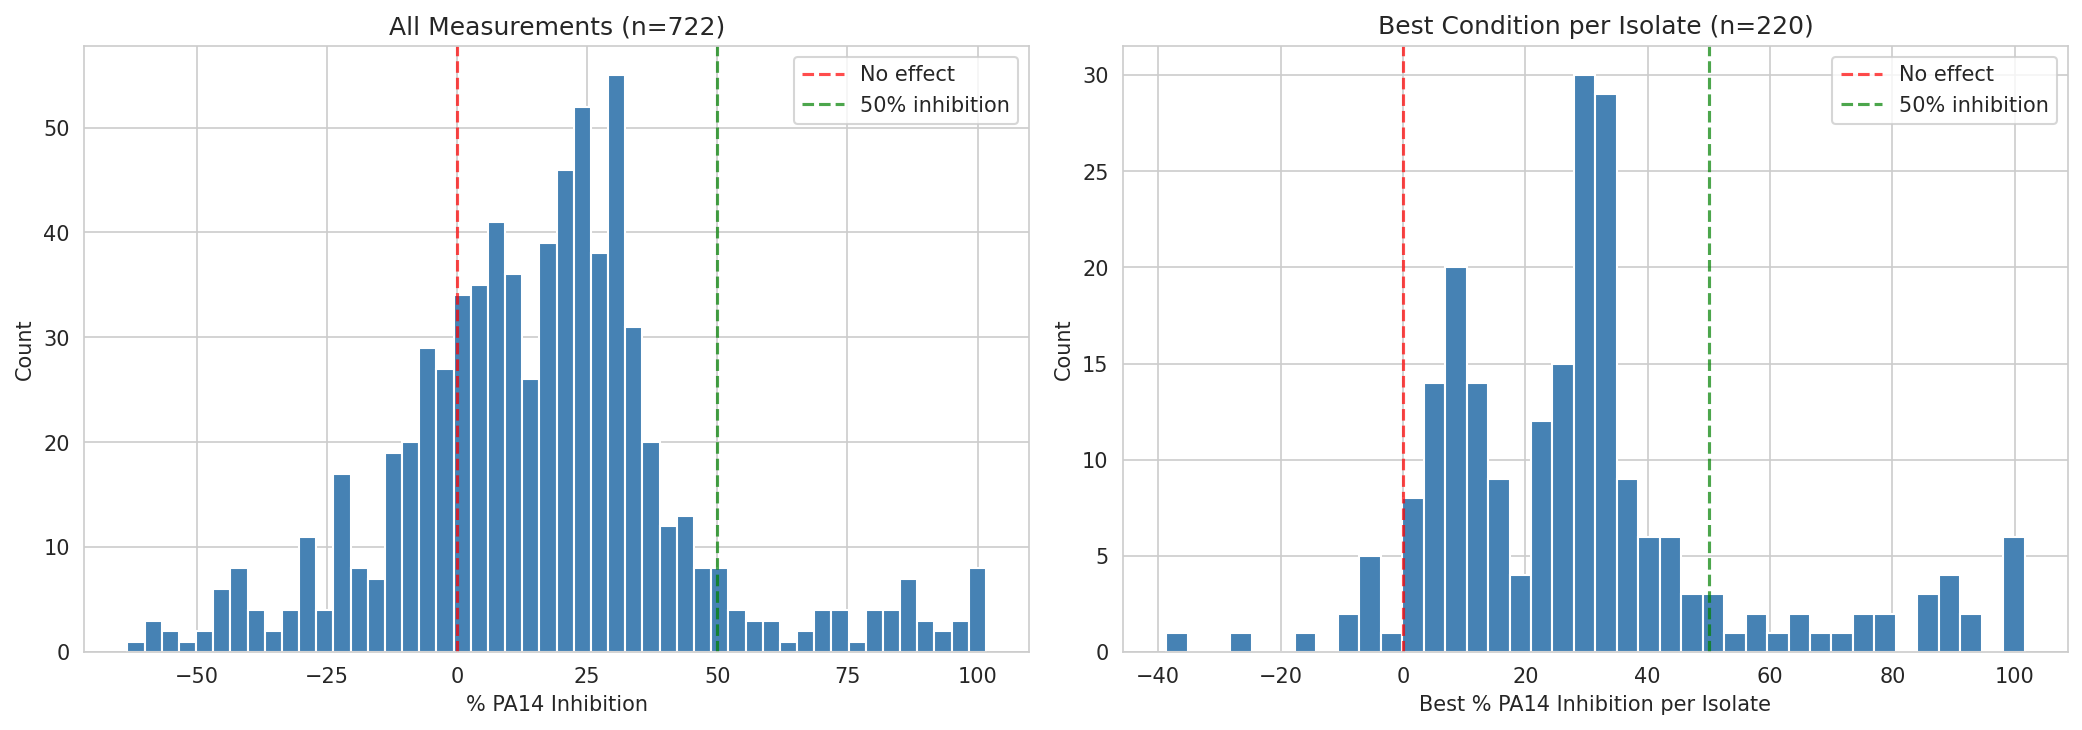
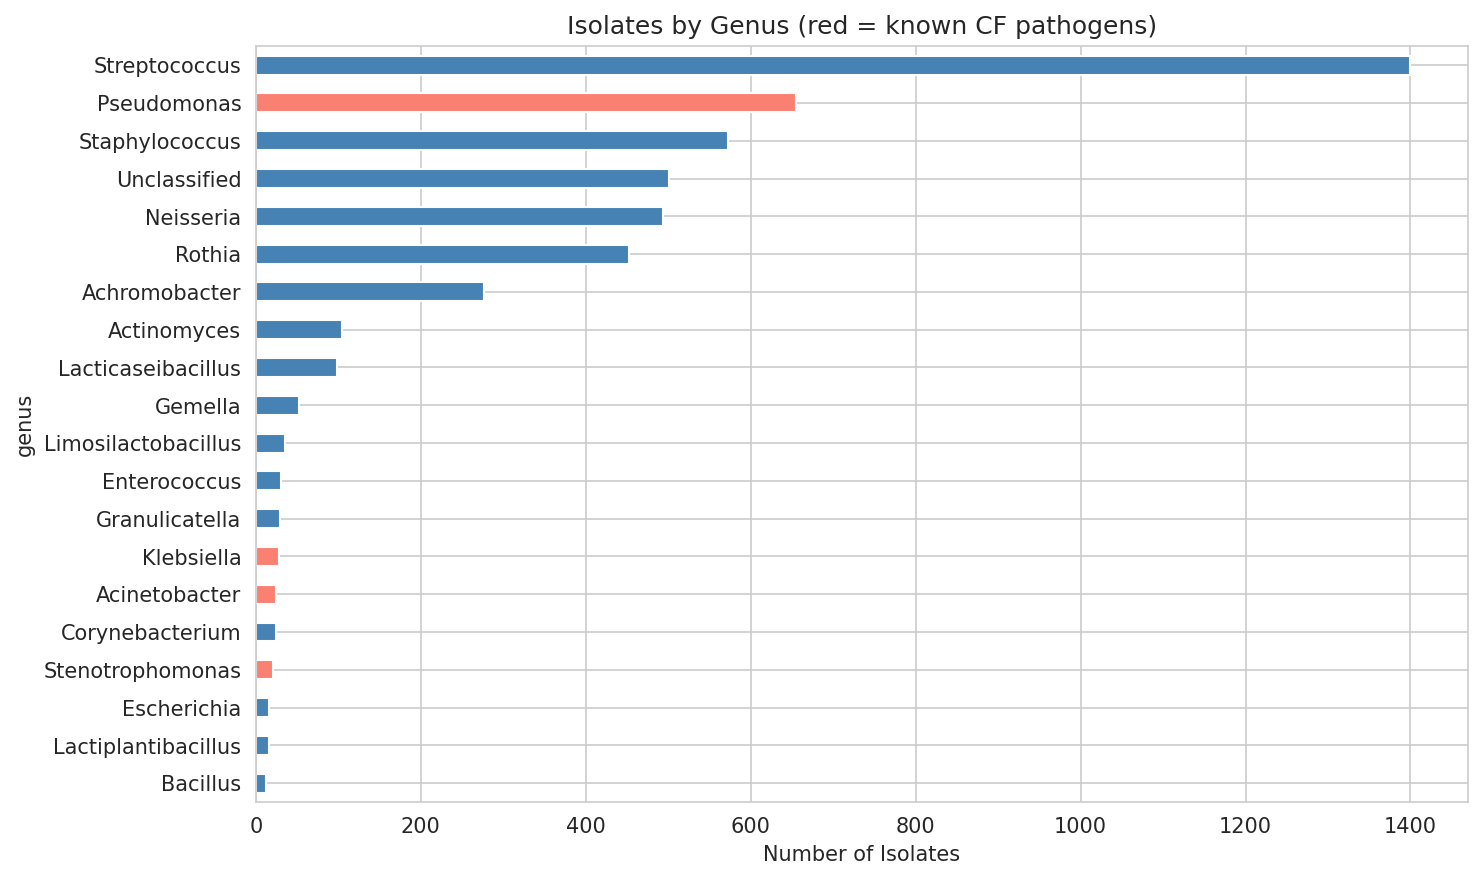
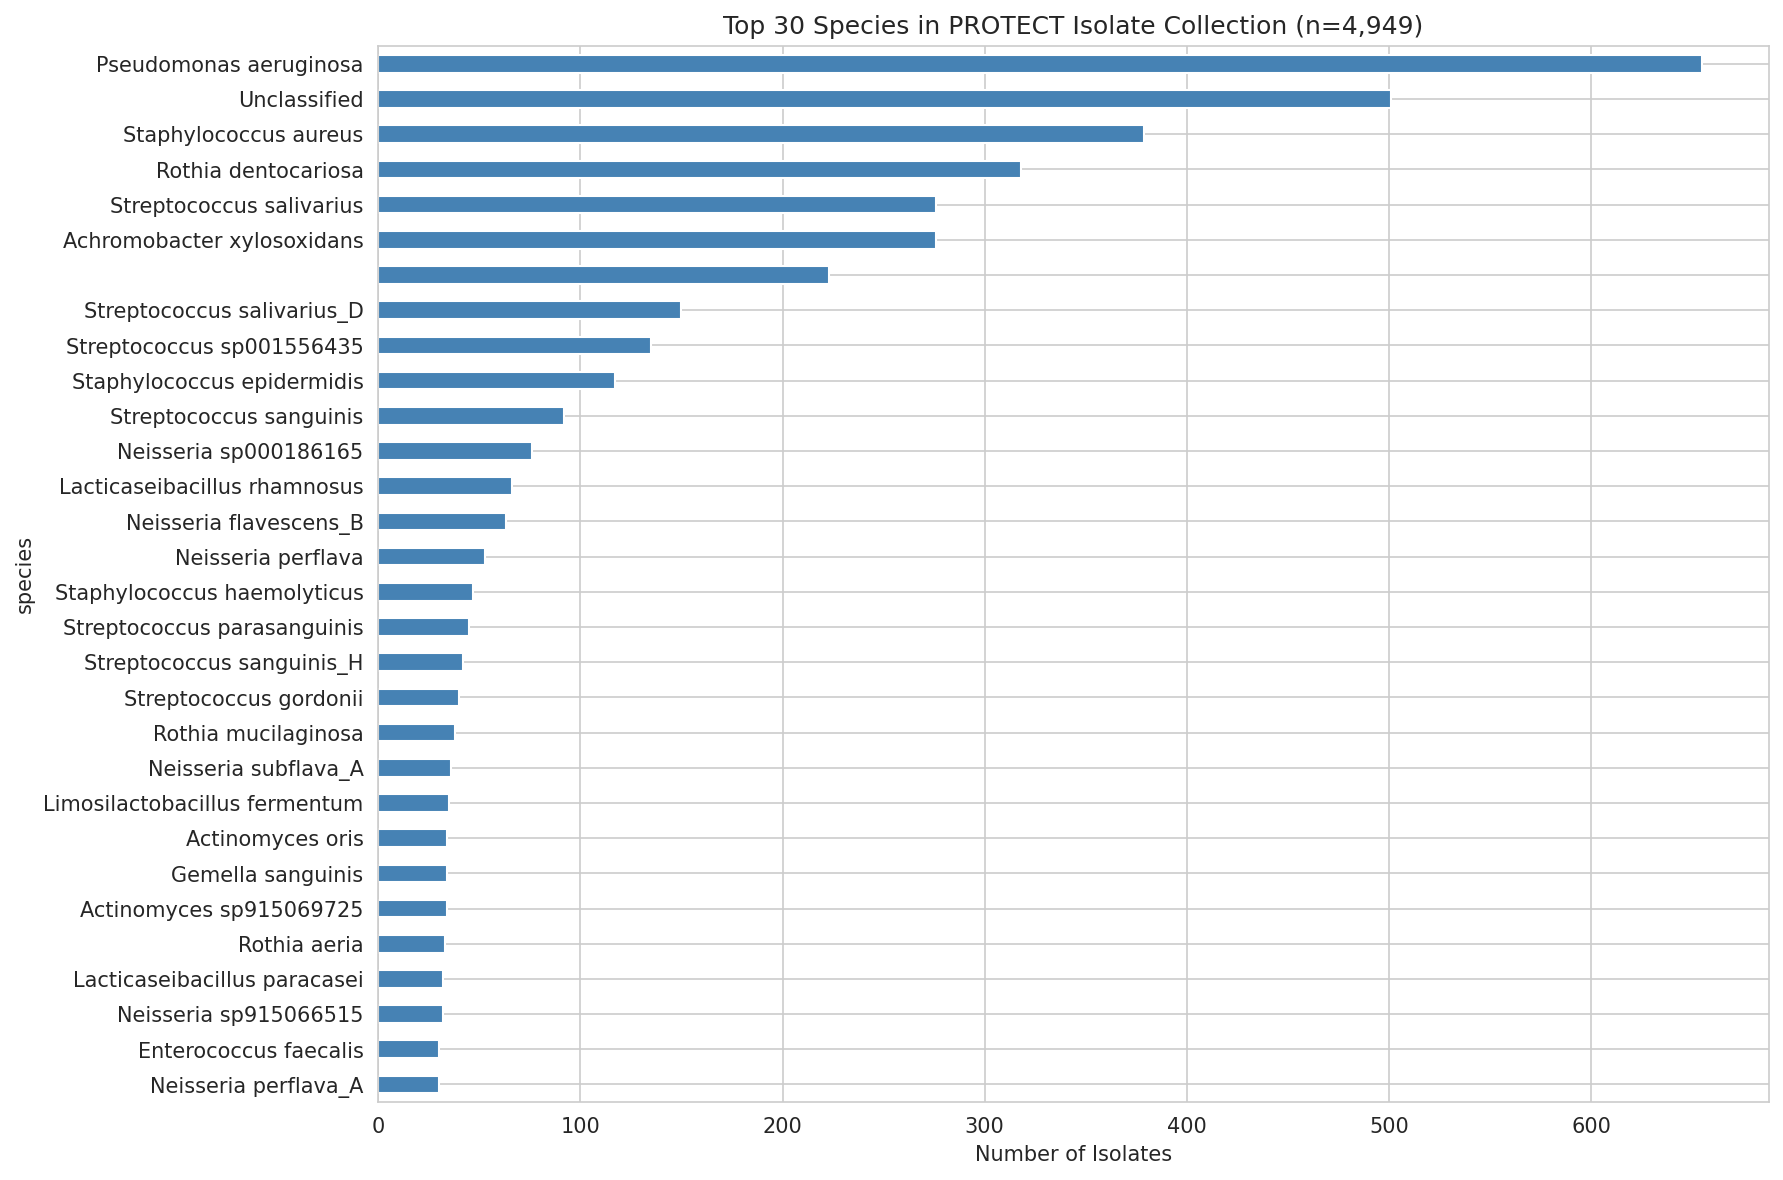
This project integrates experimental data from the PROTECT CF Synbiotic Cocktail Study (4,949 isolates, 175 patient samples, planktonic inhibition assays, carbon source utilization, growth kinetics) with BERDL genomic resources (GapMind metabolic predictions, BacDive phenotypes, PhageFoundry pathogen genomes) to design and rank probiotic formulations that competitively exclude P. aeruginosa from CF airways.
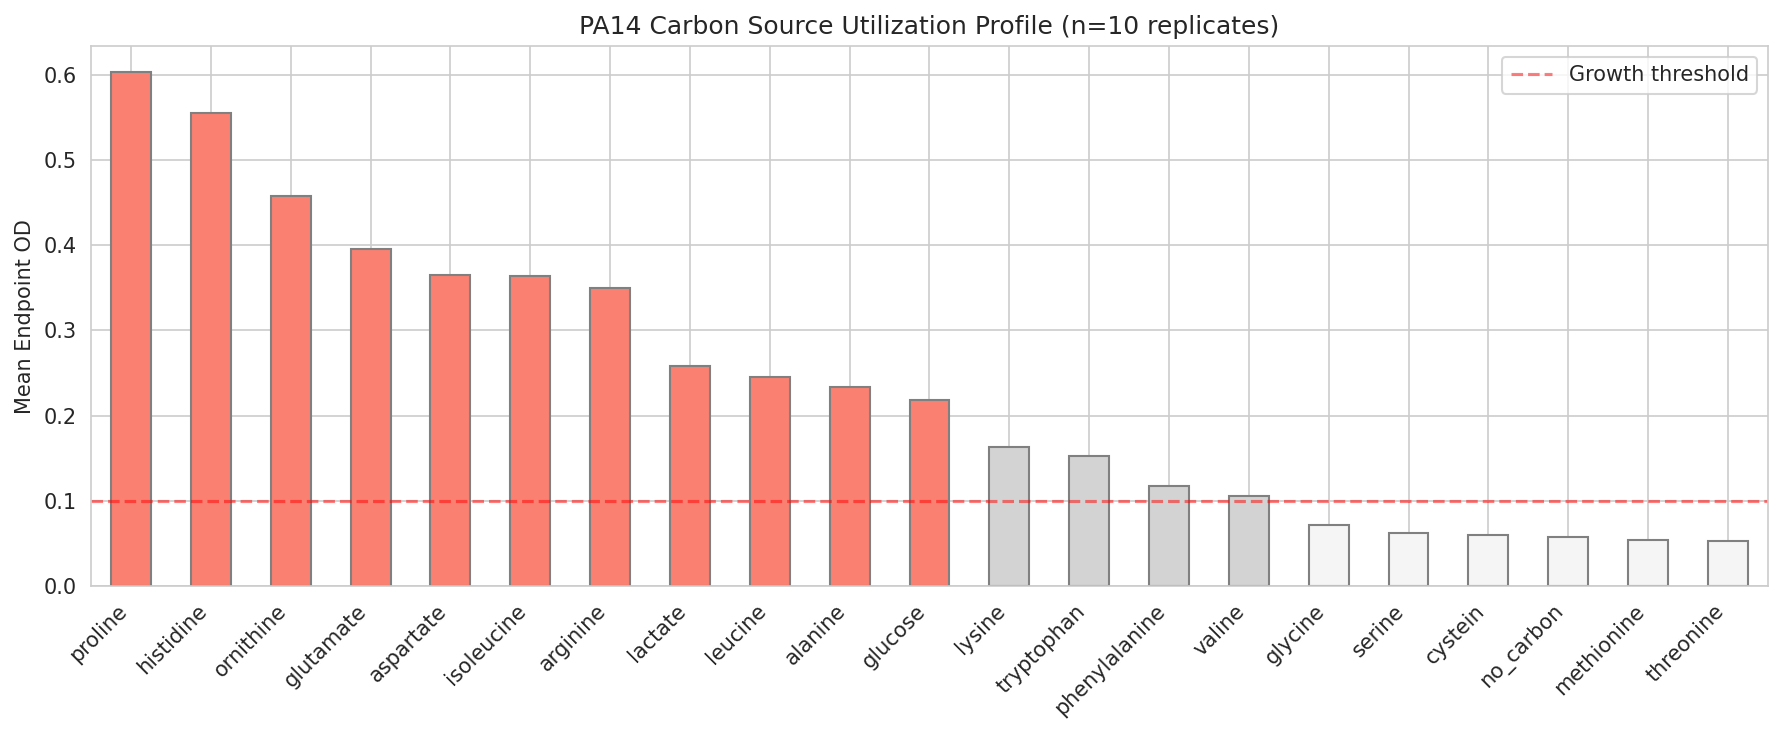
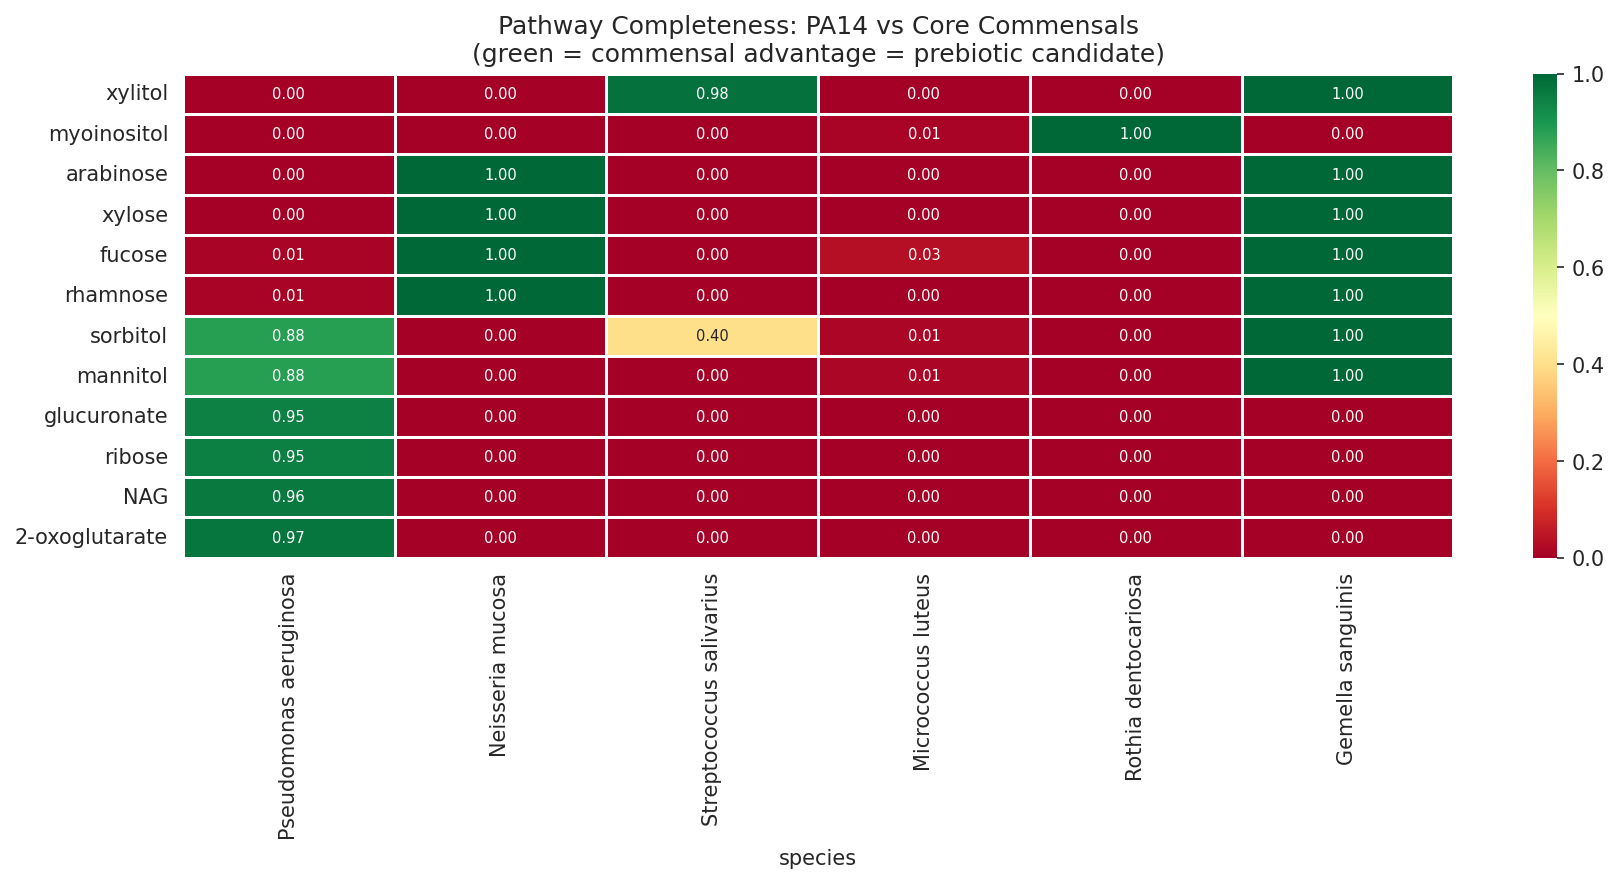
The design theory is metabolic competitive exclusion — commensal organisms that consume the same carbon sources as PA14 (especially amino acids: proline, histidine, ornithine, glutamate, aspartate, arginine) can starve the pathogen. Formulations are optimized for complementary niche coverage, engraftability across patients, growth rate advantage, and FDA safety. Prebiotics that selectively feed the probiotics but not PA14 complete the synbiotic design.
Data Collections
Review
Summary
This is an exceptionally thorough and well-executed project that integrates experimental inhibition, carbon utilization, growth kinetics, patient metagenomics, and BERDL pangenome data into a multi-criterion framework for designing probiotic formulations against P. aeruginosa in CF airways. The 14 notebooks form a coherent analytical arc from data integration through formulation optimization to pangenome validation and PA virulence characterization. All notebooks have saved outputs (160/160 code cells), 41 figures are generated and saved, 25 data files with a comprehensive data dictionary are produced, and the REPORT.md is publication-quality with clear rationale, quantified findings, honest limitations, and actionable proposed experiments. The project's strongest contribution is the multi-layered validation — exhaustive combinatorial search, bootstrap confidence intervals, pangenome conservation, and PA strain robustness analysis — that moves the formulation recommendation from a single optimization result to a well-defended design. The main areas for improvement are minor reproducibility details (Spark version pinning), a computational gap in pairwise interaction sensitivity analysis, and a few documentation clarifications.
Methodology
Research question: Clearly stated, testable, and well-scoped. The multi-criterion framing (metabolic competition + kinetics + ecology + safety) is appropriate for a formulation design problem and avoids over-reliance on any single metric.
Hypotheses: Six hypotheses (H0–H6) are explicitly stated in RESEARCH_PLAN.md with testable predictions. The observed outcomes are documented against each hypothesis, including partial support (H1, H6), rejection (H4 for amino acids), and confounders. This is good scientific practice.
Data sources: Exceptionally well documented. The RESEARCH_PLAN.md includes a complete table of 23 PROTECT Gold tables with row counts and roles, plus 6 BERDL databases with specific tables and purposes. The README identifies which notebooks require Spark vs run locally.
Approach soundness: The analytical logic is well-structured — each notebook addresses a specific question motivated by a gap in the preceding analysis. The progression from single-organism scoring (NB03) to combinatorial optimization (NB05/05b) to pangenome validation (NB07) to robustness testing (NB10) follows sound design principles. The decision to run both permissive and strict safety filters (NB05 vs NB05b) with staged comparison is a strength.
Reproducibility:
- Notebook outputs: All 14 notebooks have 100% saved outputs (160/160 code cells with non-empty output arrays), including 40 figure-producing cells. This exceeds the requirement.
- Figures: The figures/ directory contains 41 PNG files covering every major analysis stage — EDA (10 figures from NB01), kinetics (4), inhibition modeling (4), ecology (1), formulation optimization (3), prebiotic analysis (1), pangenome conservation (2), interactions (2), genomic extension (1), PA adaptation (6), growth prediction (1), virulence (4), and phylogenetics (2).
- Dependencies: requirements.txt covers all local-run Python packages with minimum versions. One gap: pyspark and berdl_notebook_utils versions are not specified.
- Reproduction guide: The README includes a clear ## Reproduction section with a dependency DAG, local vs Spark designation, and runtime estimates. The NB11→NB10 consolidation is explained.
- Spark/local separation: Five Spark notebooks (NB07, NB09, NB10, NB13, NB14) are clearly marked with ★ in the DAG. Downstream notebooks that consume their output (e.g., NB12 from NB10) run locally from cached TSV files.
Code Quality
SQL queries: The Spark SQL in NB07, NB10, and NB13 is well-structured:
- CTE-based scoring with CASE WHEN for GapMind score conversion (NB07 cell 7, NB10 cell 6) — correct and readable
- Proper IN clause construction for genome ID filtering with parameterized Python f-strings
- Batch processing for large gene cluster queries in NB13 (cell 4, batch_size=200) — avoids SQL length limits
- KEGG ortholog supplementation for under-annotated genes (NB13 cell 5) — creative use of eggNOG as fallback for psl genes
- NB07 correctly uses gtdb_species_clade_id format for clade filtering (relevant pitfall from docs/pitfalls.md)
- NB07 cell 4 explicitly tries both RS_GCF_ and GB_GCA_ prefixes for genome ID resolution
Known pitfalls addressed:
- gapmind_pathways.clade_name = gtdb_species_clade_id format — NB07 correctly queries by full clade ID
- gapmind_pathways.metabolic_category values 'aa' and 'carbon' — correctly used throughout
- Genome ID prefix handling (RS_/GB_) — explicitly handled in NB07 cell 4
- String-typed numeric columns — GapMind scores are cast via CASE WHEN rather than relying on string comparison
- Taxonomy join uses genome_id not gtdb_taxonomy_id — NB07 cell 11 joins genome to ncbi_env via ncbi_biosample_id, avoiding the taxonomy join pitfall entirely
Statistical methods: Appropriate throughout:
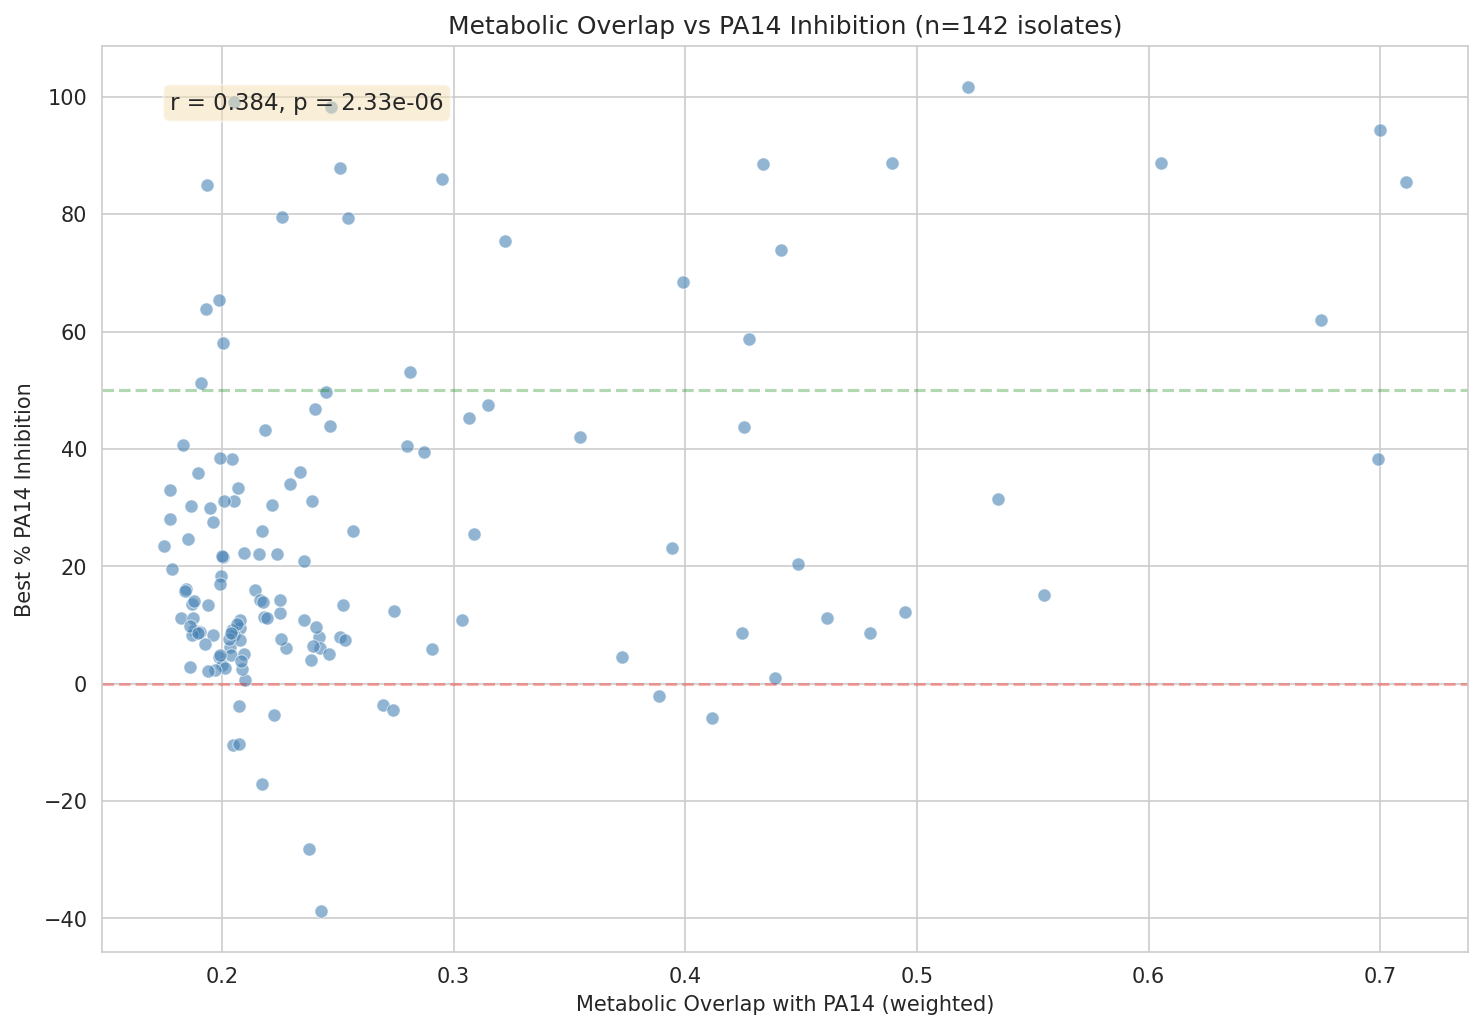
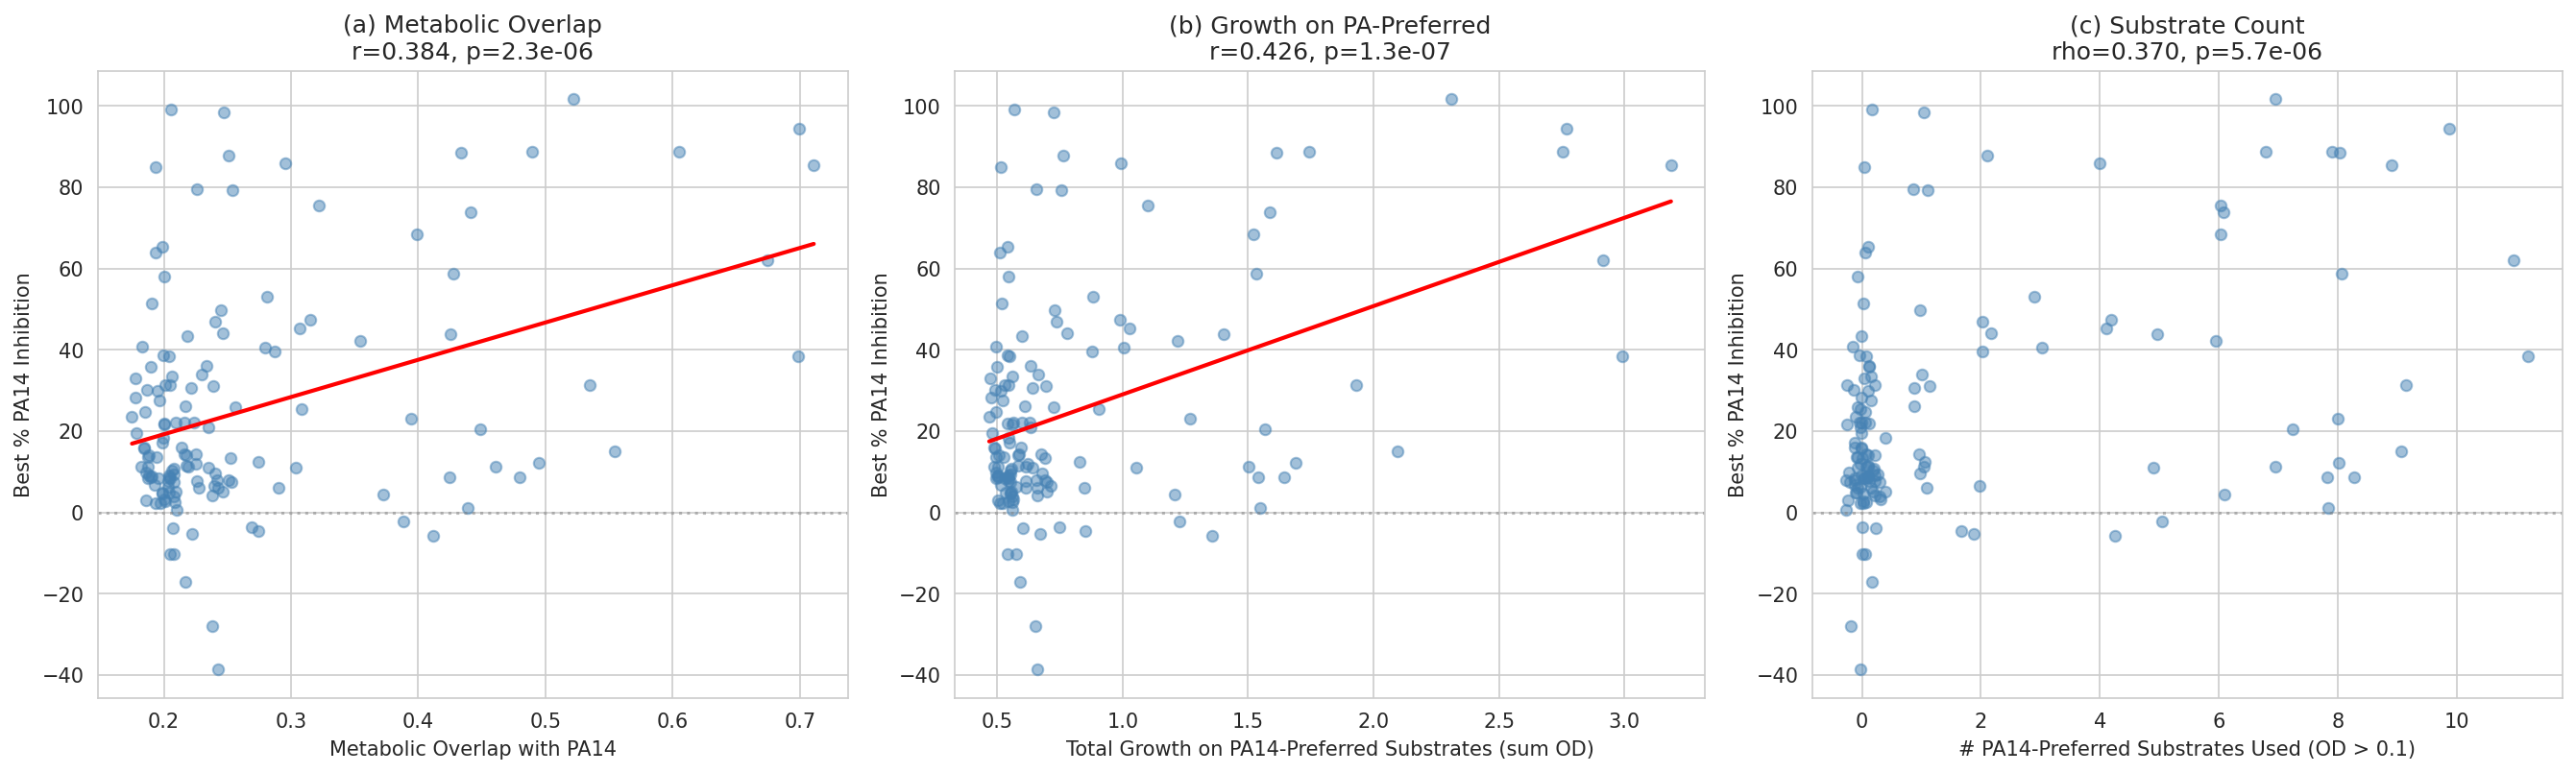
- Pearson correlation + multivariate OLS for metabolic overlap → inhibition (NB03)
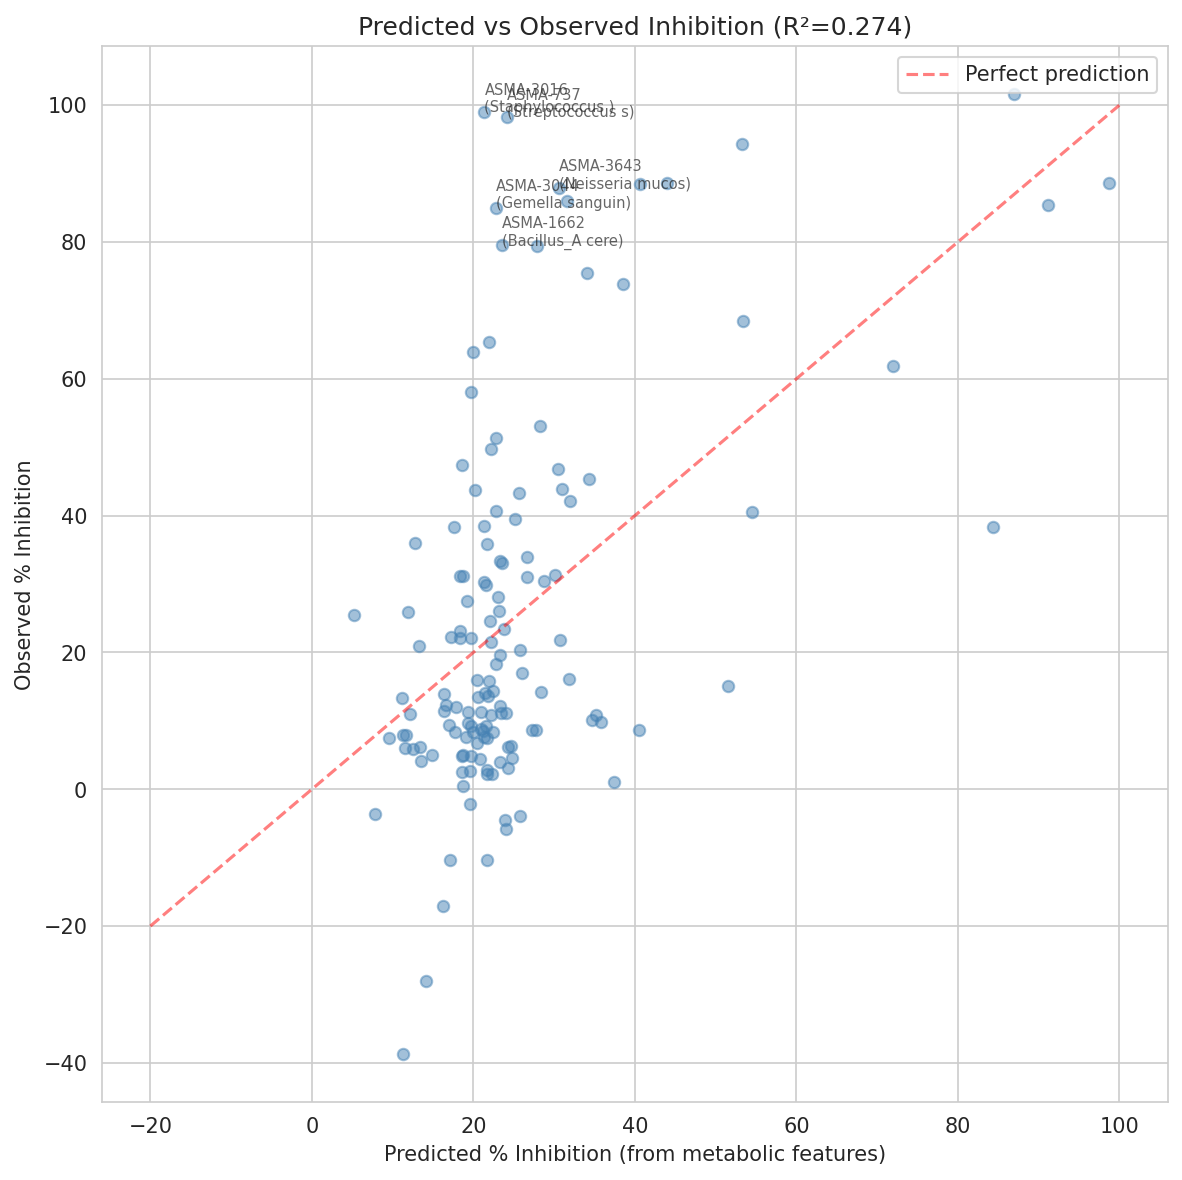
- 5-fold cross-validation to detect overfitting (R² = 0.274 training vs 0.145 CV — correctly flagged as evidence of overfitting)
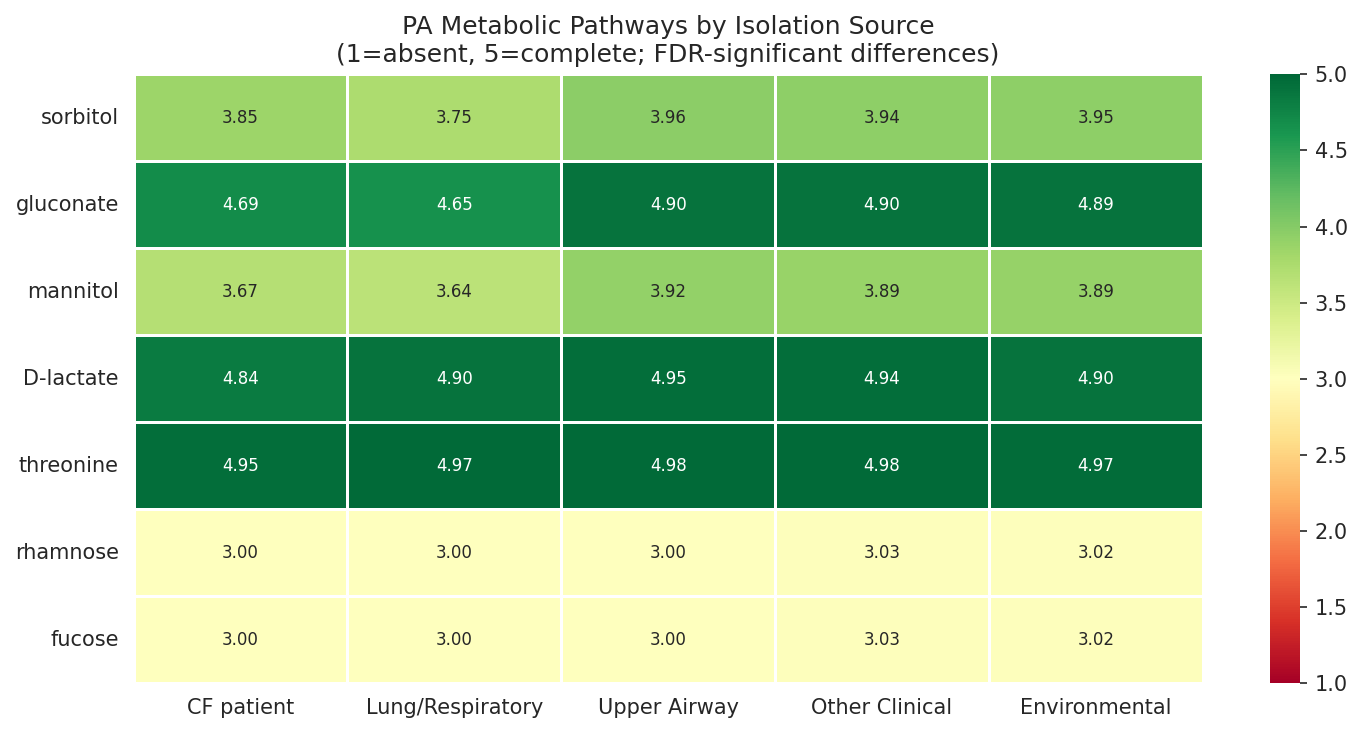
- Mann-Whitney U with Benjamini-Hochberg FDR for lung vs non-lung pathway comparisons (NB10)
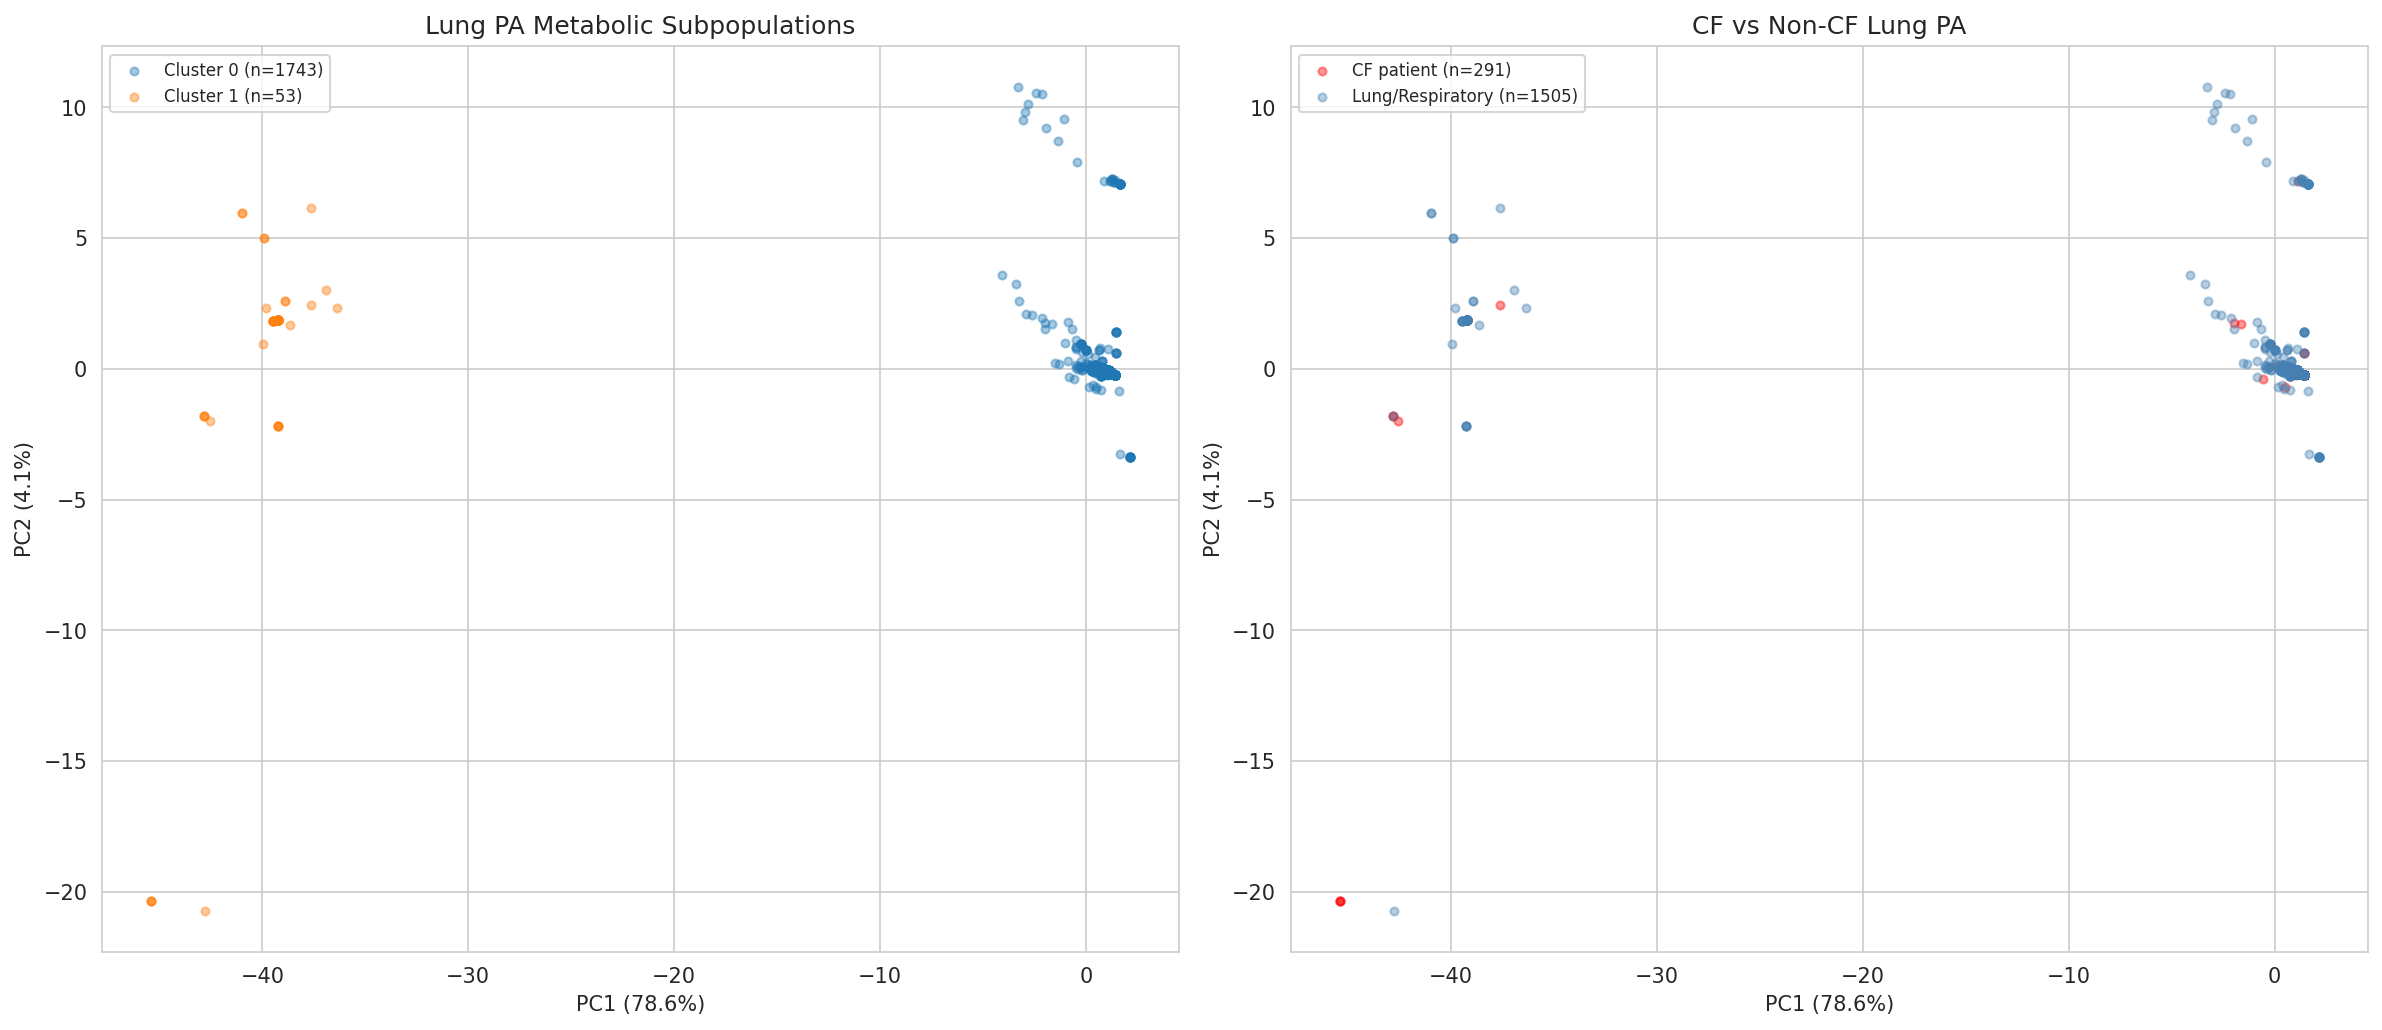
- K-means clustering with silhouette score for PA metabolic subpopulations (NB10)
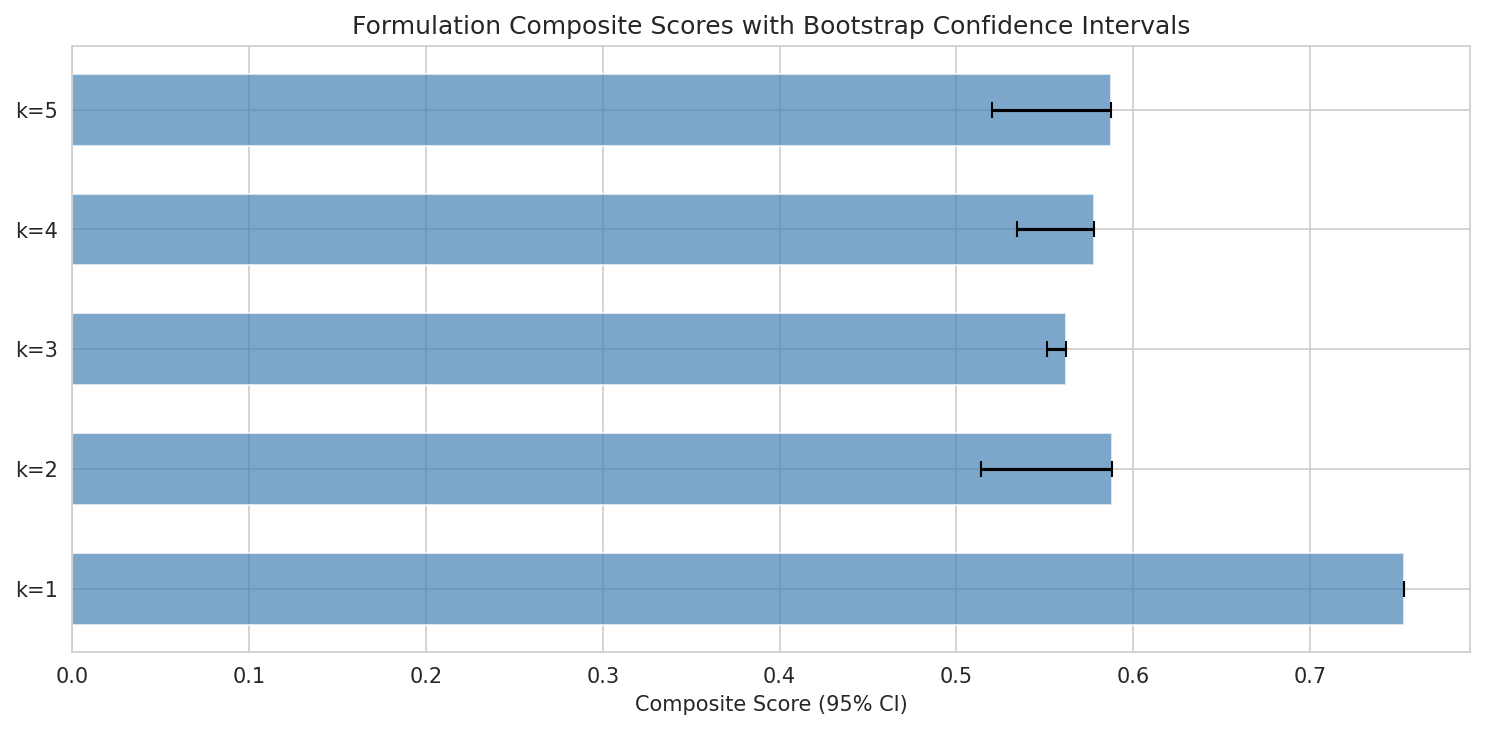
- Exhaustive combinatorial enumeration confirming greedy optimization is globally optimal (NB05b cell 10)
- Bootstrap resampling (N=1,000) for composite score confidence intervals with proper seed setting (NB05b cell 17)
Notebook organization: Each notebook follows a consistent pattern: imports/setup → data loading → analysis → visualization → data export → summary. Markdown cells provide rationale and interpretation. Consistent path variables (DATA, FIGS, GOLD) across all notebooks. The use of warnings.filterwarnings('ignore') is standard for analysis notebooks.
Minor code observations:
- NB07 cell 5 uses LIKE '{gtdb_prefix}%' for species clade lookup — this could theoretically match unintended clades if the prefix is short, though for the specific five-species queries here the risk is negligible
- NB13 cell 4 has [:500] slice on target_cluster_ids that appears to be a leftover from development, but is functionally overridden by the subsequent batched loop — no impact on correctness
Findings Assessment
Conclusions are well-supported: Every major claim in REPORT.md is backed by specific quantitative evidence and linked to a source notebook/figure:
- Metabolic overlap correlation (r = 0.384, p = 2.3×10⁻⁶) with honest cross-validation deflation (CV R² = 0.145)
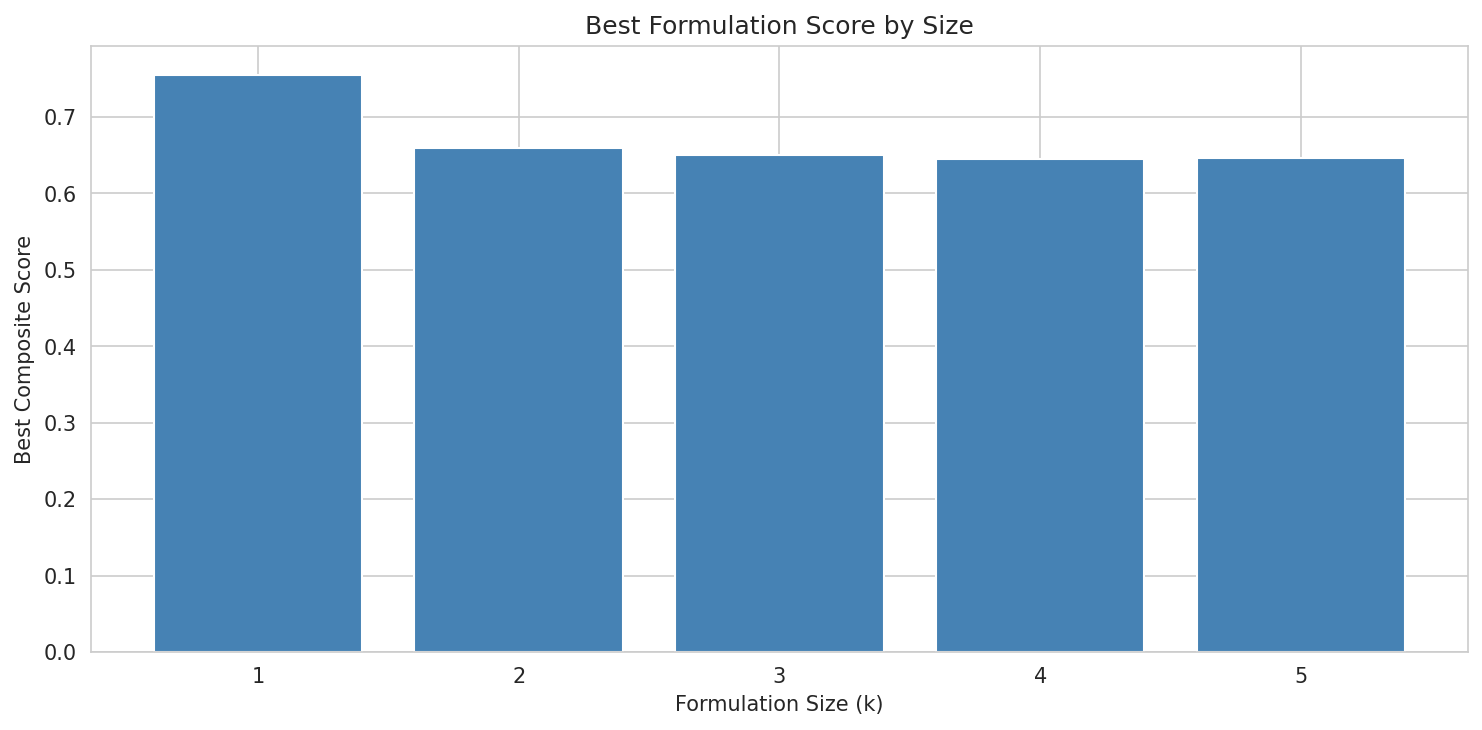
- 100% niche coverage at k=3 with exhaustive validation of 127,598 triples confirming global optimality
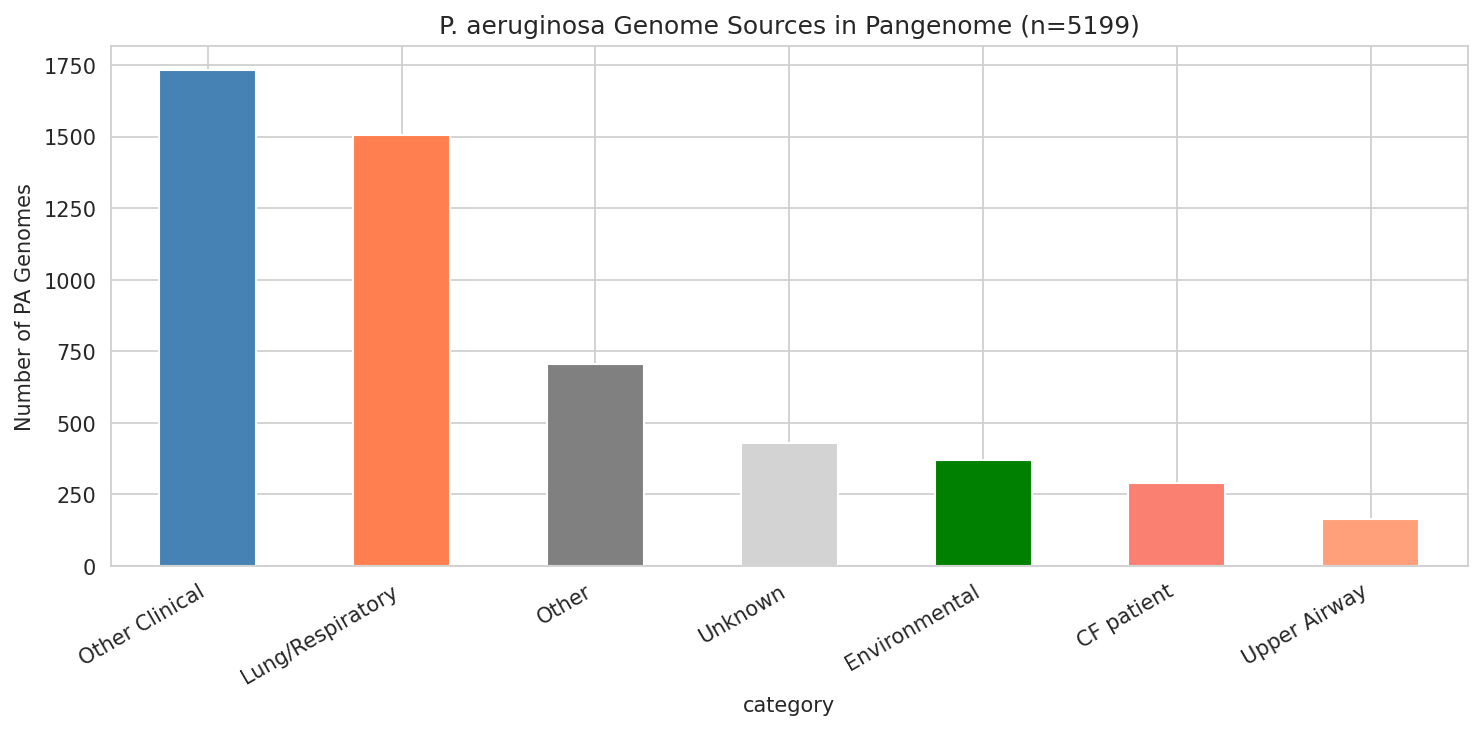
- 97.4% amino acid pathway conservation across 1,796 lung PA genomes
- Sugar alcohol prebiotic candidates with 100% vs 0% pathway completeness
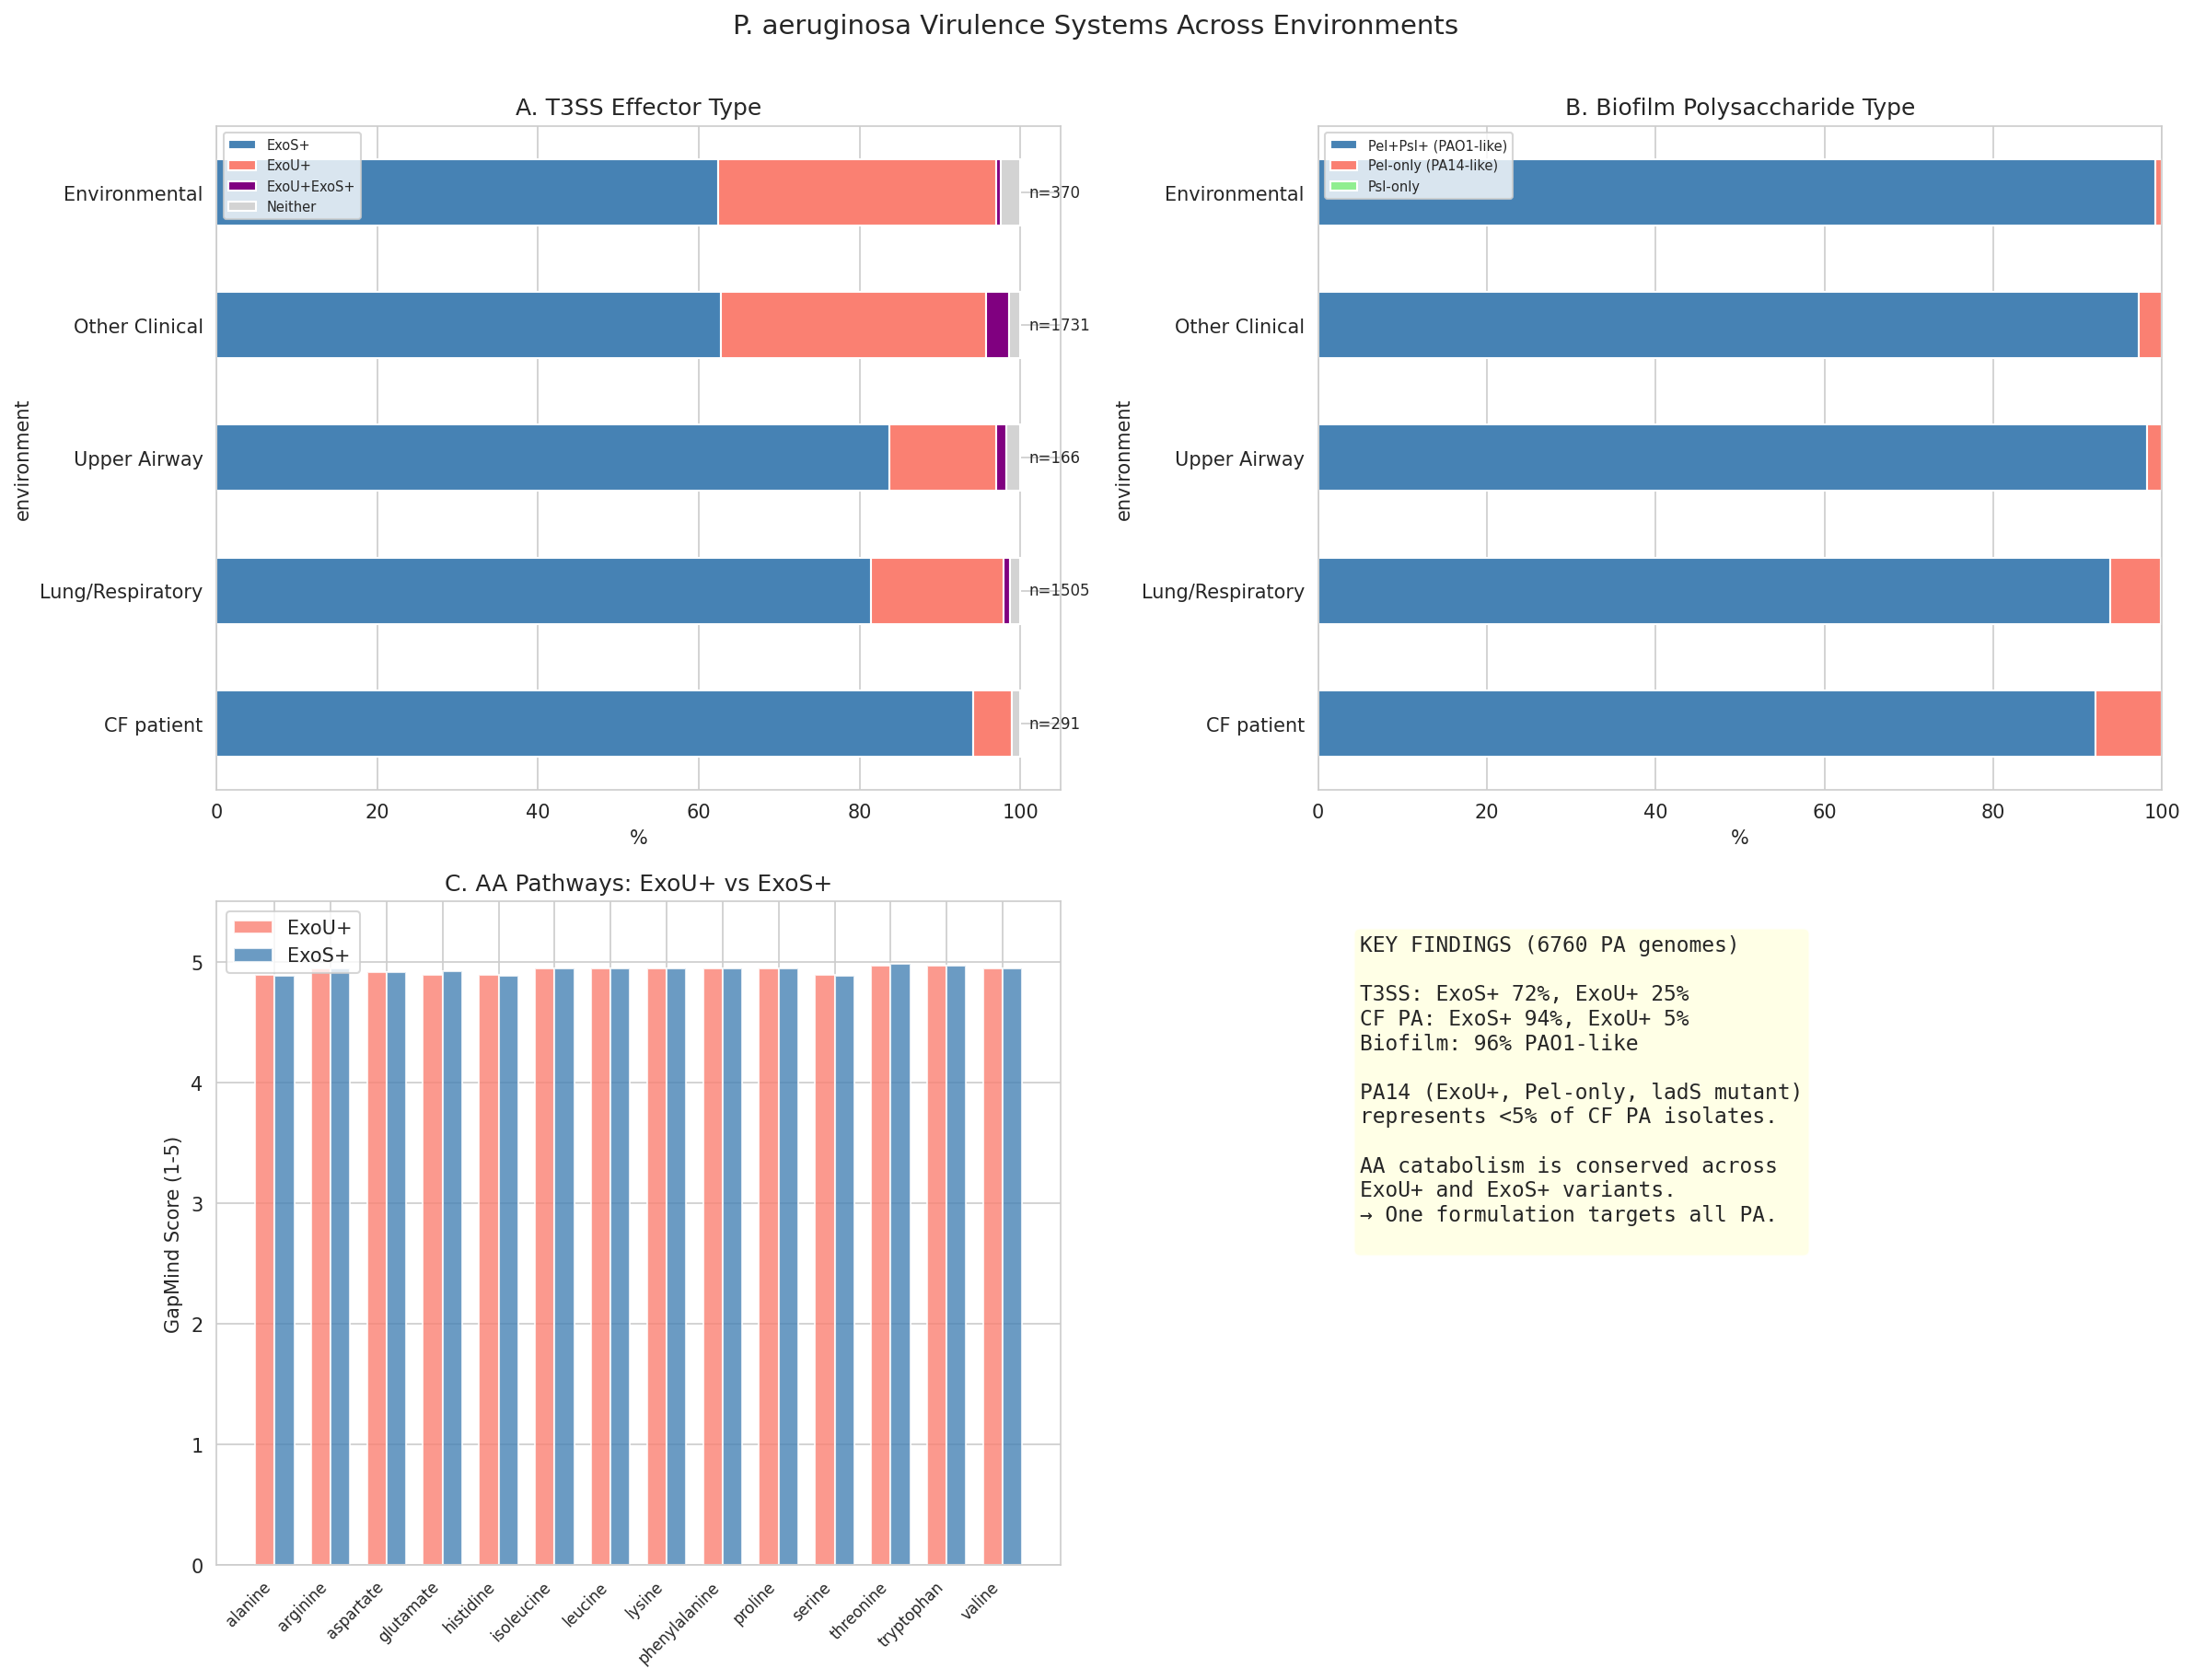
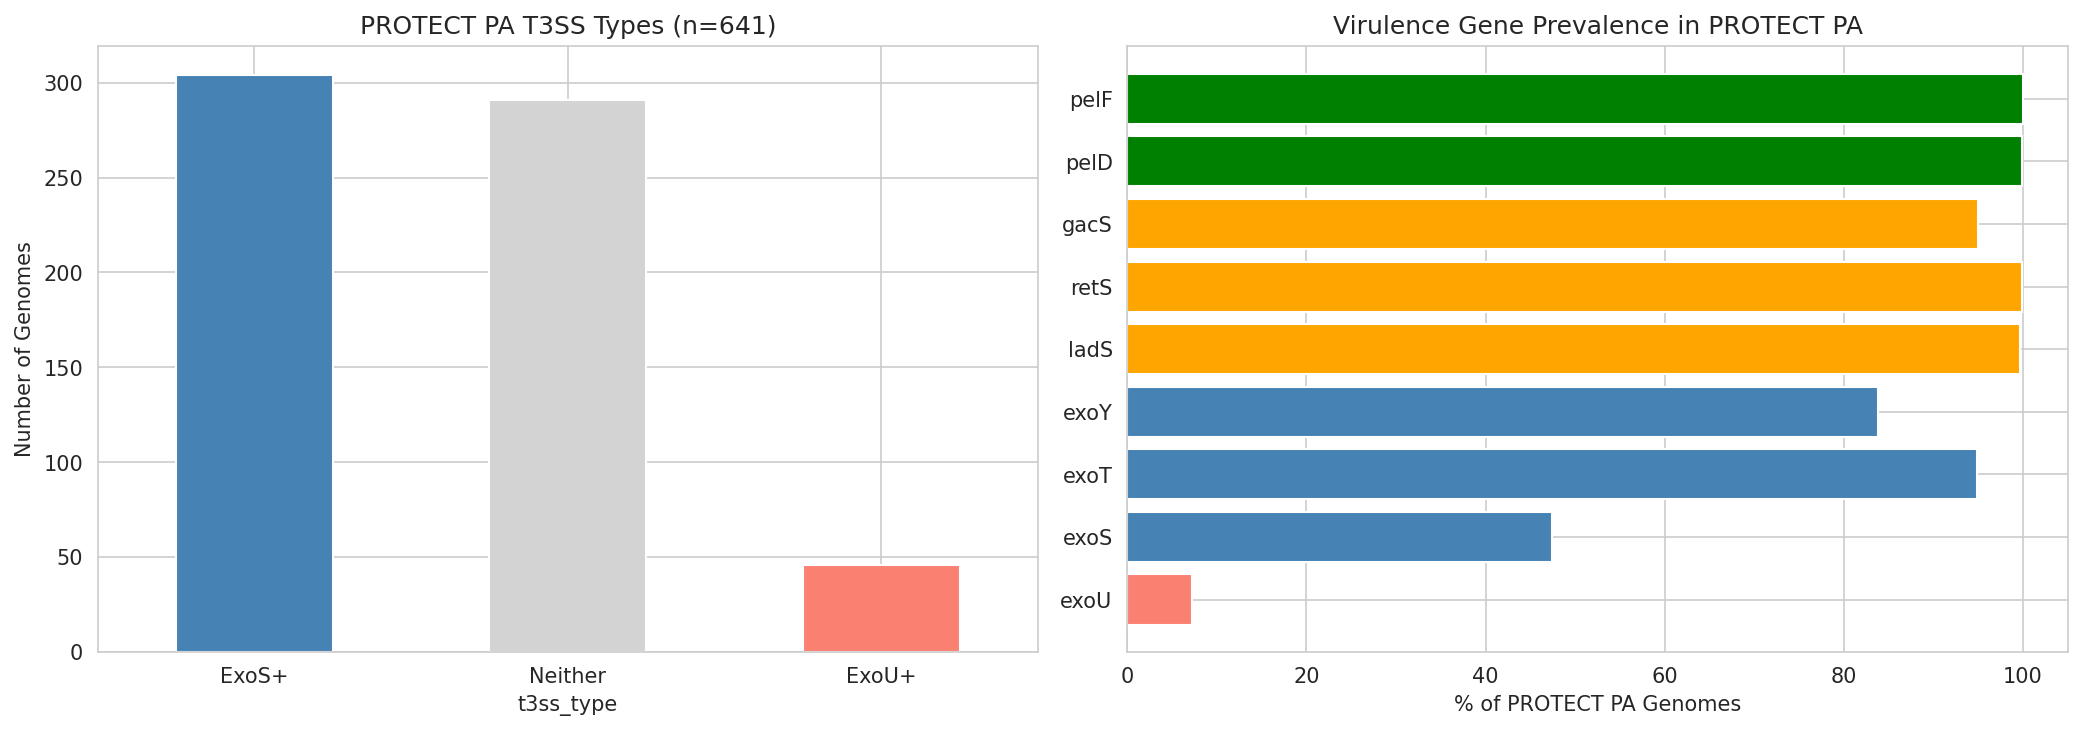
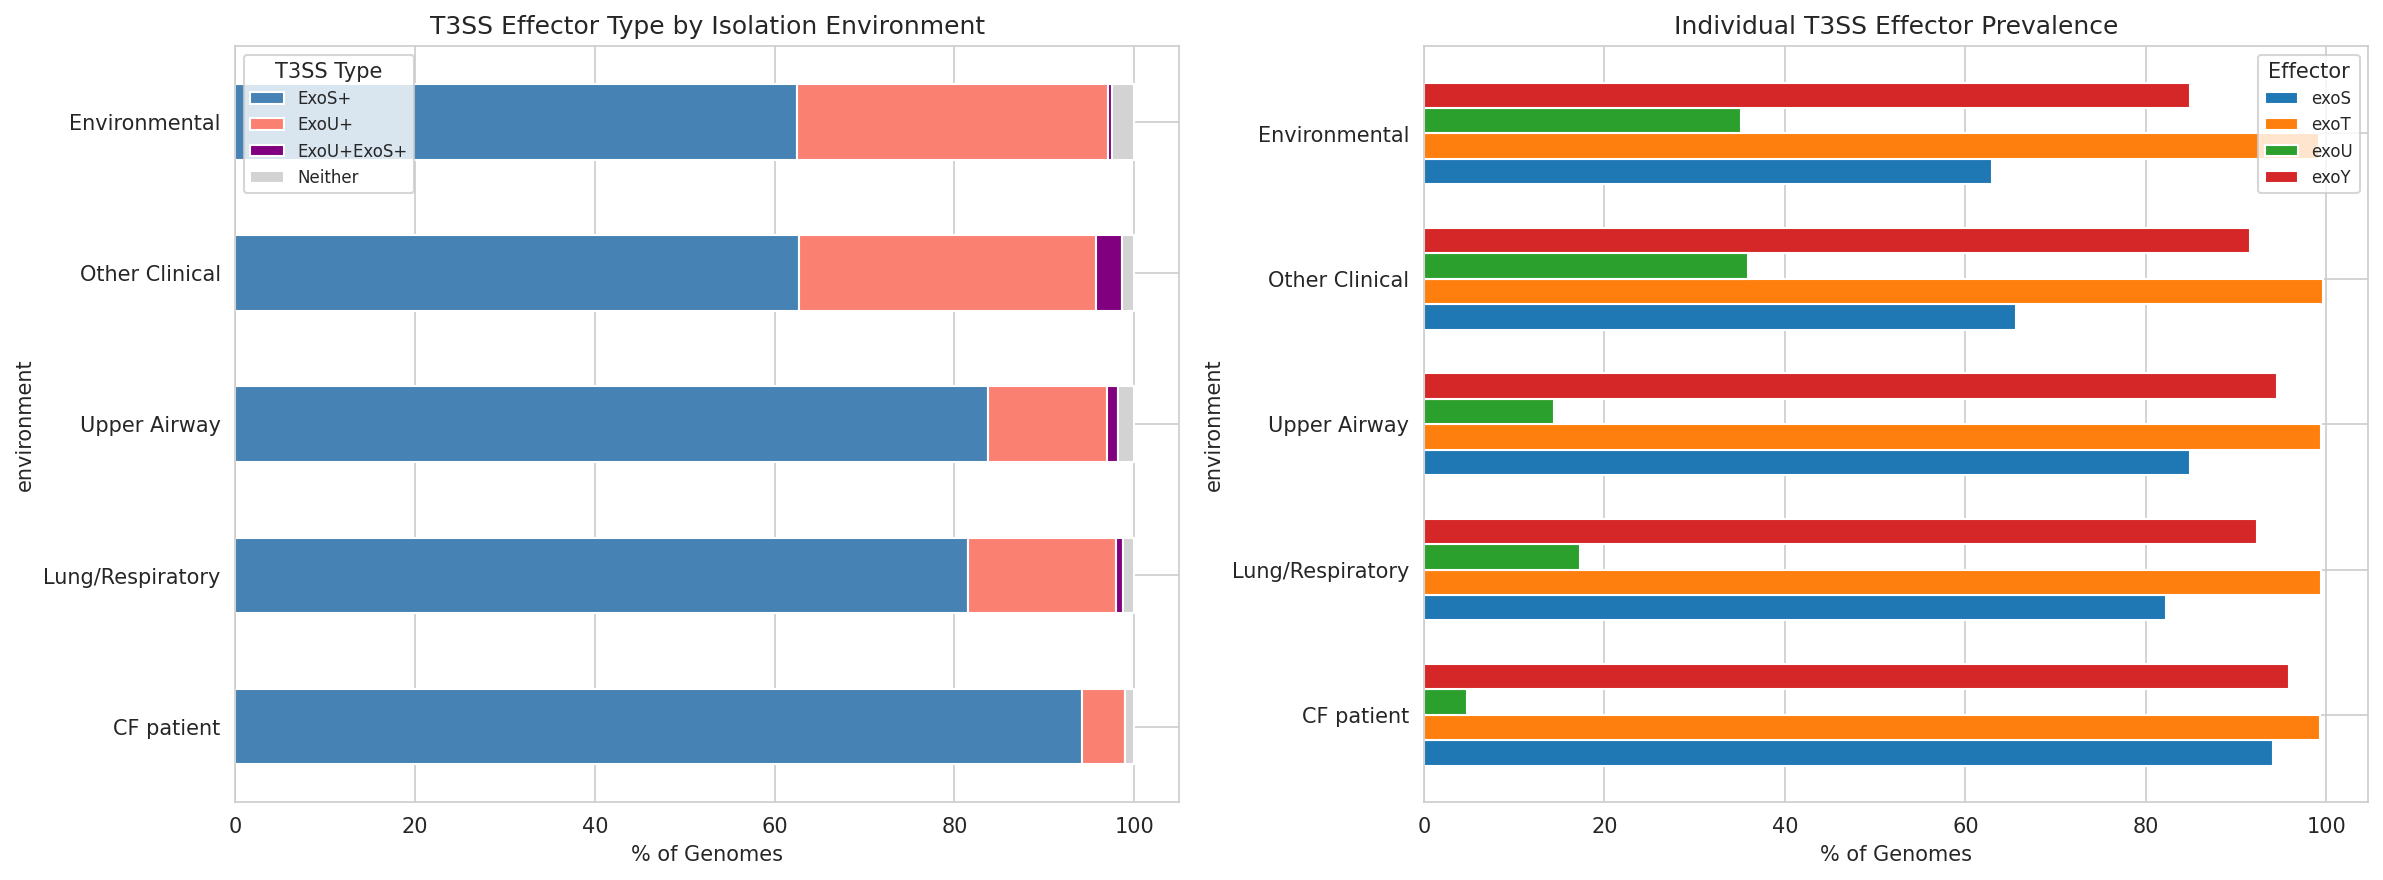
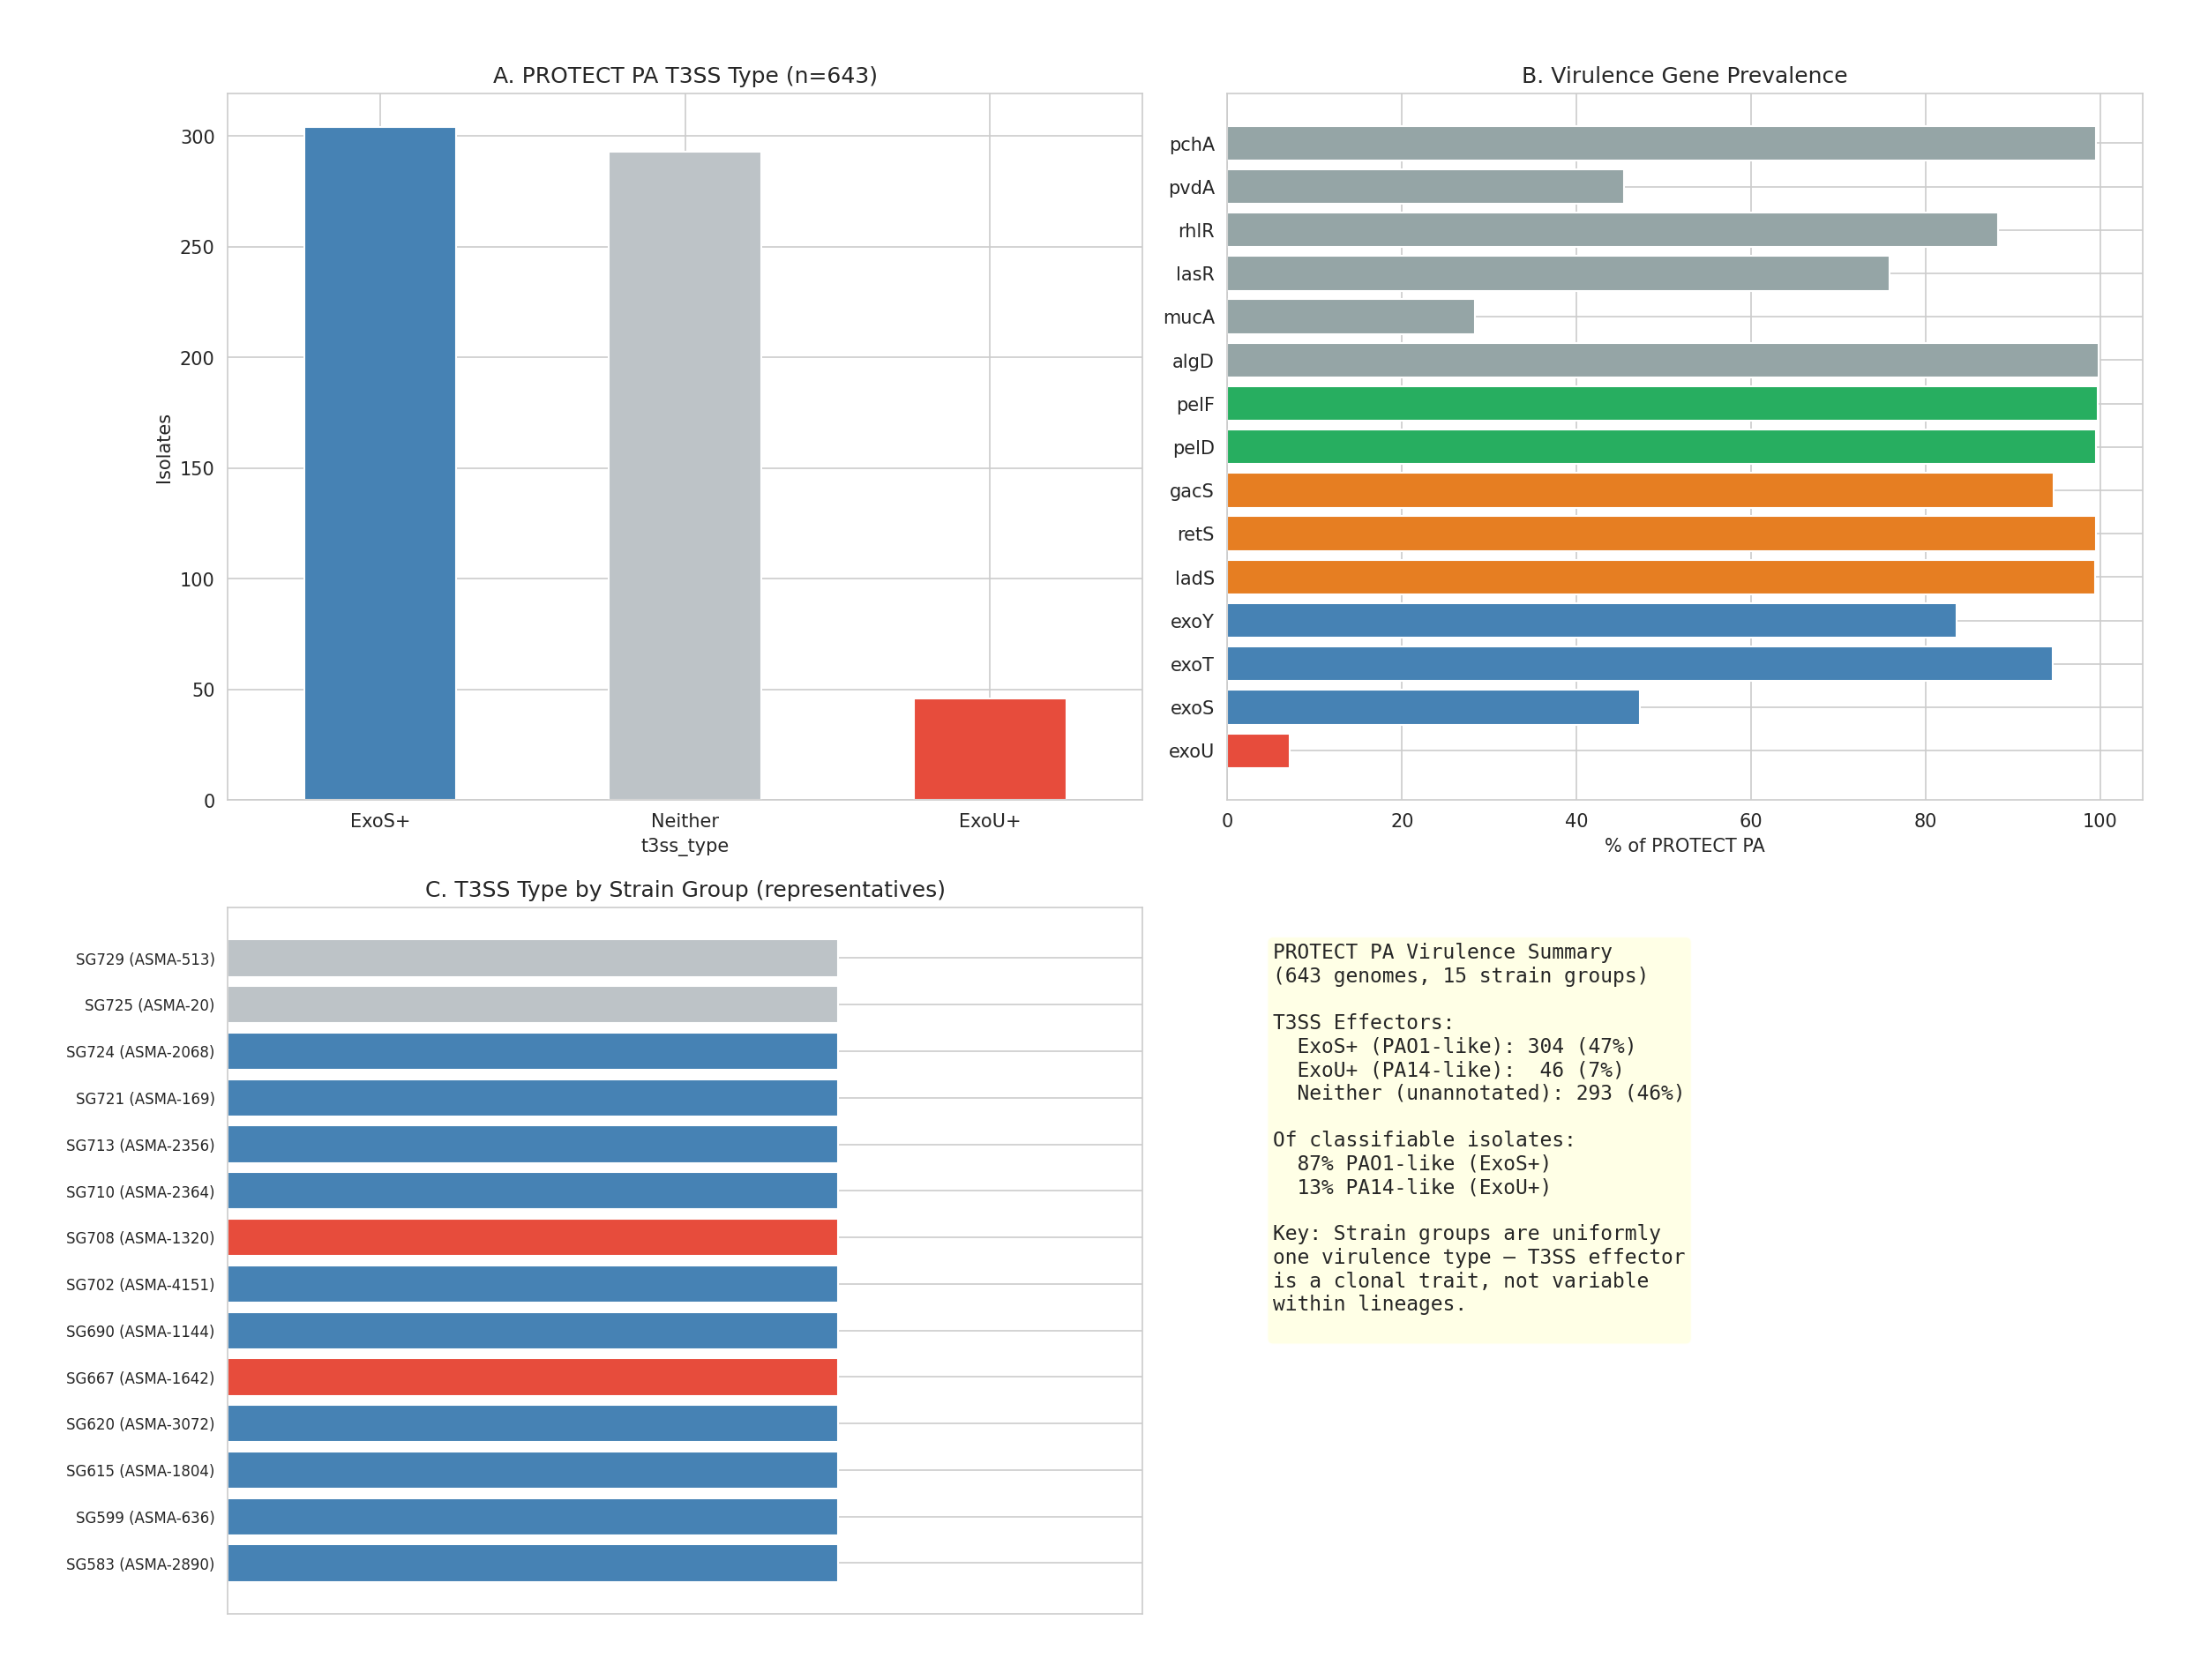
- PA14 represents <5% of CF PA virulence genotype, with amino acid catabolism identical across genotypes
Limitations thoroughly acknowledged: Section 3.7 lists 9 specific limitations including planktonic-only culture, sparse pairwise data (8 comparisons from 5 pairs), PA14 reference strain bias, the fact_pairwise_interaction data quality issue, N. mucosa clade ambiguity, and the 142-isolate core cohort enrichment for deeply-characterized species. The PA14 virulence representativeness issue (NB13/NB14) is handled particularly well — discovered mid-project, honestly reported, and then mitigated by demonstrating mechanism independence from virulence genotype.
The M. luteus engraftment tension: This is the project's most important unresolved design question and is handled with intellectual honesty. The report recommends k=2 (R. dentocariosa + N. mucosa) as the primary clinical candidate despite k=3 achieving superior niche coverage, specifically because of M. luteus's zero lung genomes and zero engraftability. This conservative recommendation increases translational credibility.
Data quality discovery: NB08's finding that fact_pairwise_interaction is identical to fact_carbon_utilization (correlation = 1.0) is an important data provenance observation that limits per-substrate co-culture analysis. The report correctly restricts interaction conclusions to the RFU-based competition assay.
Incomplete elements: None detected. All 14 notebooks produce outputs and save data files. The NB11 numbering gap is documented as intentional consolidation into NB10. The REPORT covers findings from all notebooks. The 8-revision RESEARCH_PLAN history demonstrates iterative refinement.
Suggestions
Critical
-
Add Spark environment version pinning: The
requirements.txtcovers local-run dependencies but omitspysparkandberdl_notebook_utilsversions needed for NB07, NB09, NB10, NB13, and NB14. Add a note in README or a separaterequirements-spark.txtspecifying the Spark environment assumed (e.g.,pyspark>=3.4, specificberdl_notebook_utilsversion). Without this, Spark notebooks may fail on future JupyterHub updates. -
Add pairwise interaction sensitivity analysis: The report correctly identifies the 5-of-10 pairwise interaction gap as the highest-priority experimental limitation (Proposed Experiment 4.1). Consider adding a brief computational sensitivity analysis to NB08 or NB05b showing how formulation rankings would change under pessimistic (all untested pairs antagonistic at −15%) vs optimistic (all additive) assumptions. This would quantify the risk of the additive scoring assumption without requiring new experiments.
Important
-
Clarify N. mucosa clade in formulation claims: NB07 uses
s__Neisseria_mucosa_A(15 genomes) as the primary analysis clade, but the PROTECT isolate maps tos__Neisseria_mucosa(8 genomes). The sensitivity check shows stronger conservation in the 8-genome clade, which is noted in the Limitations. A one-sentence clarification in the Core Species Profiles table (Section 2.6) noting "15 genomes (primary clade), 8 genomes (isolate clade; sensitivity check confirms equal or stronger conservation)" would resolve any reader confusion about which numbers apply. -
Document the
fact_pairwise_interactionidentity issue indocs/pitfalls.md: NB08 discovered these tables are identical. This is a significant data quality finding about the PROTECT Gold tables that could affect future projects. Adding a PROTECT-specific pitfall entry would preserve this knowledge. -
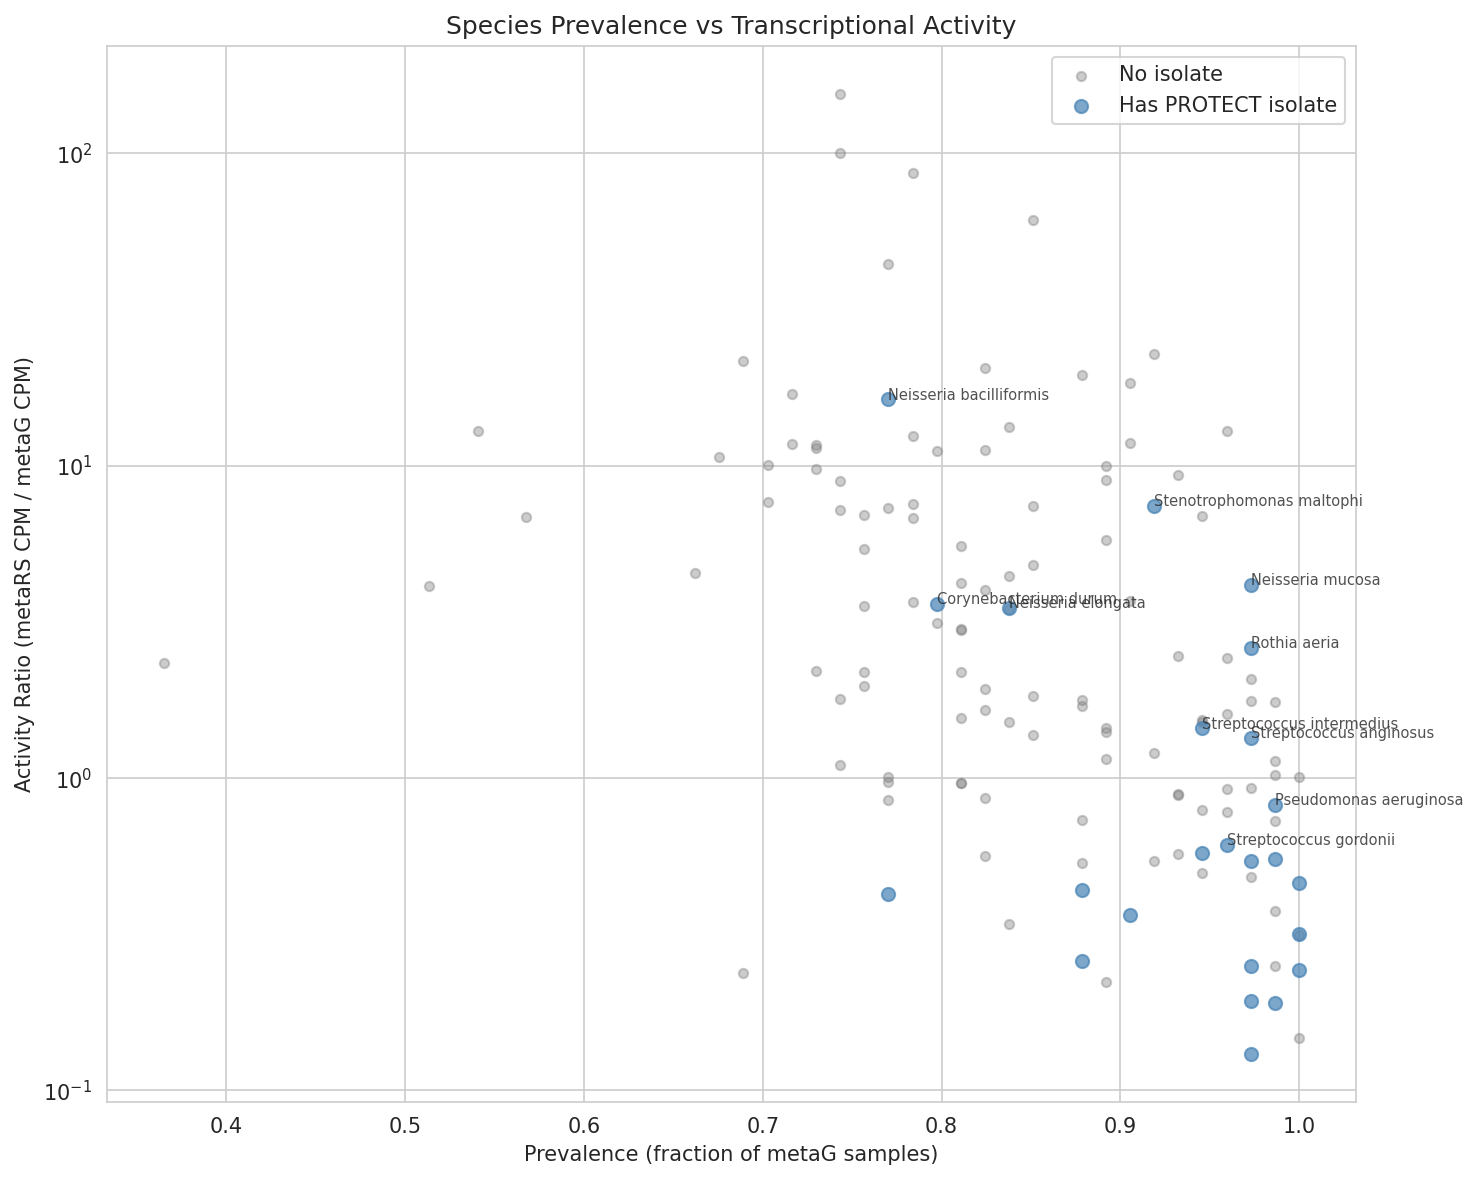
Add a second figure for NB04 patient ecology: NB04 produces only 1 figure (
04_prevalence_vs_activity.png) for a multi-faceted analysis (prevalence, activity ratio, engraftability, safety filtering). A figure showing engraftability scores of formulation species in context of all species — or a patient status effect visualization — would strengthen this notebook's visual communication.
Nice-to-Have
-
Provide a single-command reproduction script: A
run_all.shthat executes notebooks in dependency order (with parallelism for independent branches) would lower the barrier to full reproduction. -
Archive intermediate Spark query results as parquet: NB07, NB10, and NB13 save summary TSVs, but archiving the raw Spark DataFrames (e.g., the 6,760-genome virulence matrix) as parquet would enable downstream re-analysis without Spark access.
-
Report effect sizes for PA lung adaptation: Section 2.12 reports 7 FDR-significant pathways but pathway score differences (−0.165 to −0.204 on a 0–5 scale) may be biologically modest given n=1,796. Reporting Cohen's d alongside p-values would help readers assess practical significance.
-
Consider condensing NB12: The codon usage bias notebook is honestly acknowledged as inconclusive due to GC content confounding (31–73% range). Its findings could be condensed into a supplementary analysis within NB10's PA strain variation section, avoiding a standalone notebook that sets reader expectations for a conclusion that doesn't materialize. The honest treatment of this negative result is commendable regardless.
-
Expand literature contrast with Shao et al. (2026): The report cites Shao et al. for pangenome-guided probiotic design with strong strain-level divergence in Bifidobacterium, contrasting with this project's >95% conservation. A brief note on why the results differ (gut vs respiratory niche, accessory genome mobility, selection pressures) would strengthen the Discussion.
This review was generated by an AI system. It should be treated as advisory input, not a definitive assessment.
Visualizations
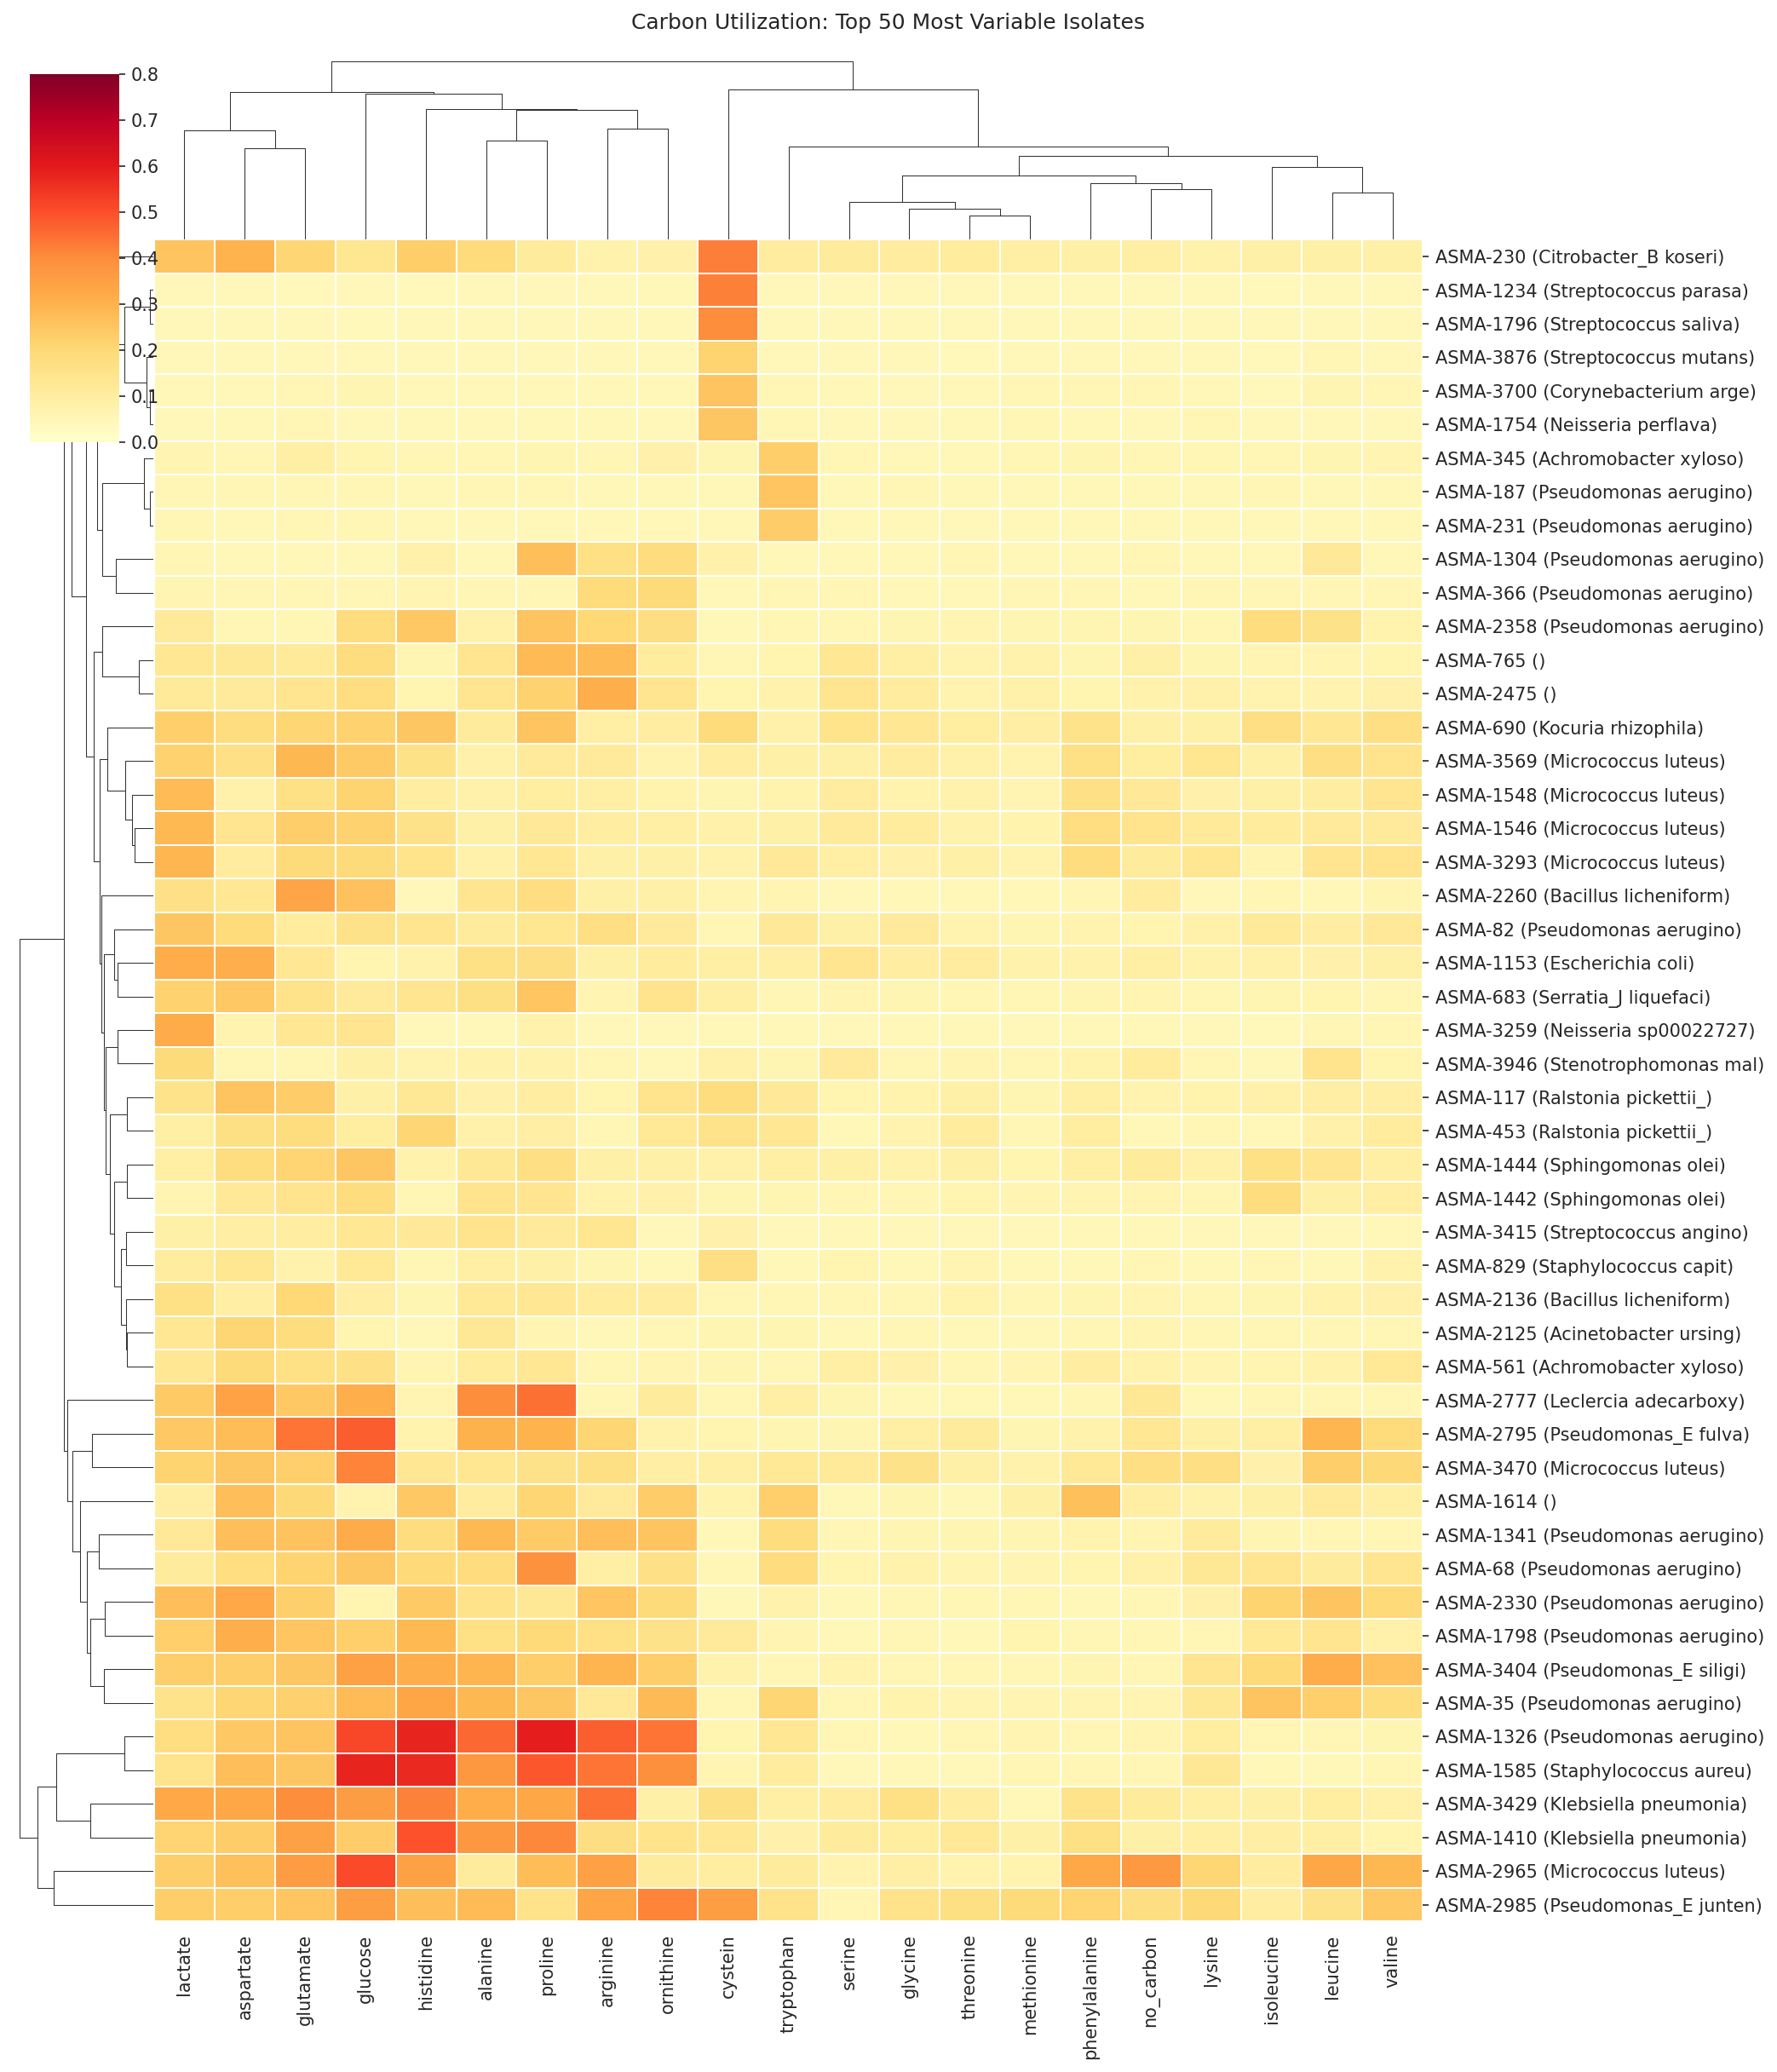
01 Carbon Util Clustermap
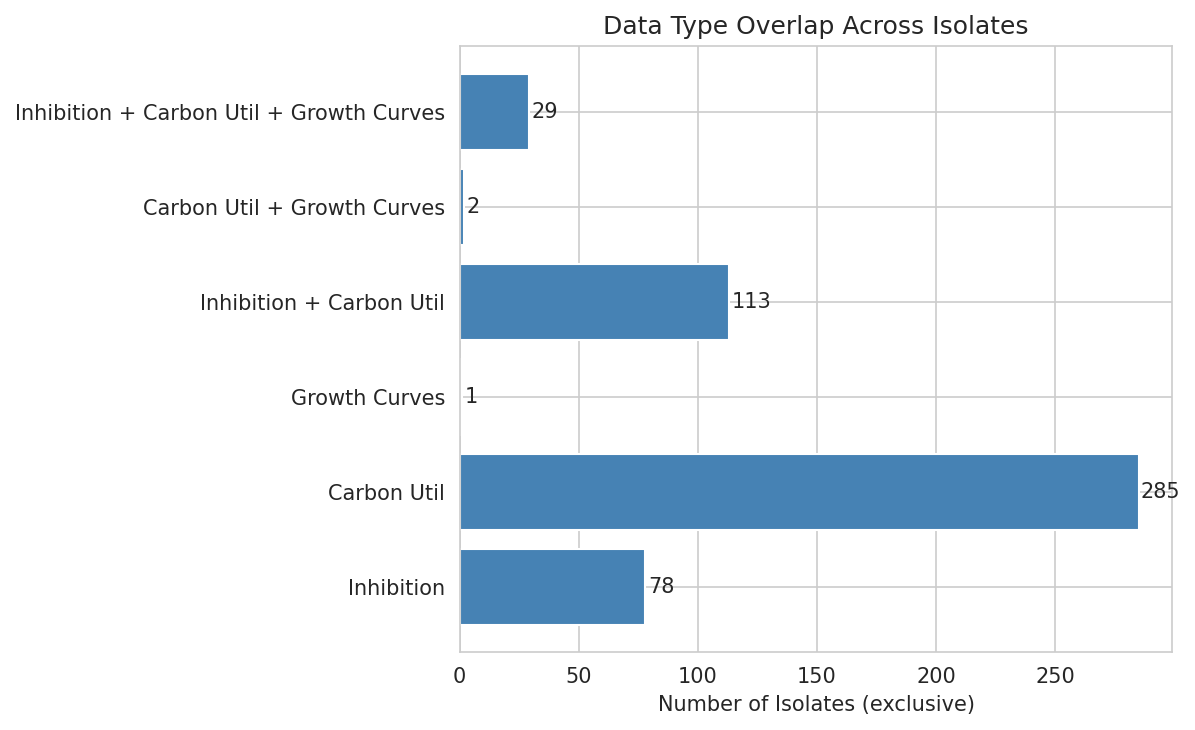
01 Data Overlap
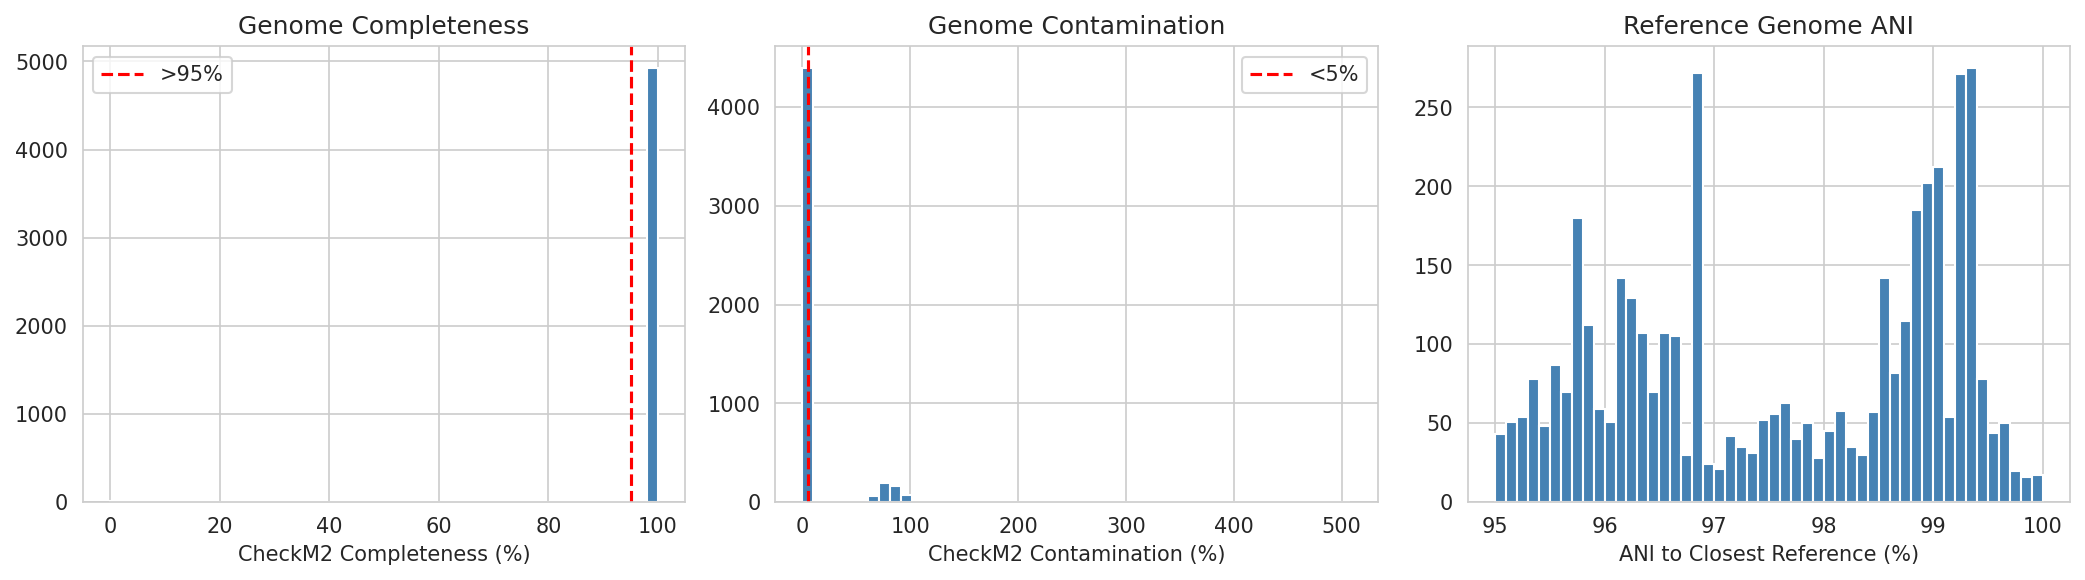
01 Genome Quality
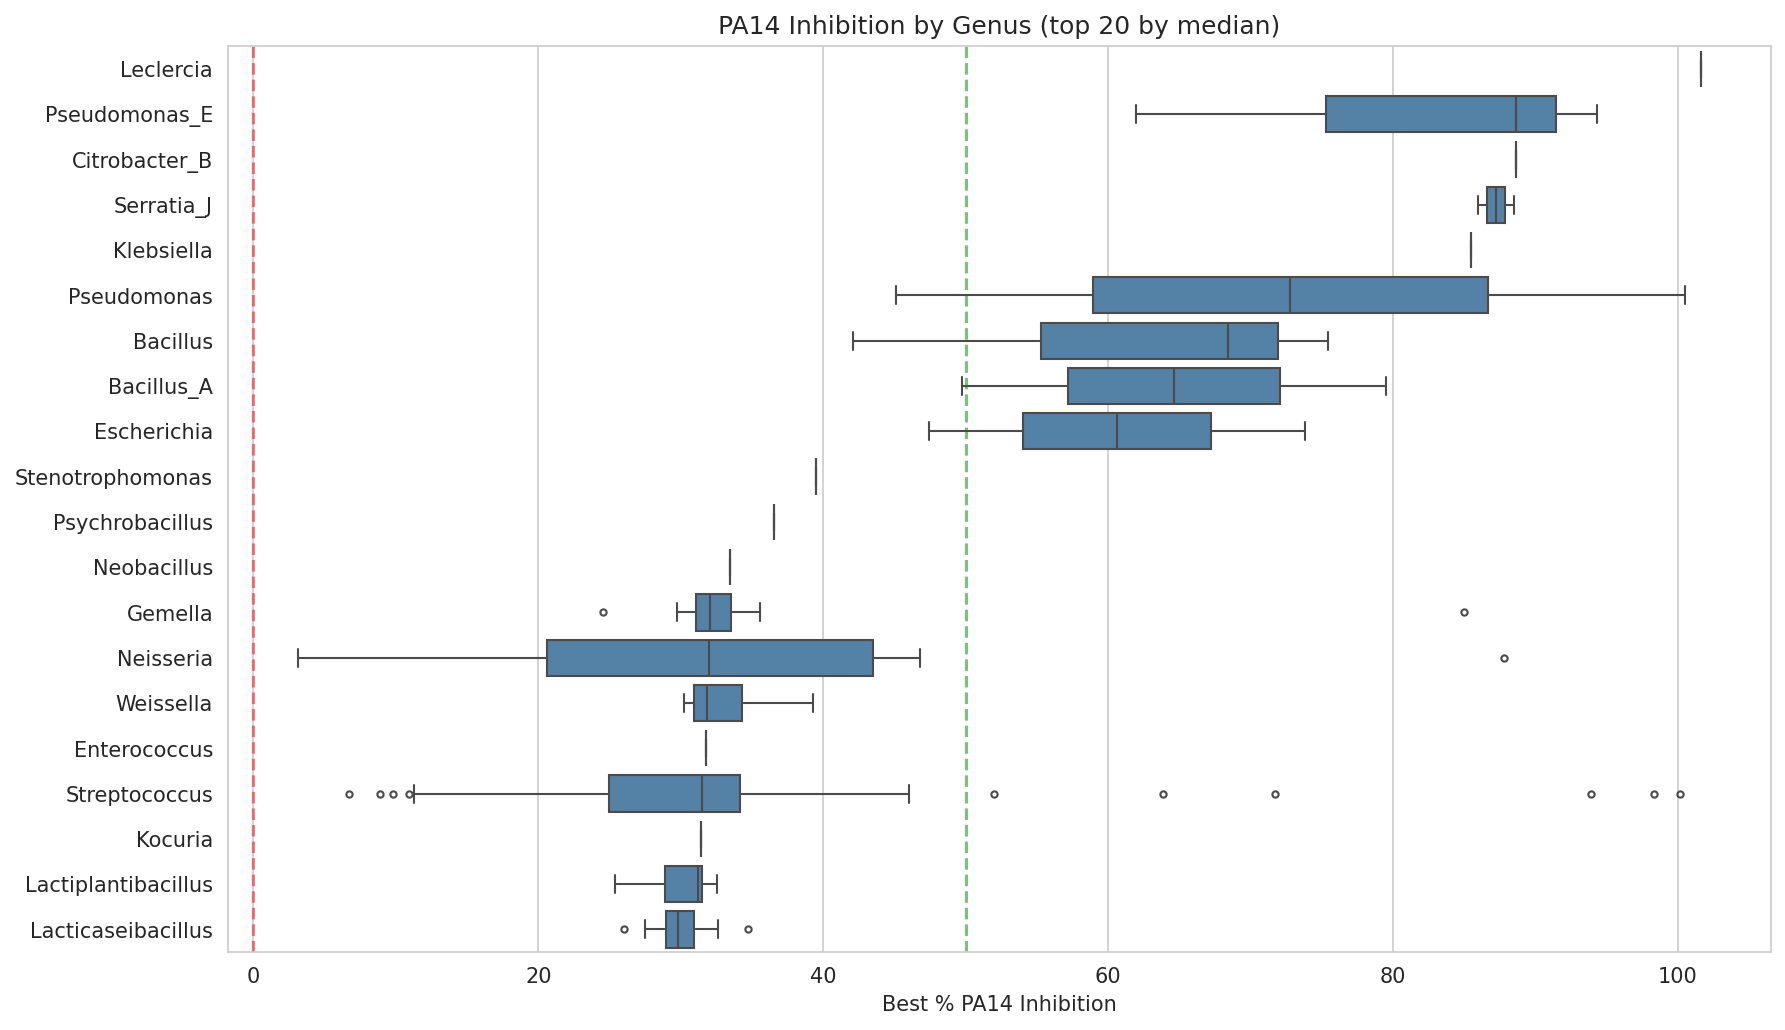
01 Inhibition By Genus
01 Inhibition Distribution
01 Isolate Genus Distribution
01 Isolate Species Distribution
01 Overlap Vs Inhibition Preview
01 Pa14 Carbon Profile
01 Reporter Carbon Heatmap
02 Growth Curve Gallery
02 Kinetics Vs Endpoint
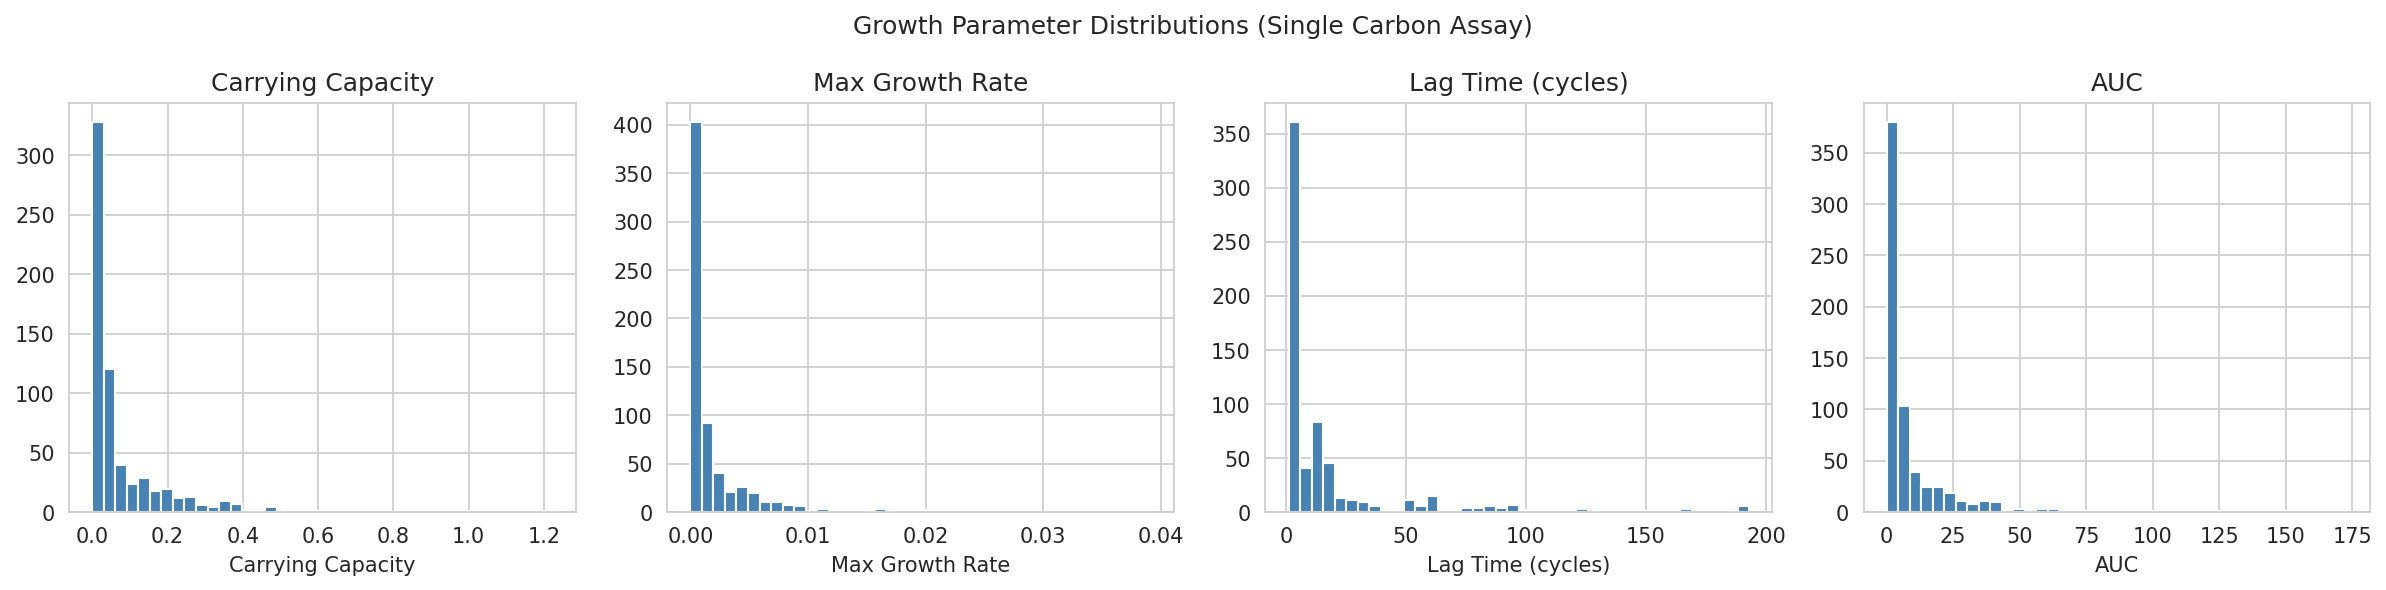
02 Parameter Distributions
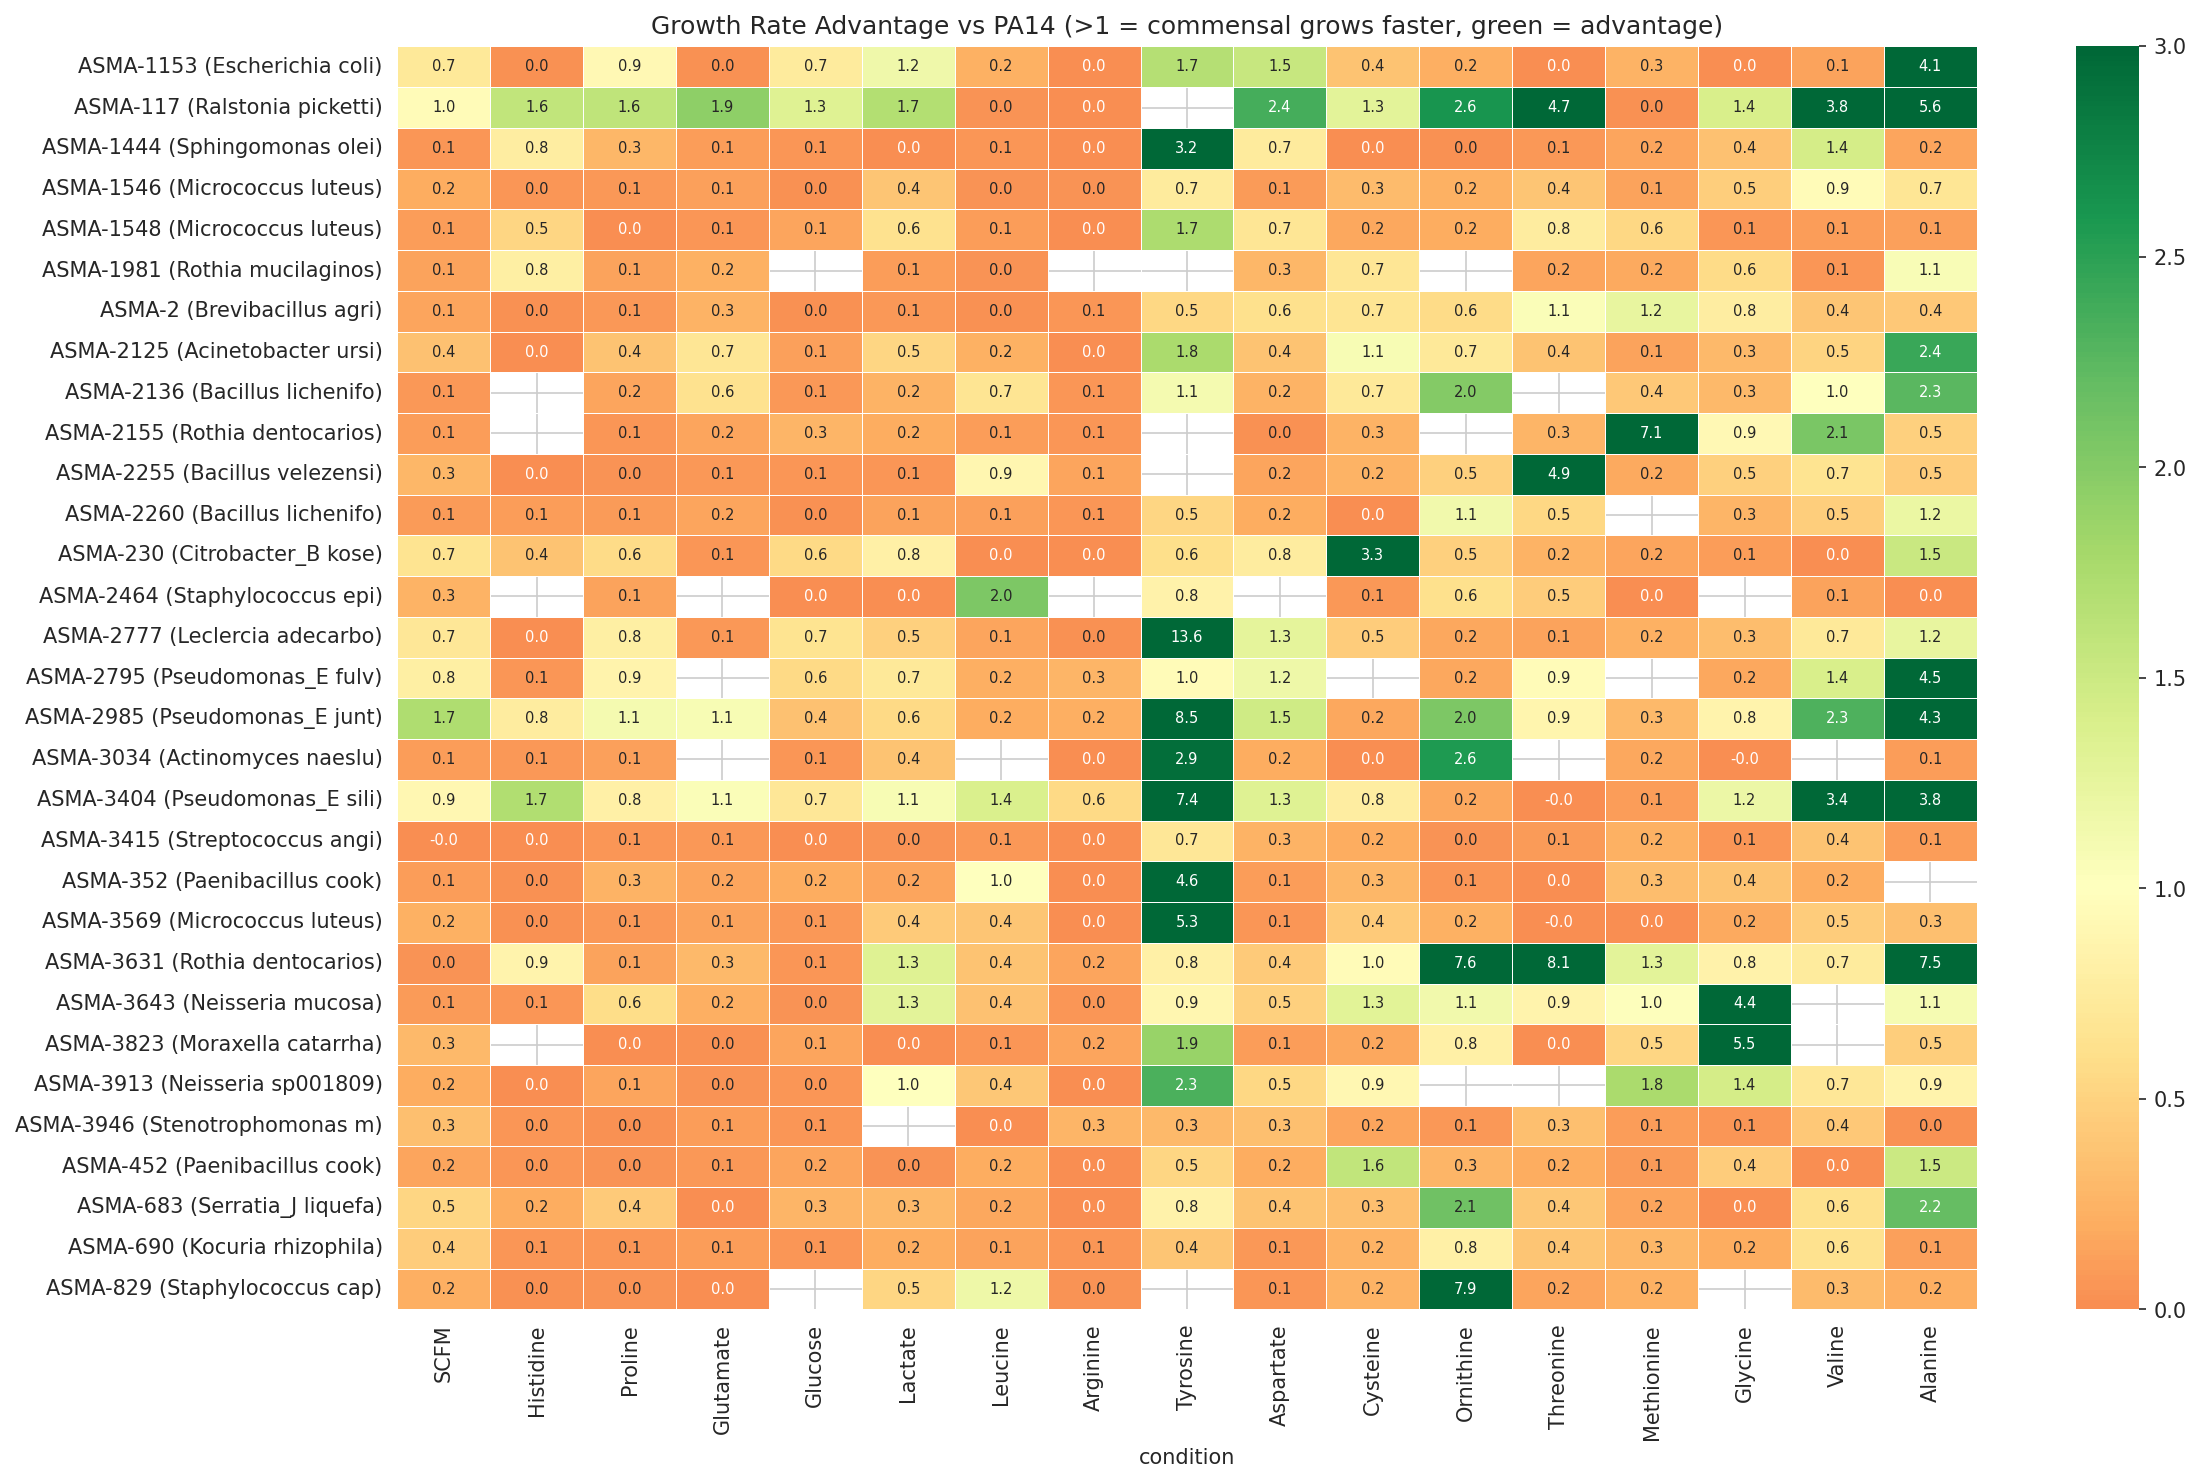
02 Rate Advantage Heatmap
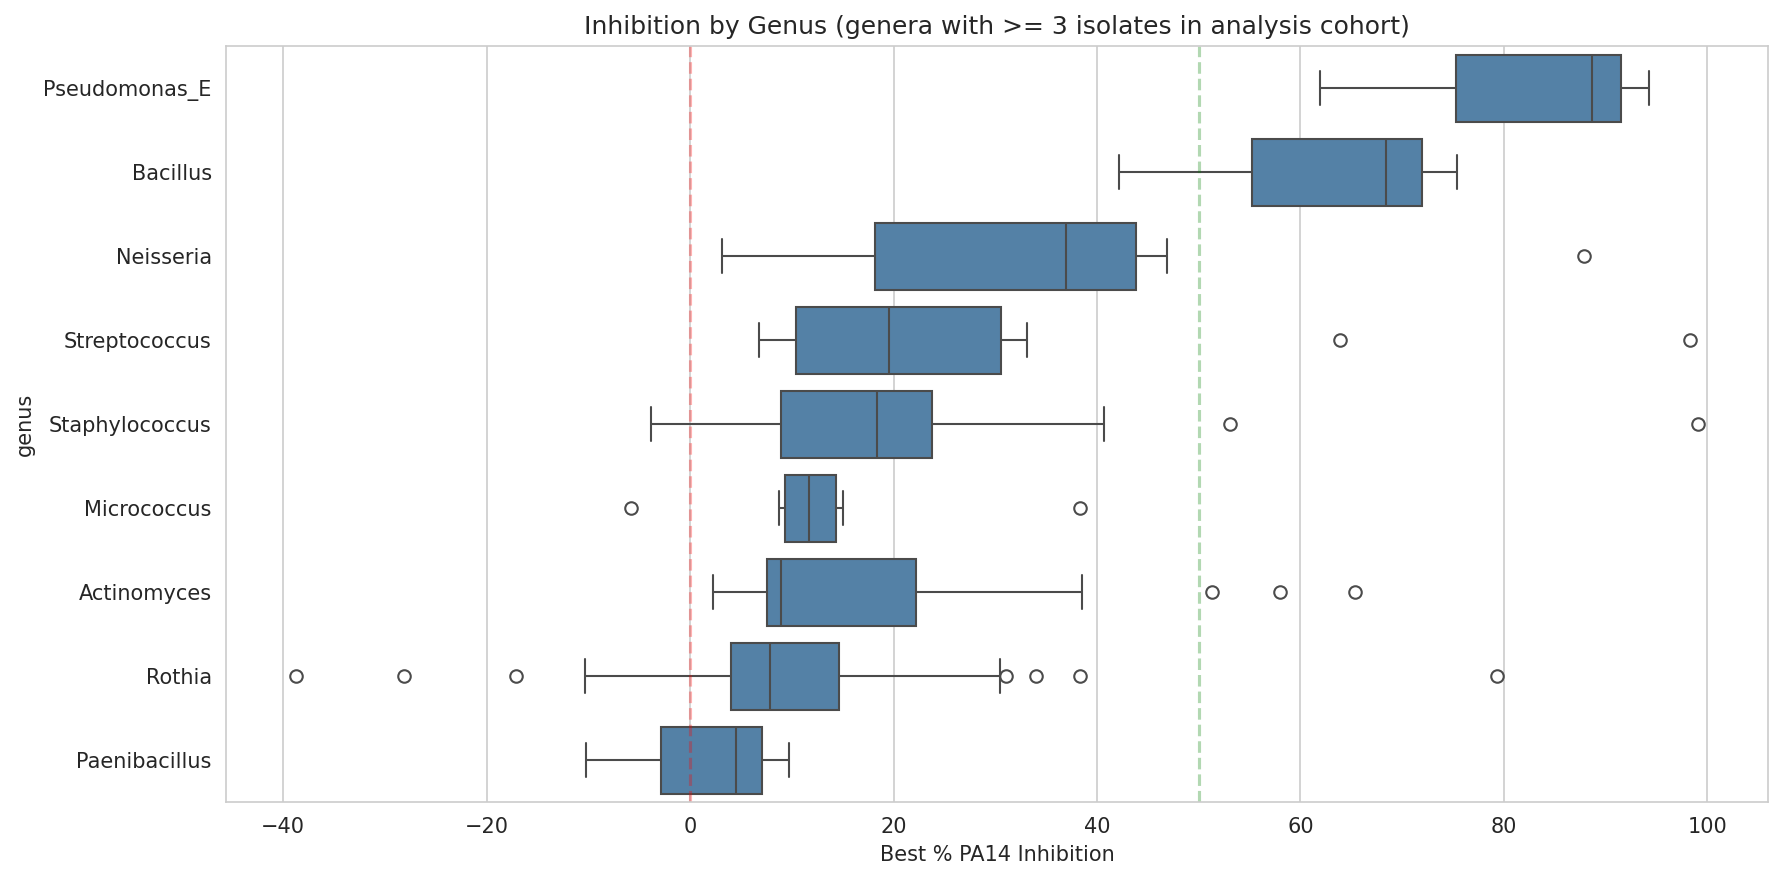
03 Inhibition By Genus Cohort
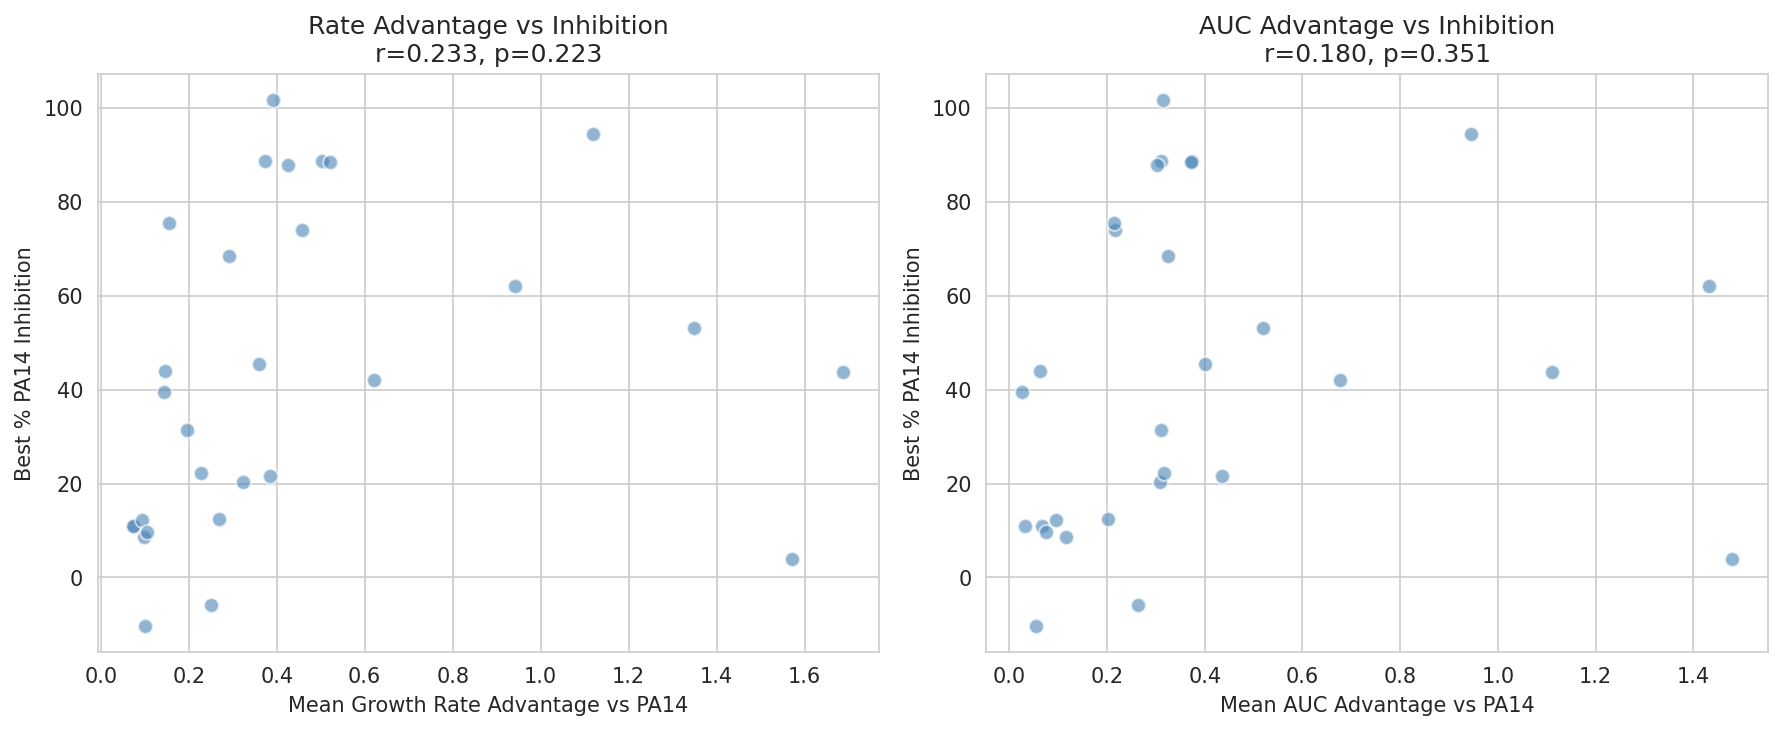
03 Kinetic Advantage Vs Inhibition
03 Metabolic Features Vs Inhibition
03 Predicted Vs Observed
04 Prevalence Vs Activity
05 Formulation Scores By Size
05B Bootstrap Ci
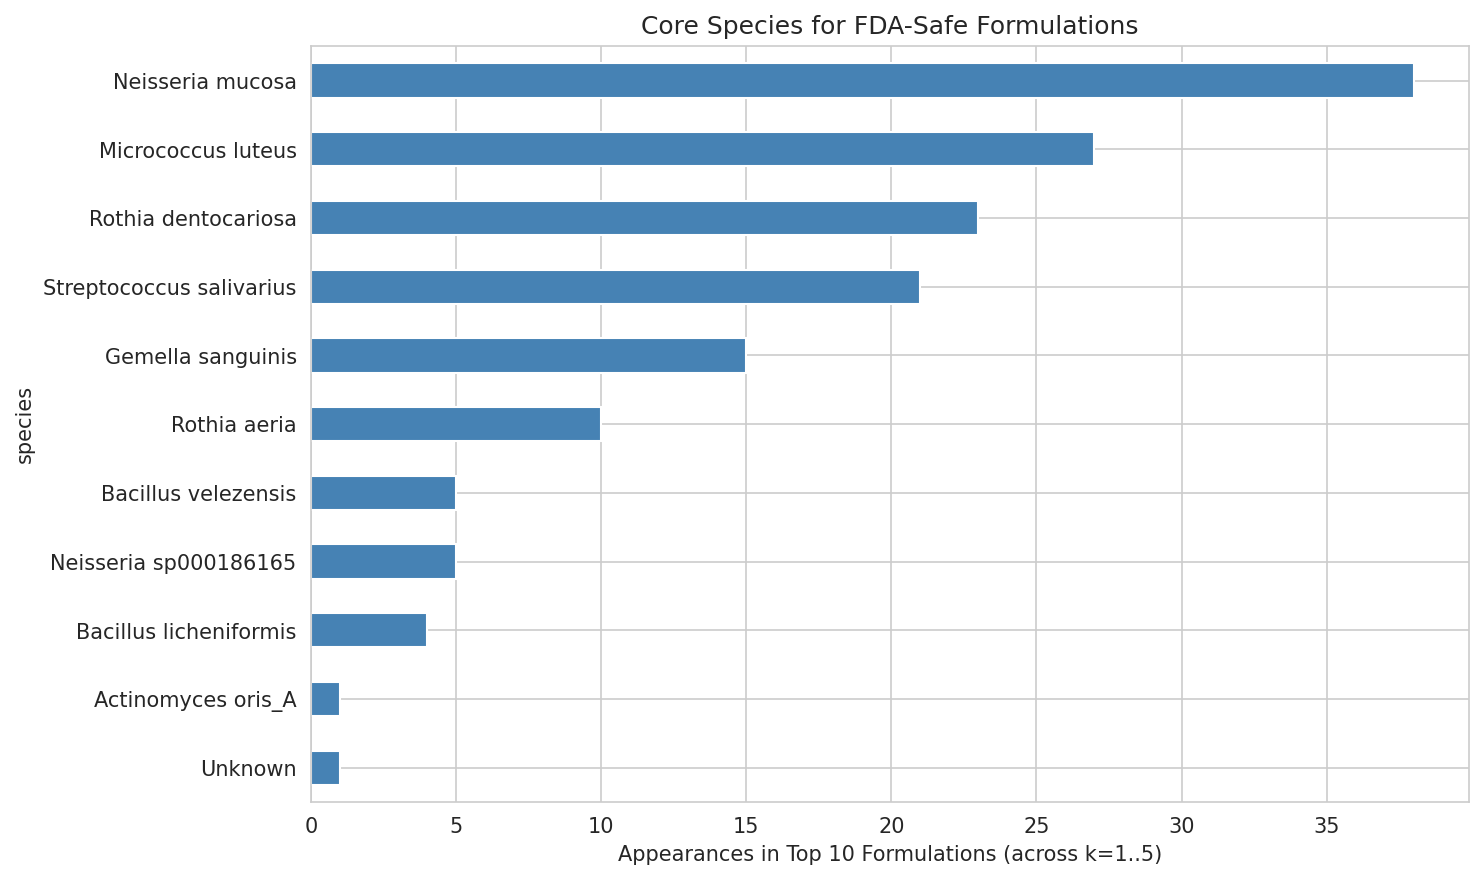
05B Strict Safe Species Frequency
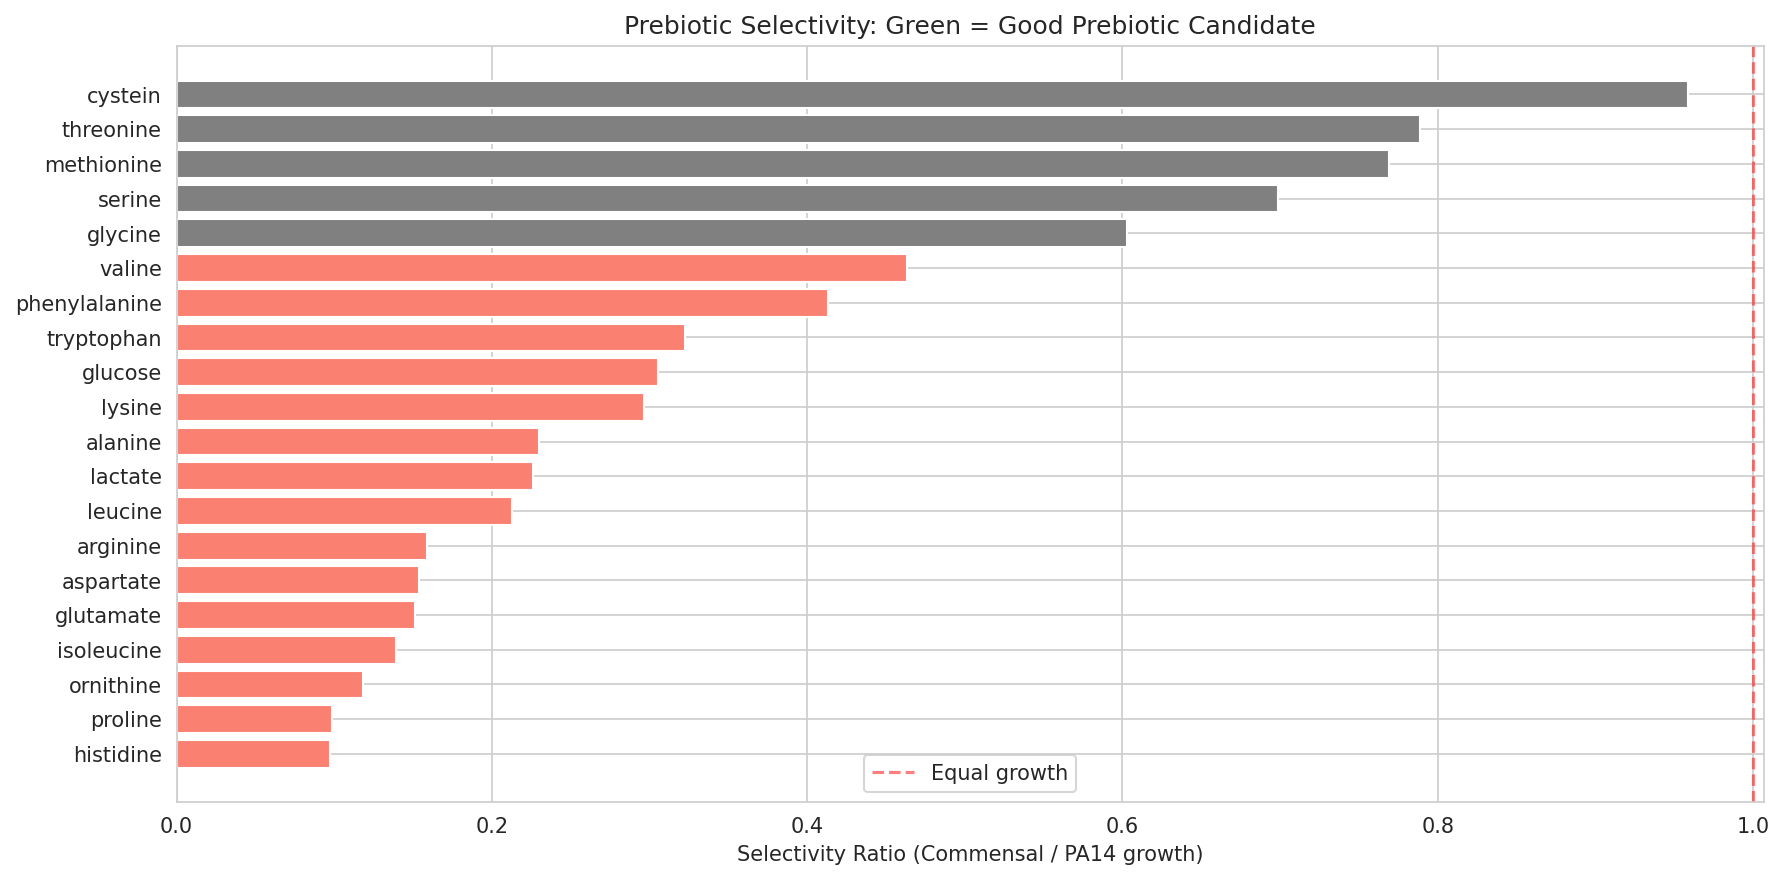
06 Prebiotic Selectivity
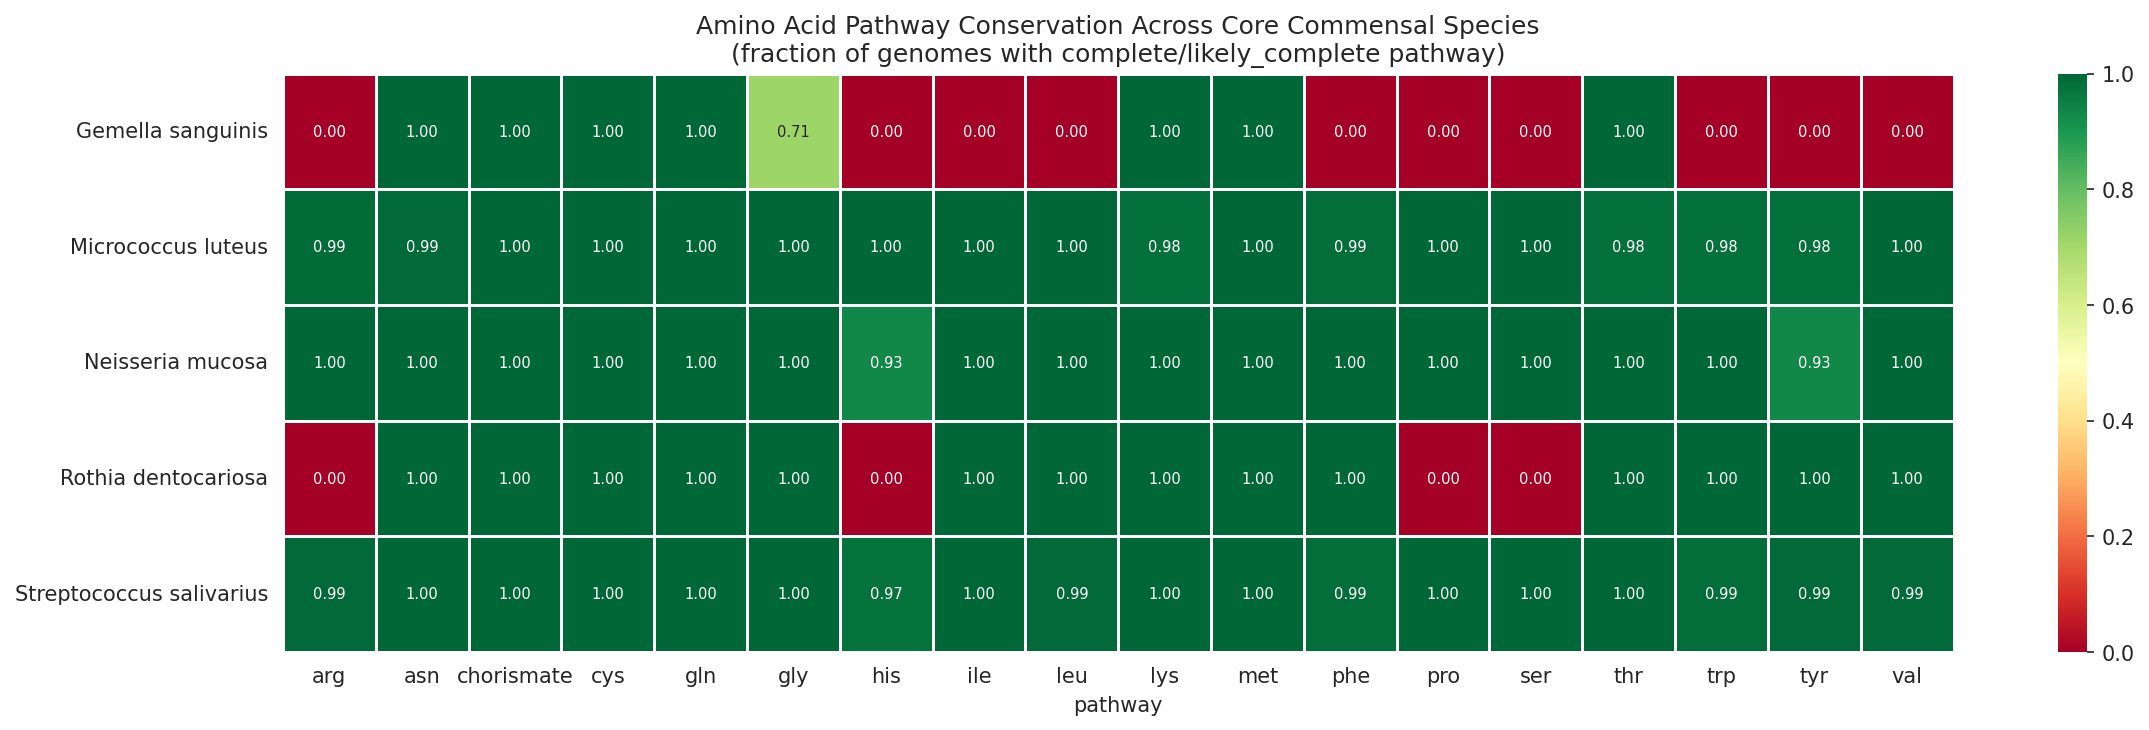
07 Aa Pathway Conservation
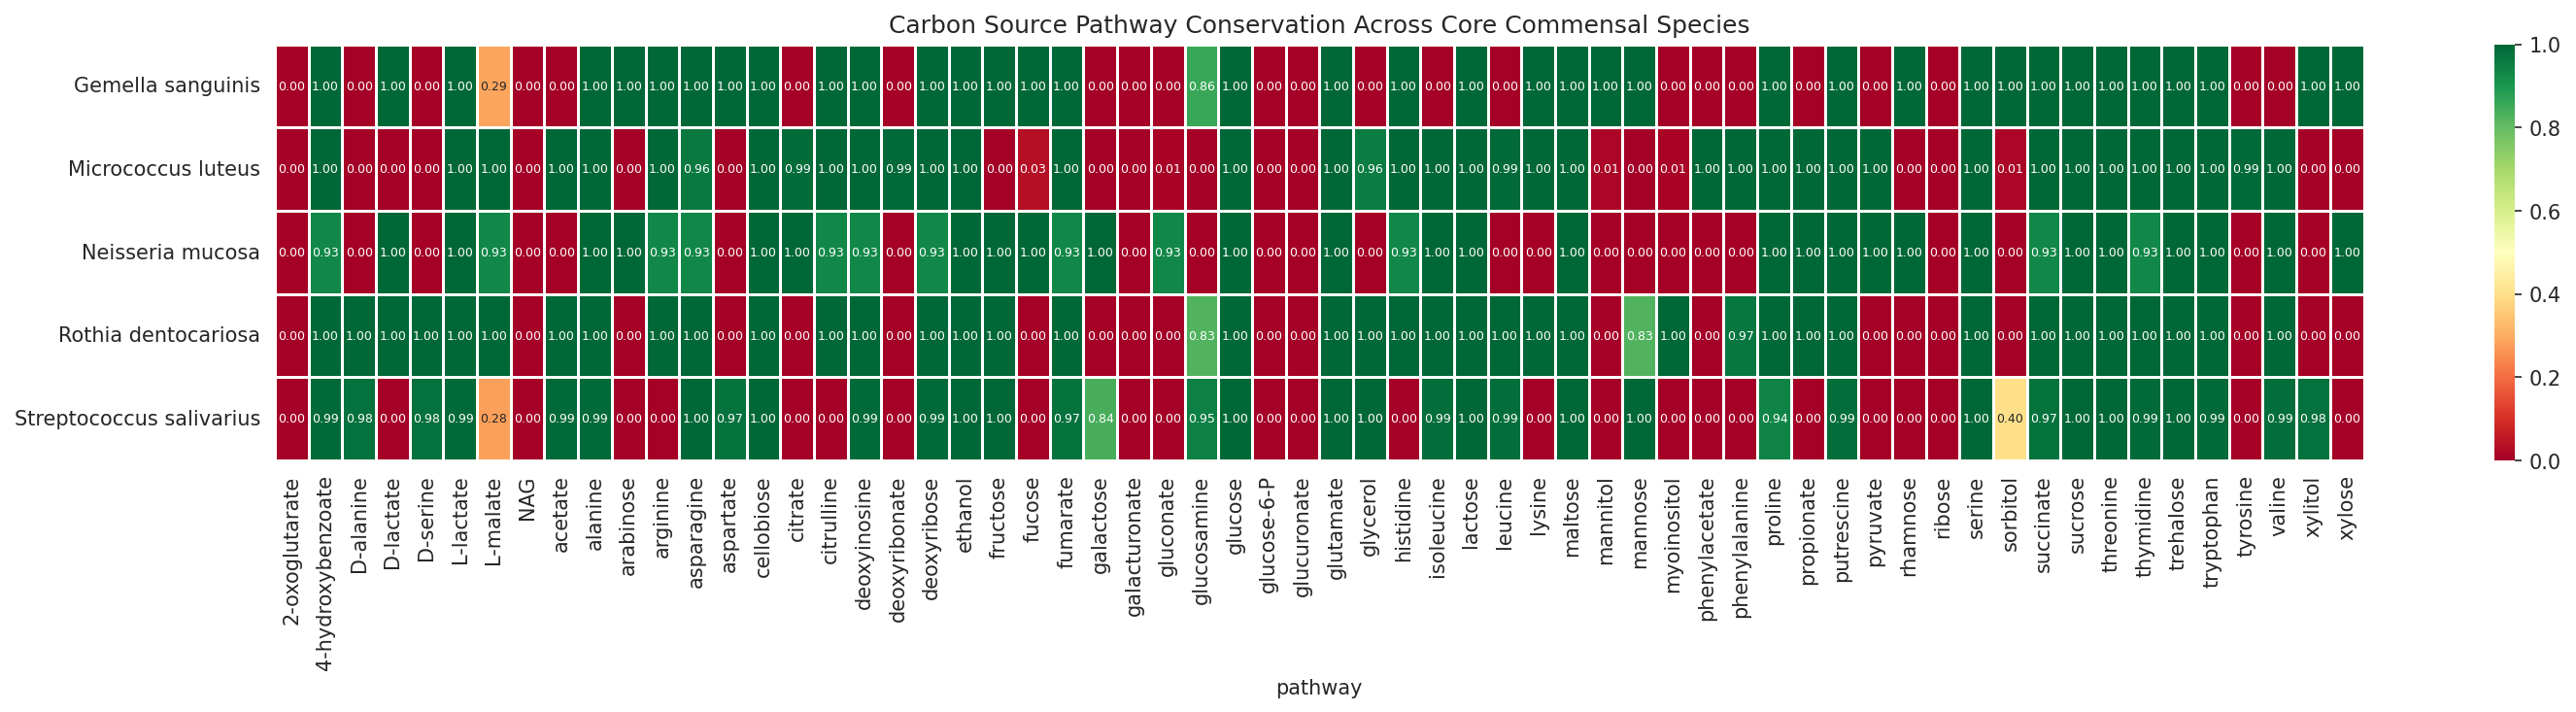
07 Carbon Pathway Conservation
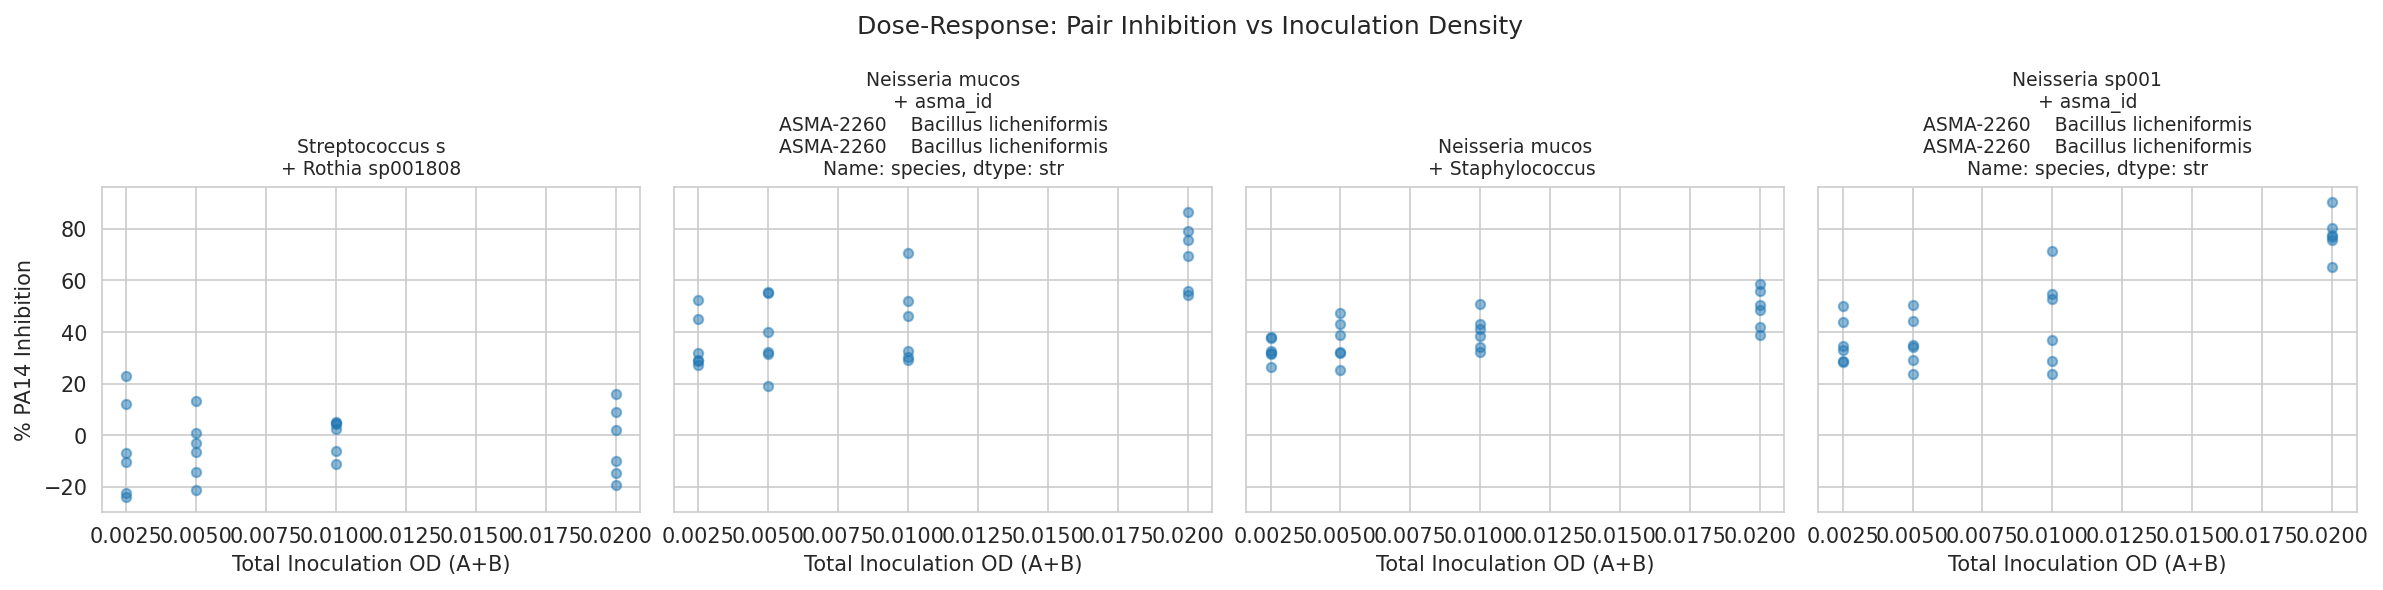
08 Dose Response Pairs
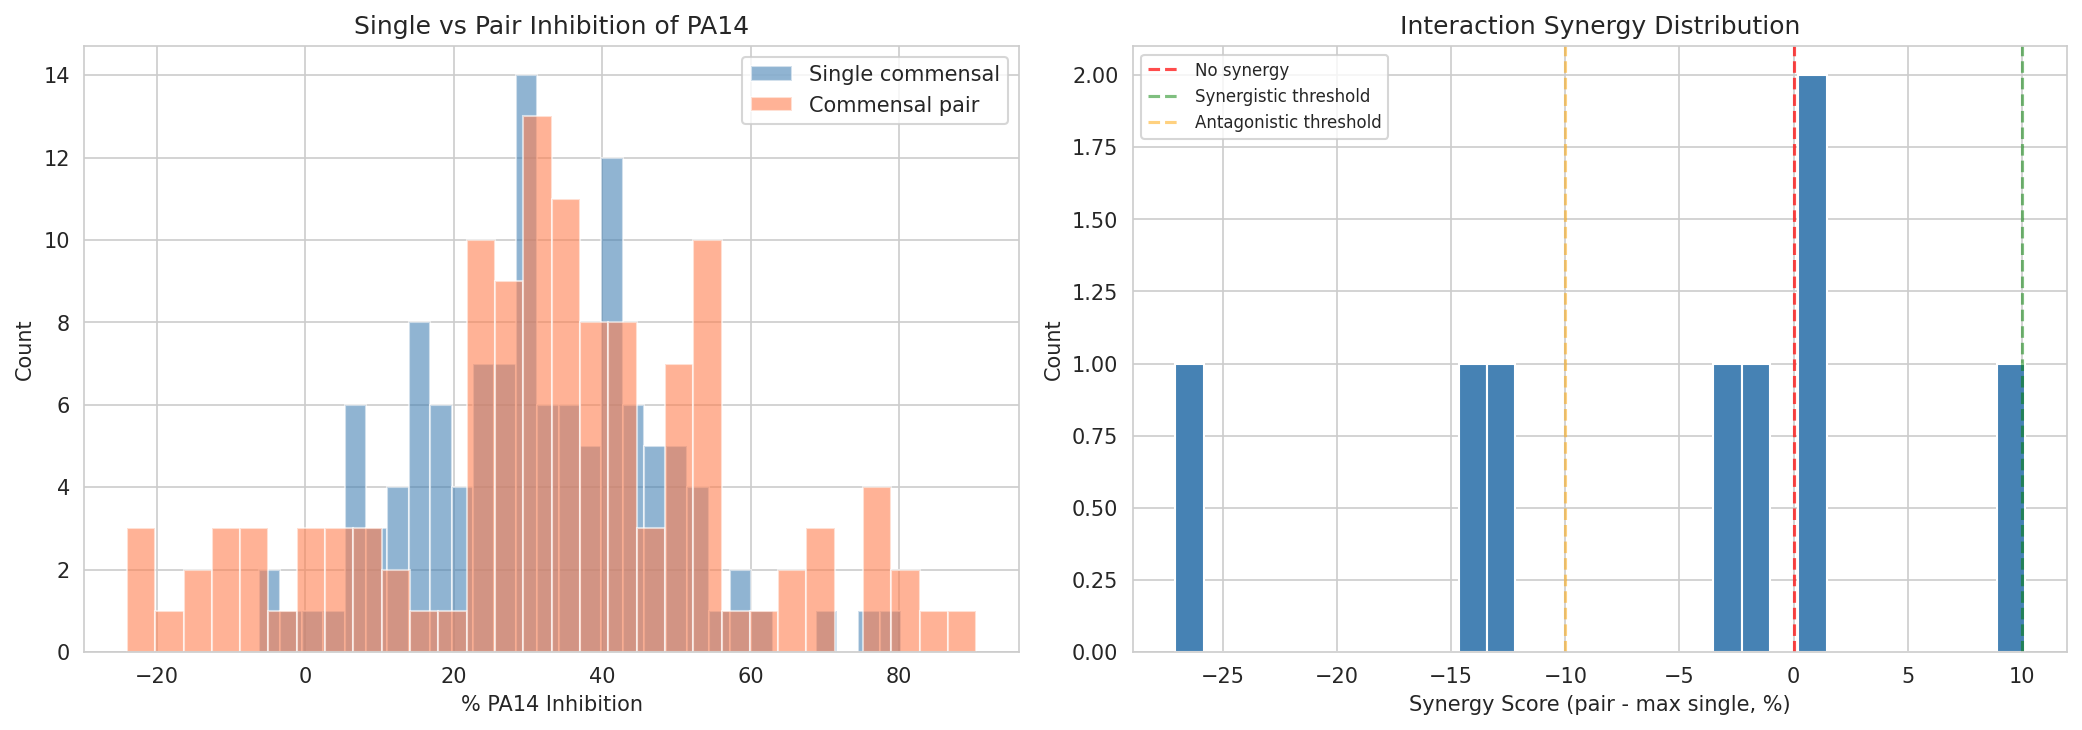
08 Pair Vs Single Inhibition
09 Pathway Selectivity Heatmap
10 Pa Genome Sources
10 Pa Lung Clusters
10 Pa Lung Vs Nonlung Pathways
10 Pa Sick Vs Stable Pathways
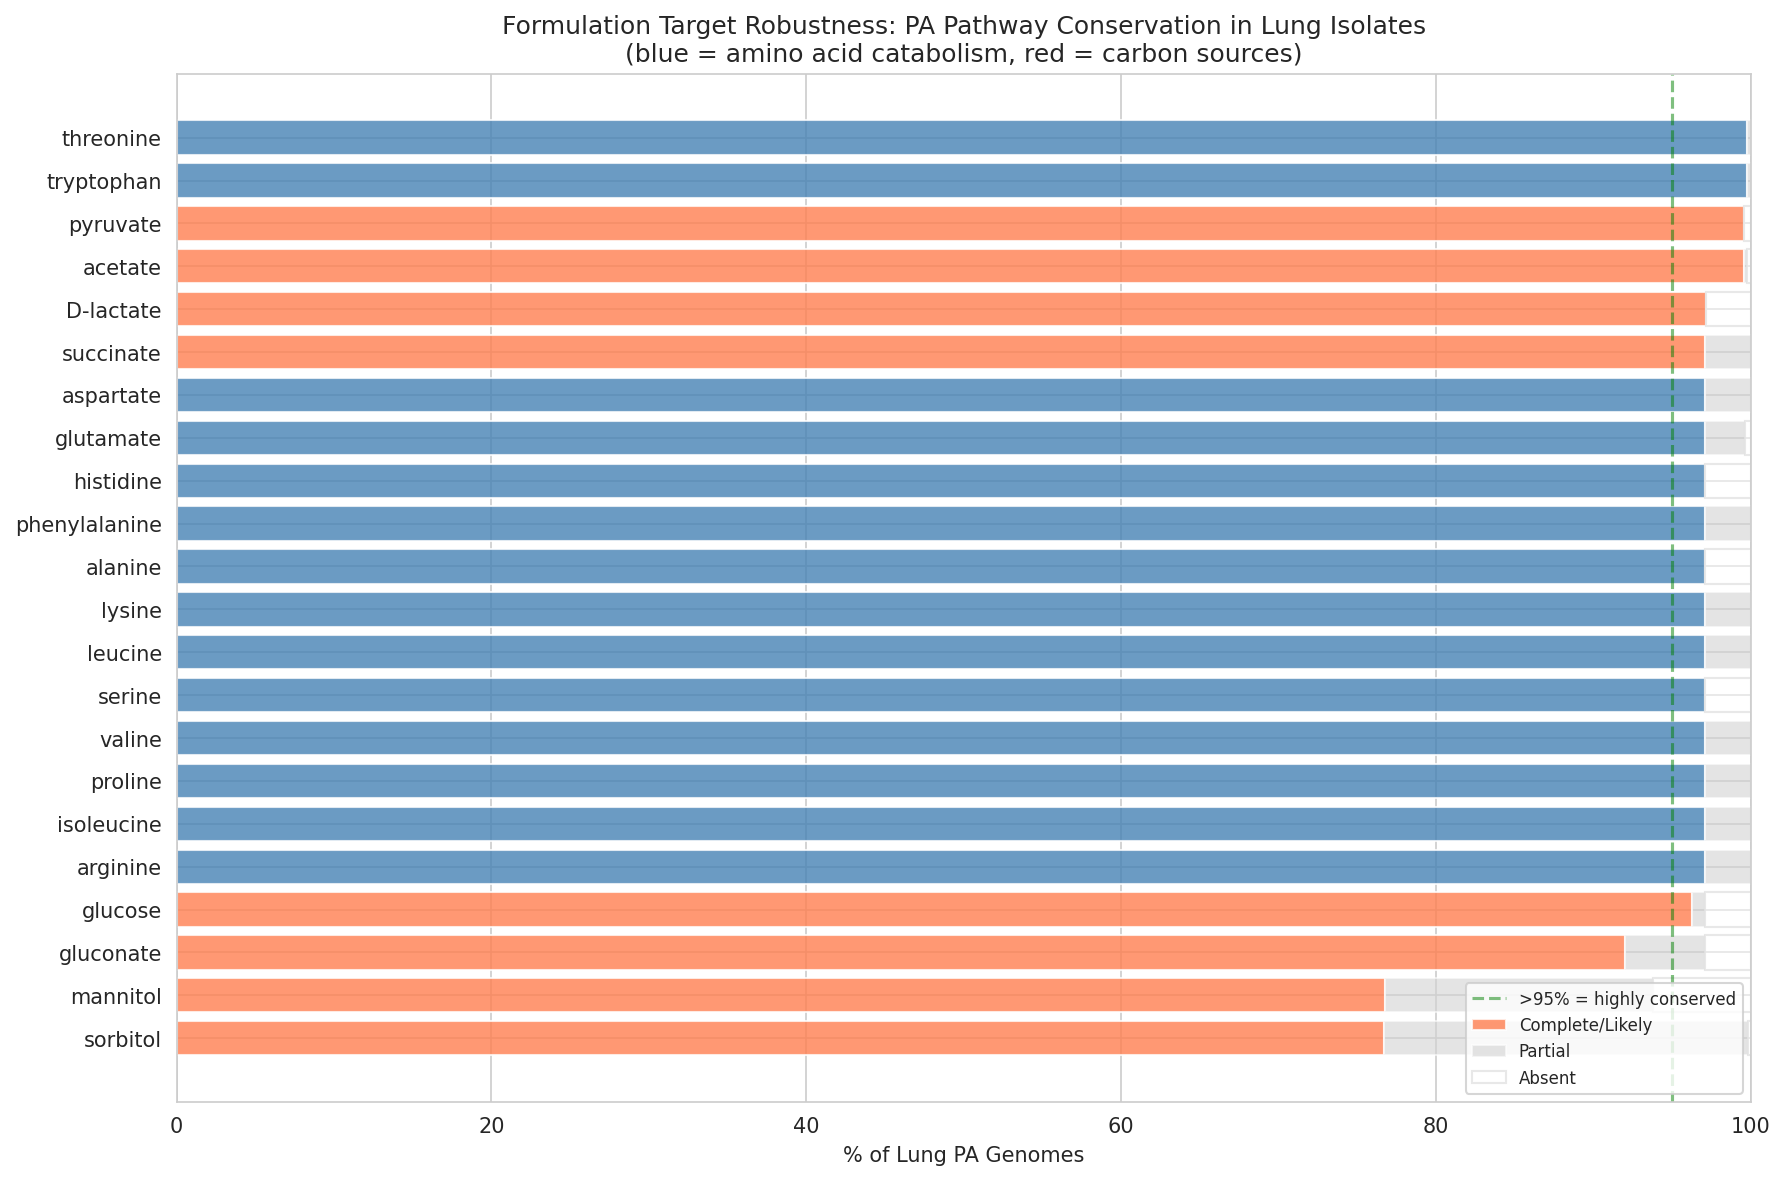
10 Pa Target Robustness
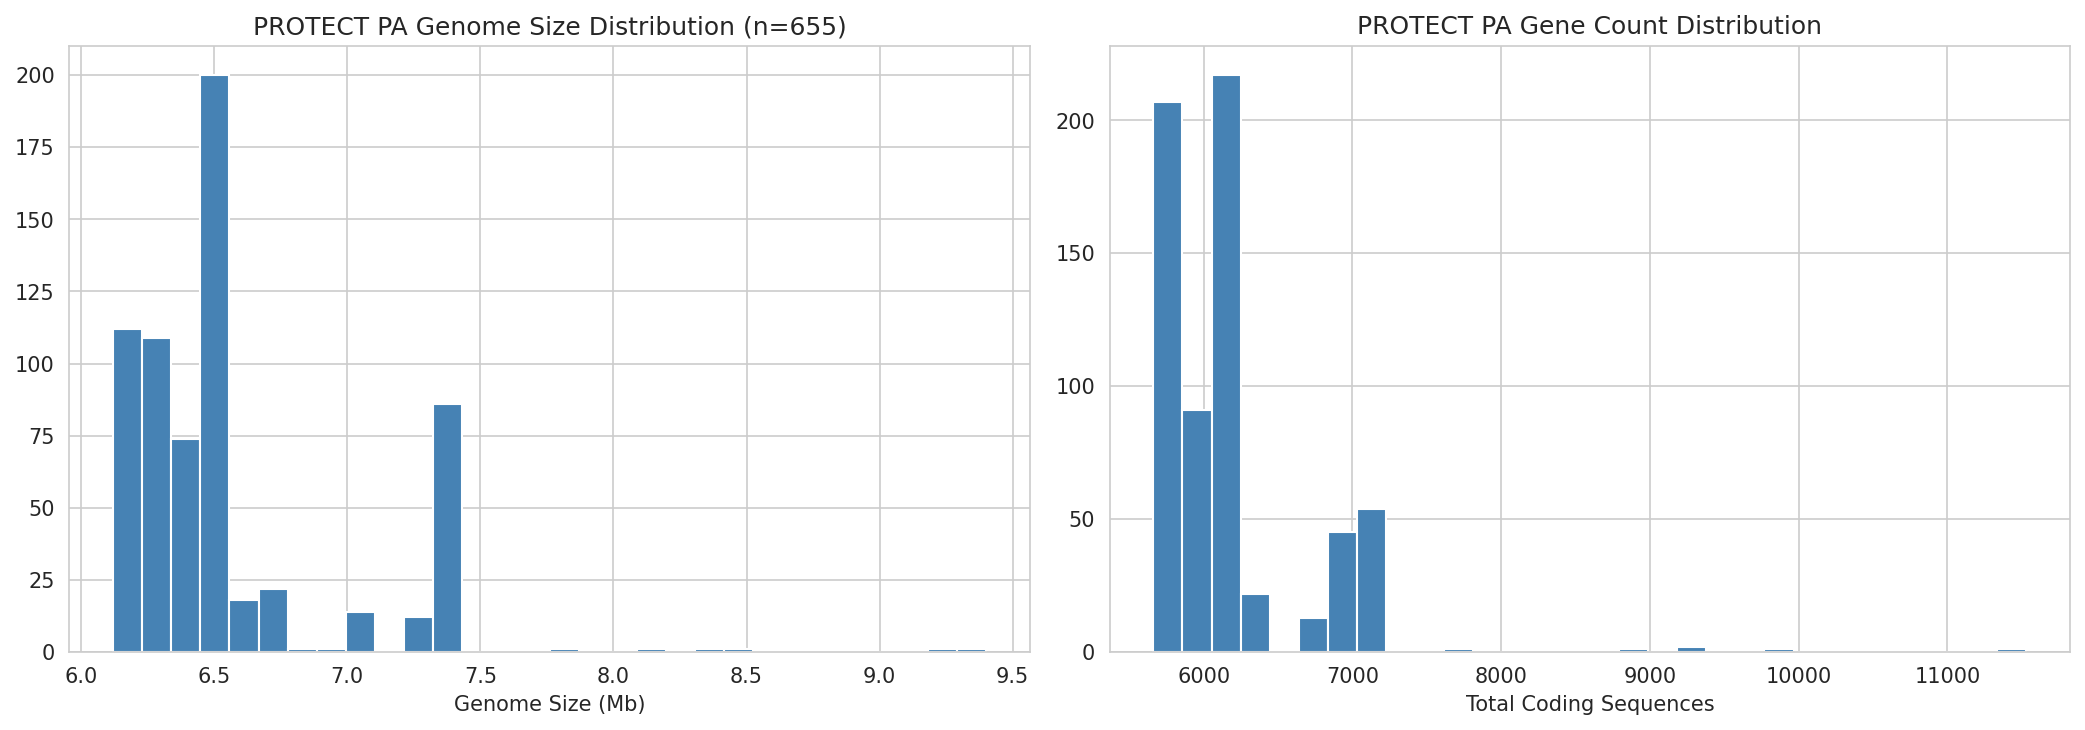
10 Protect Pa Genome Variation
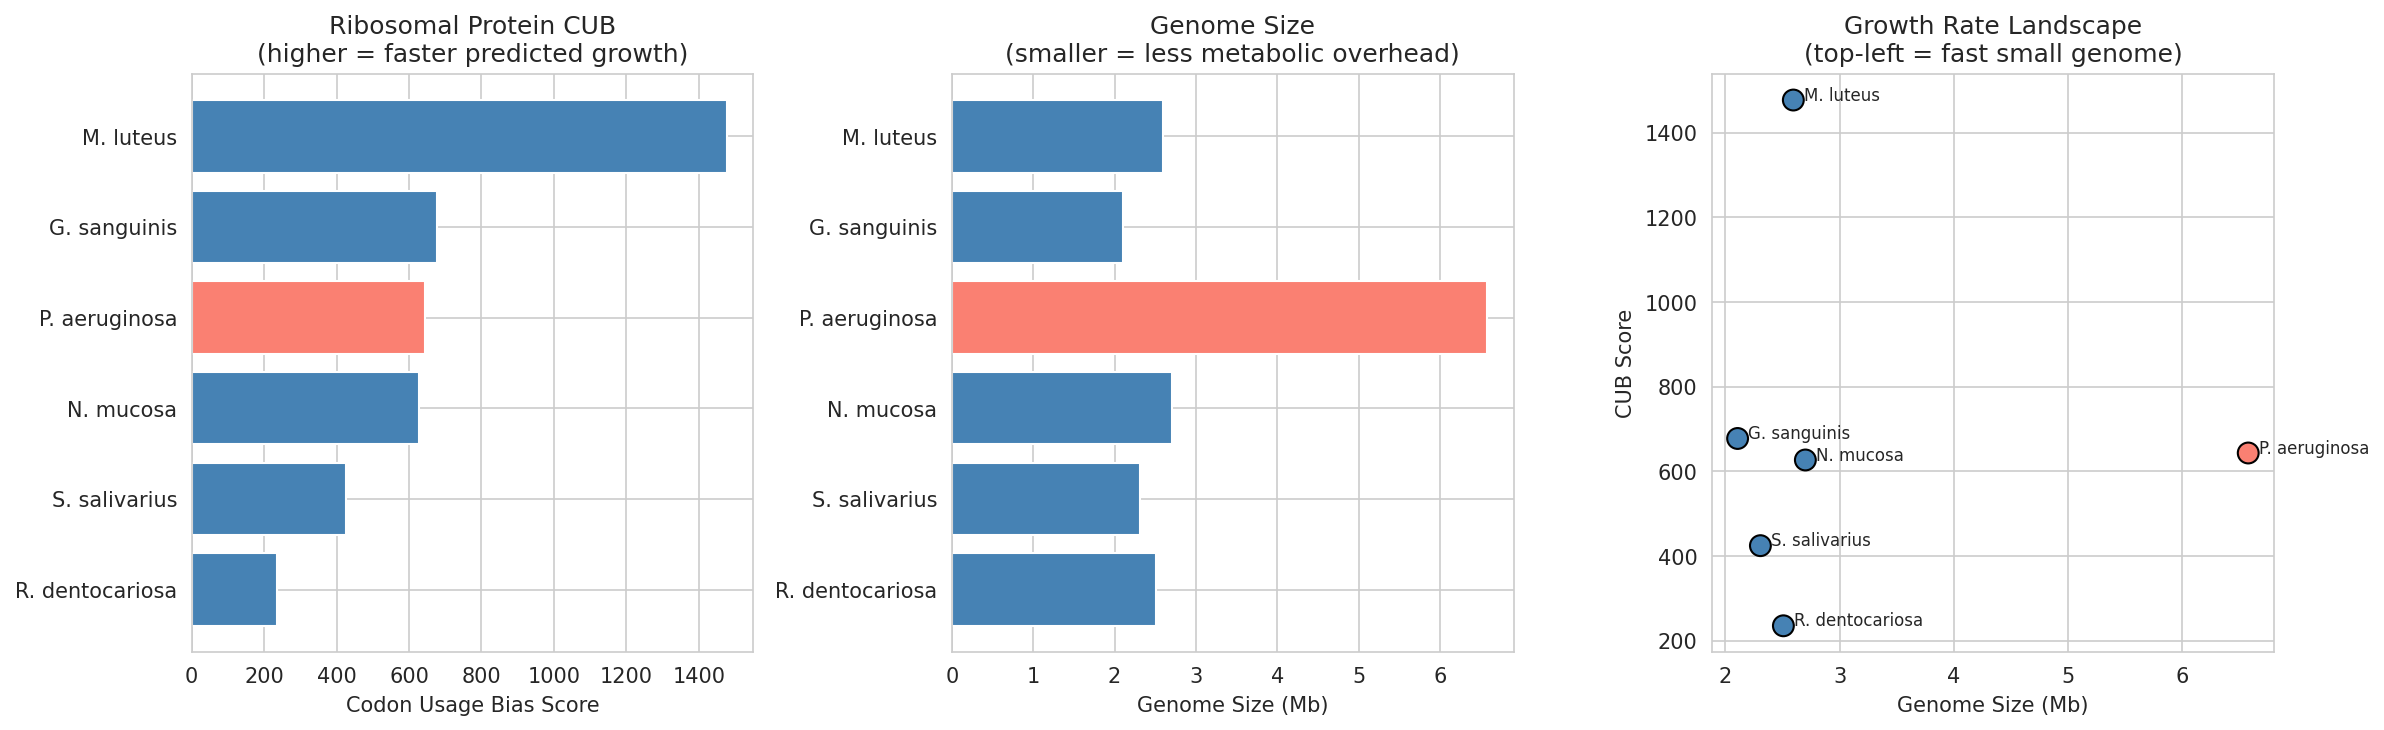
12 Growth Rate Prediction
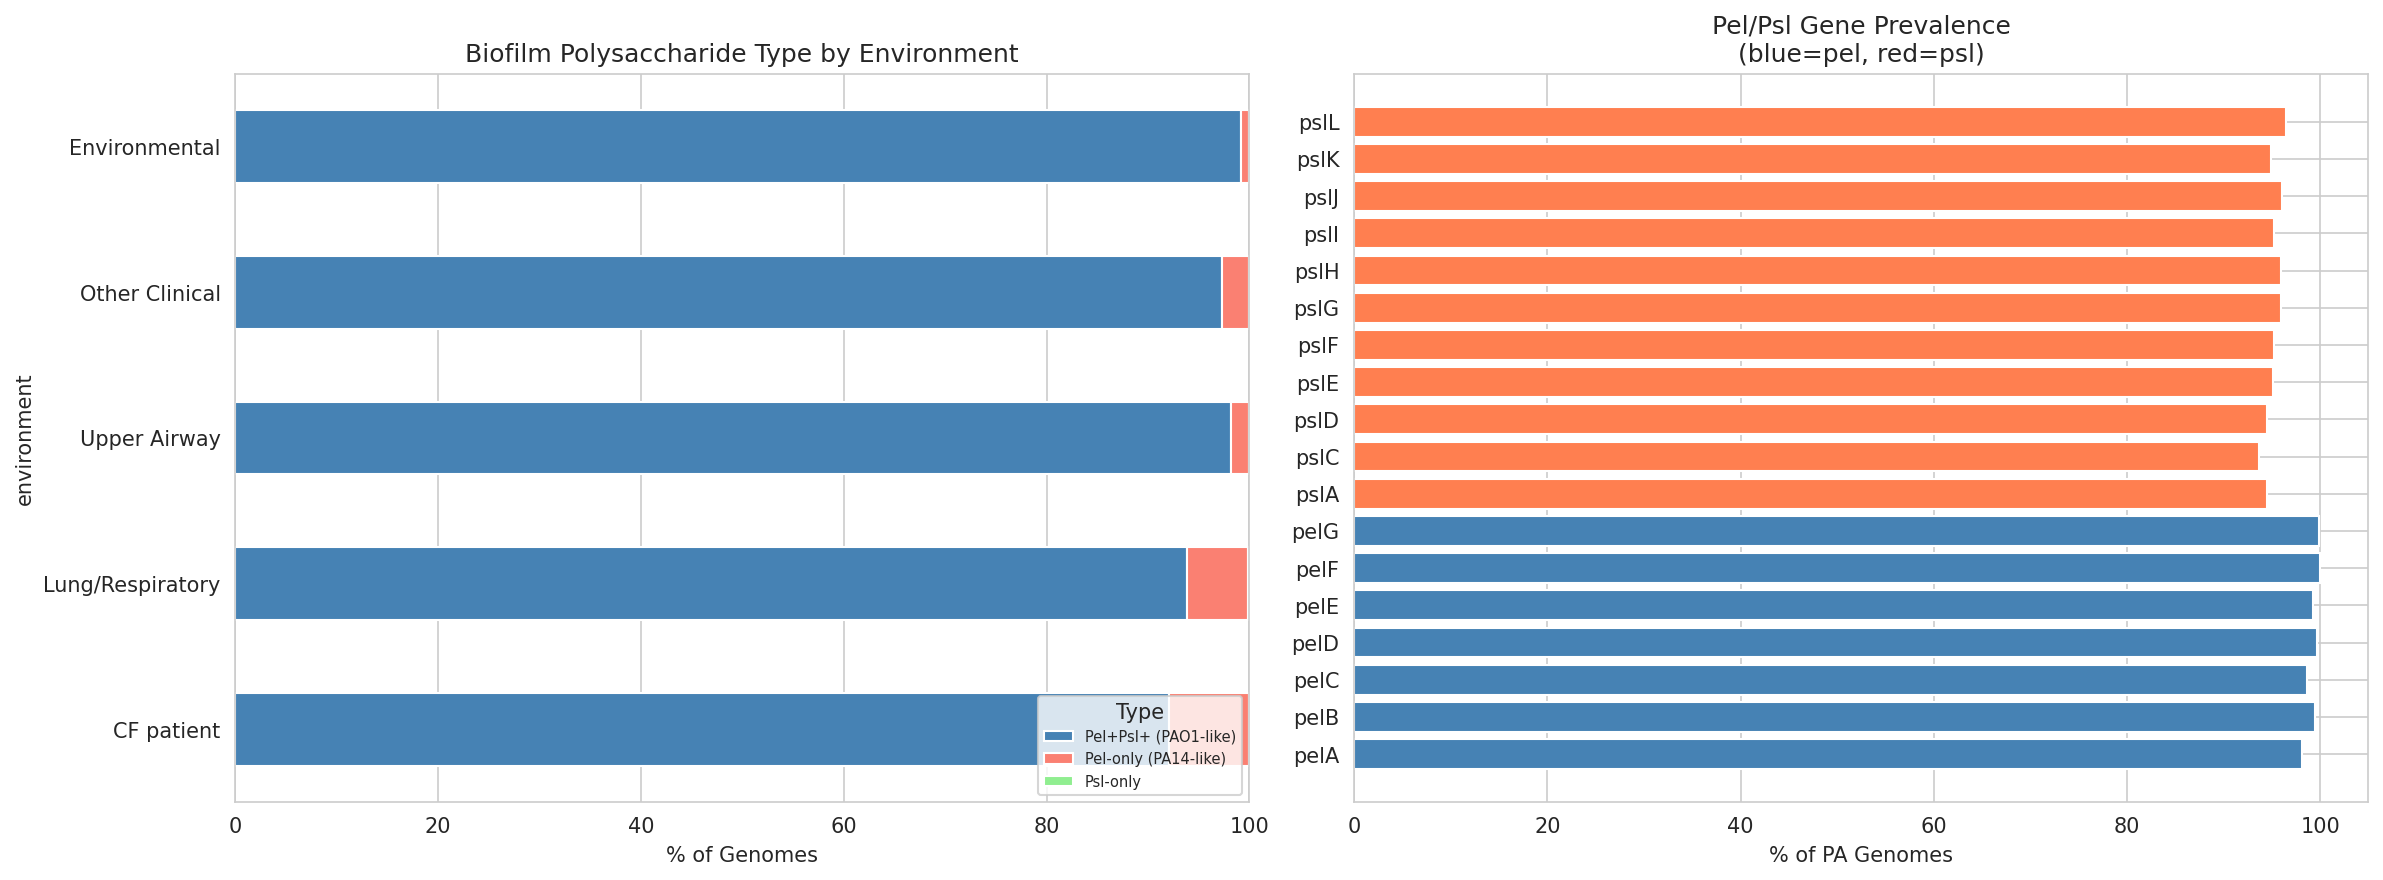
13 Biofilm By Environment
13 Pa Virulence Summary
13 Protect Pa Virulence
13 T3Ss By Environment
14 Asma Virulence Profiles
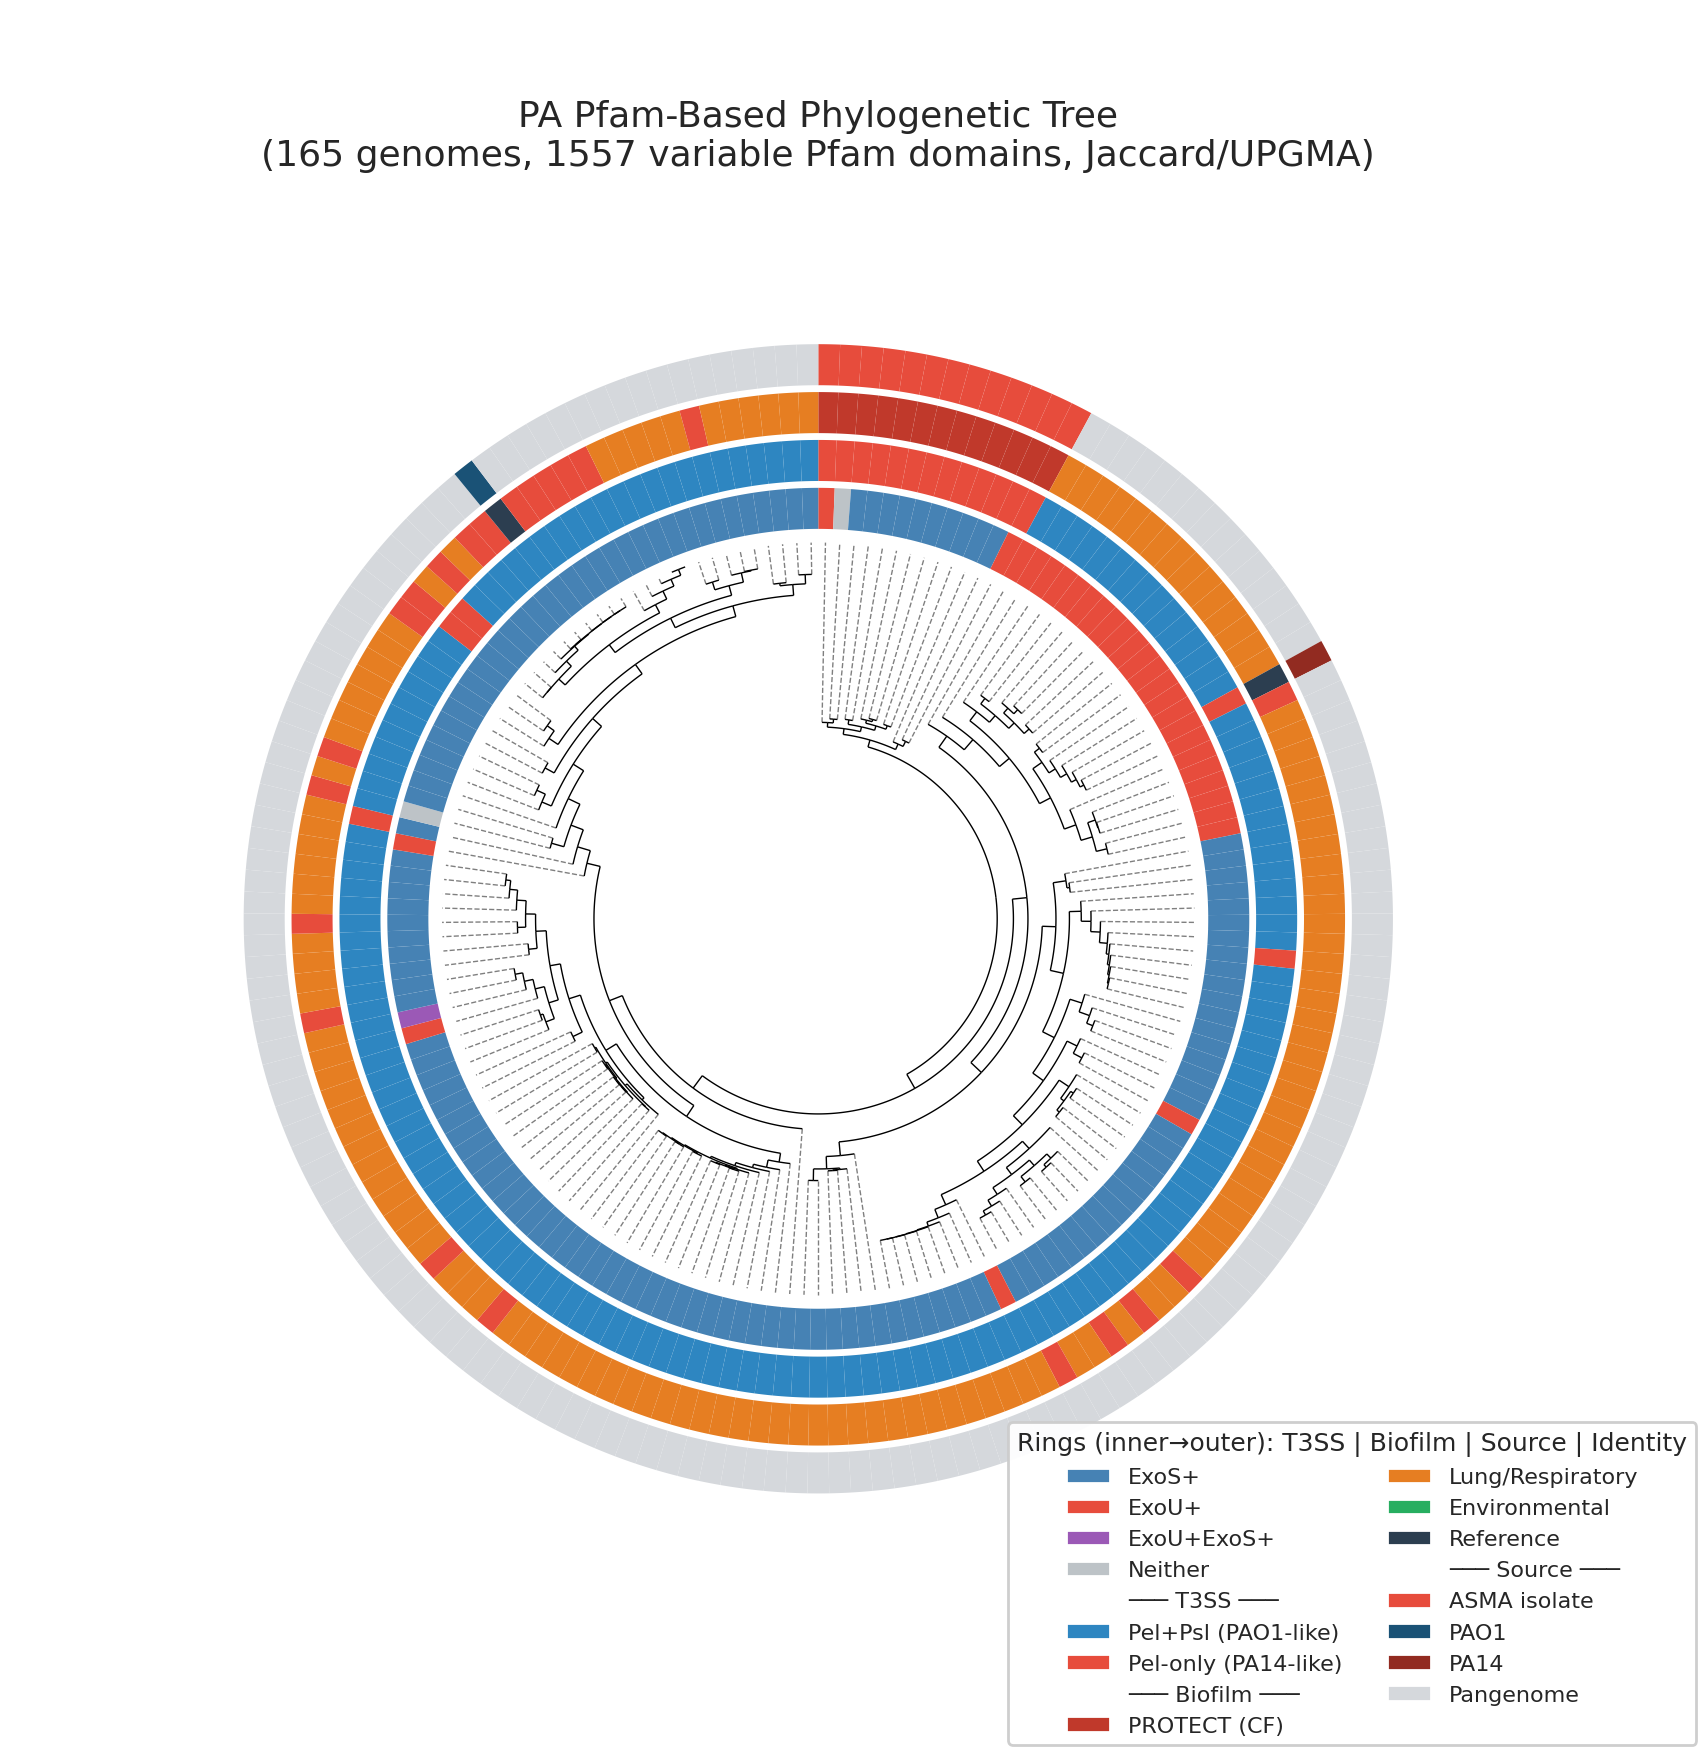
14 Pa Phylogenetic Tree
Notebooks
01_data_integration_eda.ipynb
01 Data Integration Eda
View notebook →
02_growth_kinetics.ipynb
02 Growth Kinetics
View notebook →
03_explaining_inhibition.ipynb
03 Explaining Inhibition
View notebook →
04_patient_ecology.ipynb
04 Patient Ecology
View notebook →
05_formulation_optimization.ipynb
05 Formulation Optimization
View notebook →
05b_formulation_strict_safety.ipynb
05B Formulation Strict Safety
View notebook →
06_prebiotic_pairing.ipynb
06 Prebiotic Pairing
View notebook →
07_pangenome_conservation.ipynb
07 Pangenome Conservation
View notebook →
08_interaction_modeling.ipynb
08 Interaction Modeling
View notebook →
09_genomic_carbon_extension.ipynb
09 Genomic Carbon Extension
View notebook →
10_pa_lung_adaptation.ipynb
10 Pa Lung Adaptation
View notebook →
12_growth_rate_prediction.ipynb
12 Growth Rate Prediction
View notebook →
13_pa_virulence_systems.ipynb
13 Pa Virulence Systems
View notebook →
14_pa_isolate_profiling_tree.ipynb
14 Pa Isolate Profiling Tree
View notebook →
Data Files
| Filename | Size |
|---|---|
asma_pa_virulence_profiles.tsv |
45.3 KB |
pa_tree_annotations.tsv |
12.6 KB |
pa_virulence_systems.tsv |
747.5 KB |