Within-Species AMR Strain Variation
CompletedResearch Question
Within a species, how does the AMR repertoire vary between strains, and what drives that variation?
Key Findings
Finding 1: The majority of AMR genes are variable or rare within species
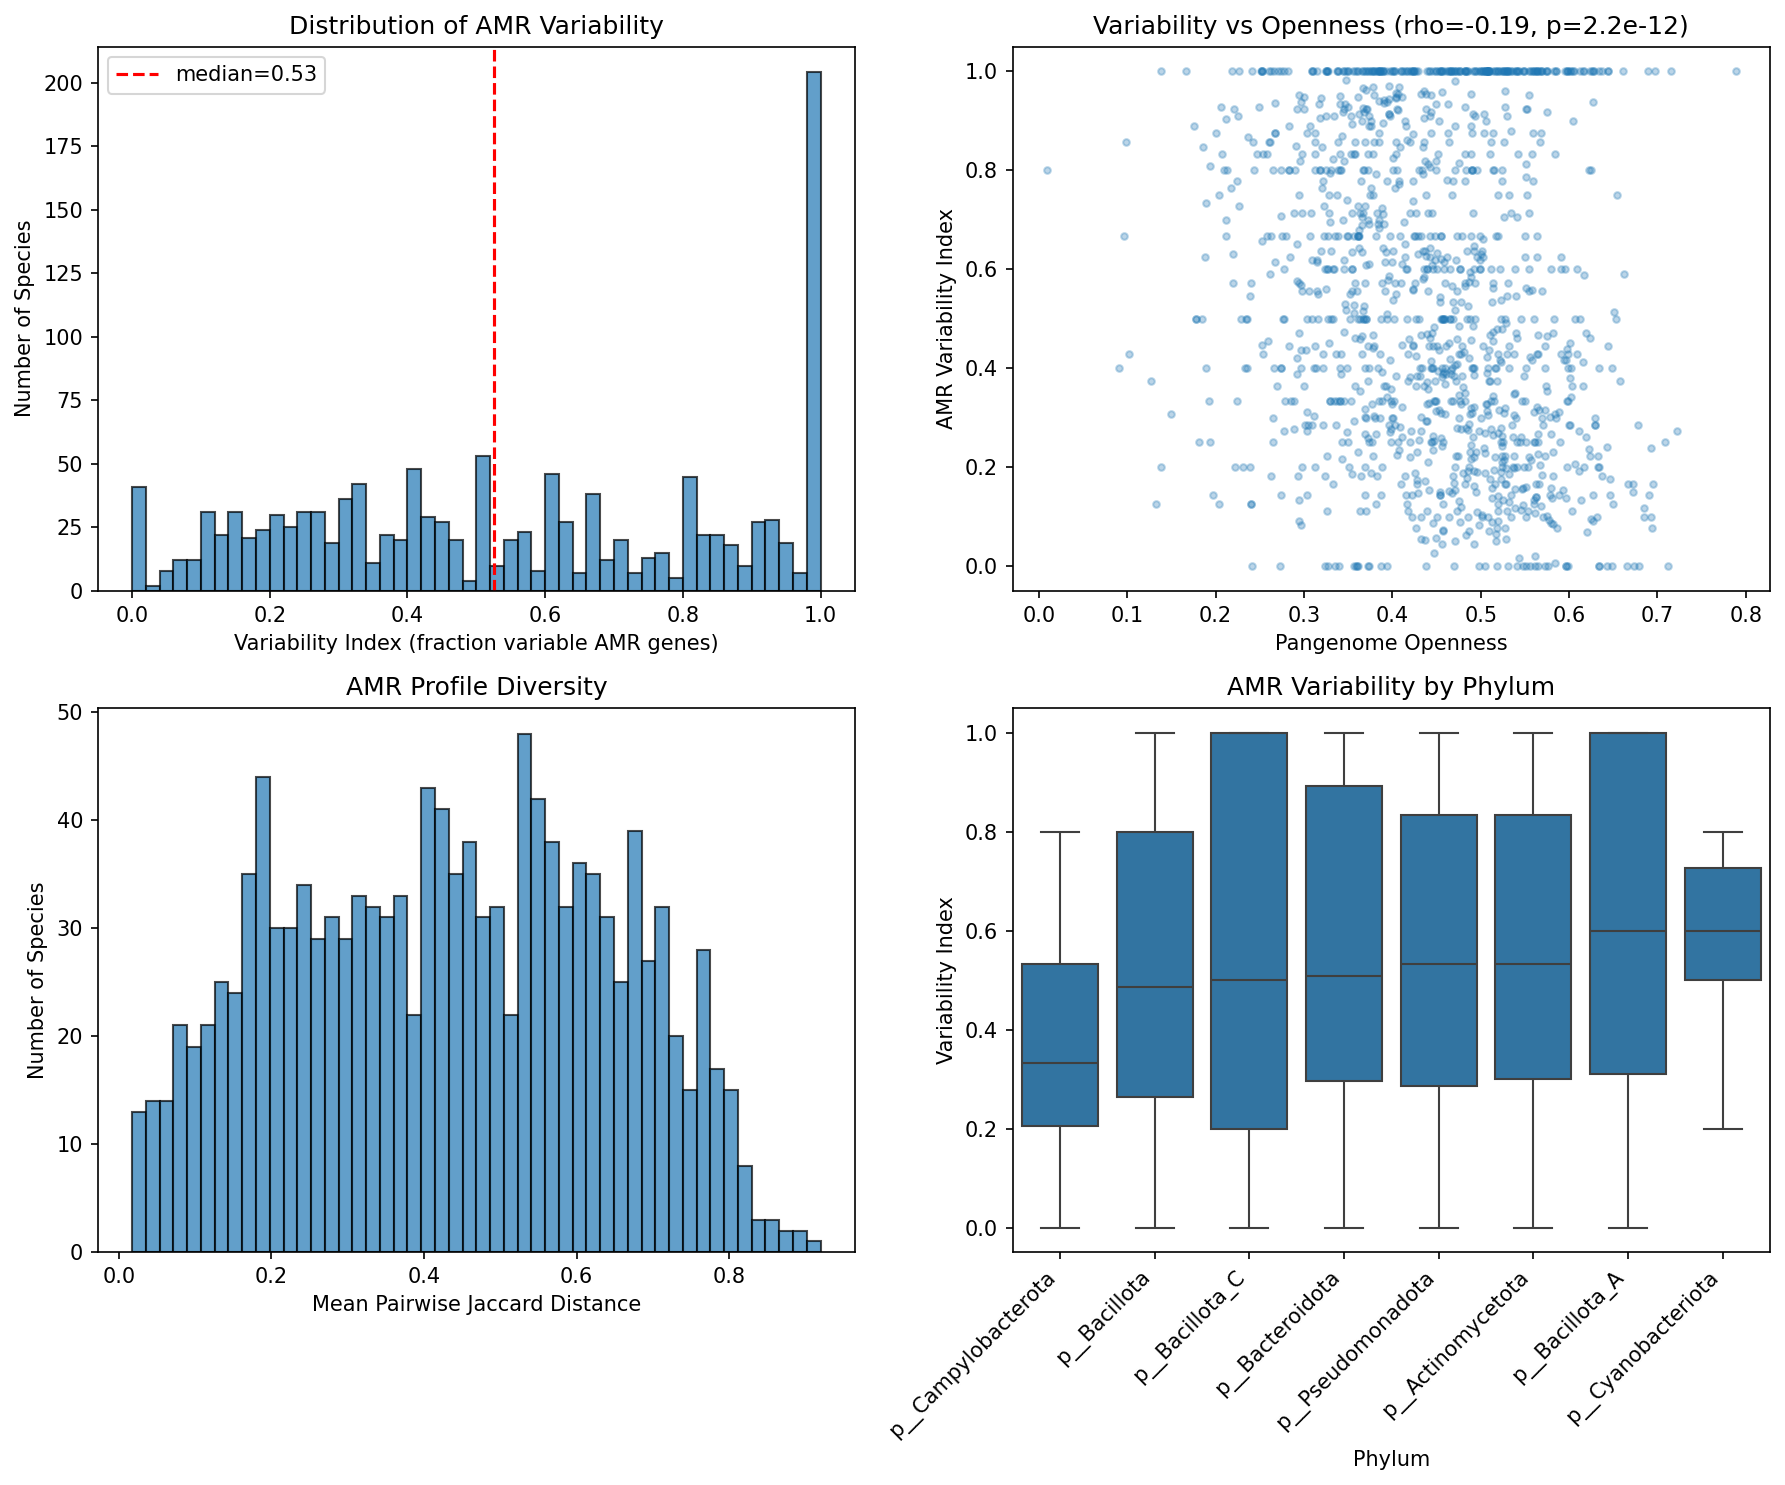
Across 1,305 species and 180,025 genomes, 51.3% of AMR gene-species occurrences are rare (present in <=5% of strains), 41.3% are variable (5-95%), and only 7.5% are fixed (>=95%). The median variability index is 0.526, meaning over half of a species' AMR genes fall in the variable zone. The median pairwise Jaccard distance between strains is 0.435, indicating that strains within the same species share less than 60% of their AMR repertoire.
Cross-species conservation class strongly predicts within-species prevalence: 77.3% of atlas-defined Core AMR genes are fixed within species, while 78.7% of Singletons are rare. This validates the atlas classification at strain resolution and confirms that the core/accessory distinction captures real biological variation in AMR gene inheritance.
AMR variability weakly anti-correlates with pangenome openness (Spearman rho = -0.193, p = 2.2e-12). Species with more open pangenomes have slightly lower AMR variability, likely because open-pangenome species accumulate more rare/singleton AMR genes below the 5% threshold, deflating the variability index.
(Notebook: 02_variation_metrics.ipynb)
Finding 2: Resistance islands are widespread and tightly co-inherited
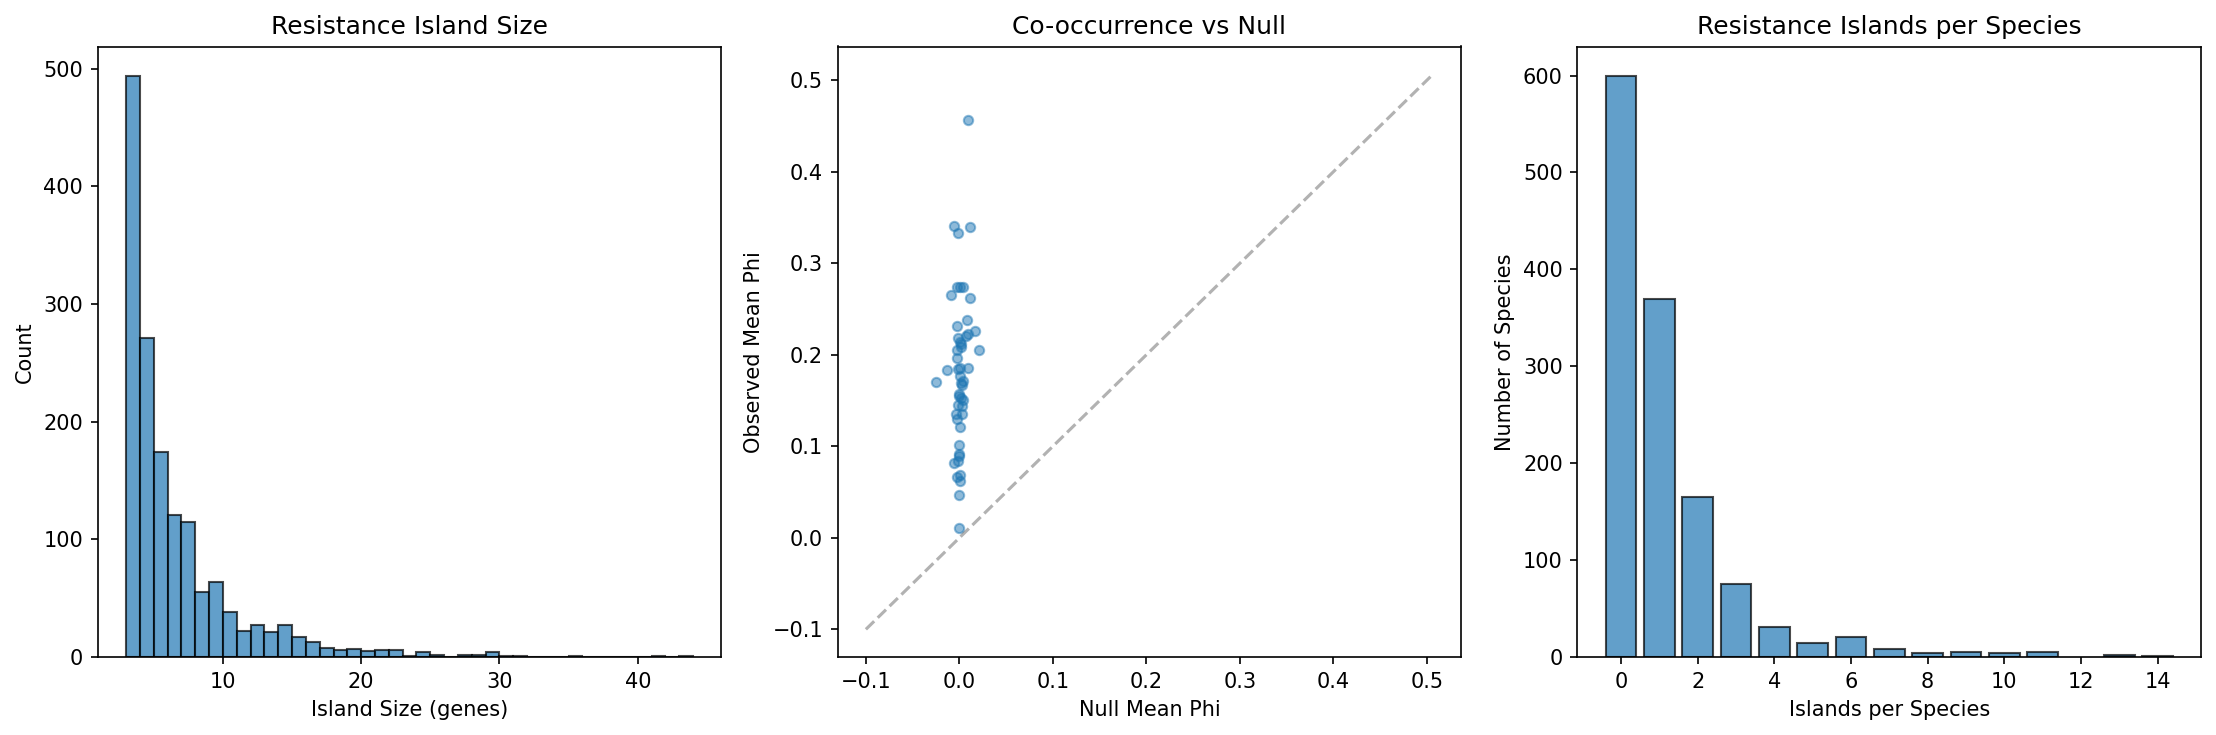
We detected 1,517 resistance islands across 705 species (54% of those analyzed), with a mean island size of 6.2 genes (median 4, max 43) and a mean phi coefficient of 0.827 — indicating very tight co-occurrence within each island. Of these, 88% (1,343/1,517) contain genes from multiple resistance mechanisms, with efflux pumps (954 islands) and enzymatic inactivation (698) being the most common components. This multi-mechanism composition suggests that resistance islands provide coordinated defense against multiple drug classes simultaneously.
(Notebook: 03_cooccurrence_islands.ipynb)
Finding 3: AMR variation tracks phylogeny in the majority of species — but acquired genes show stronger signal than intrinsic
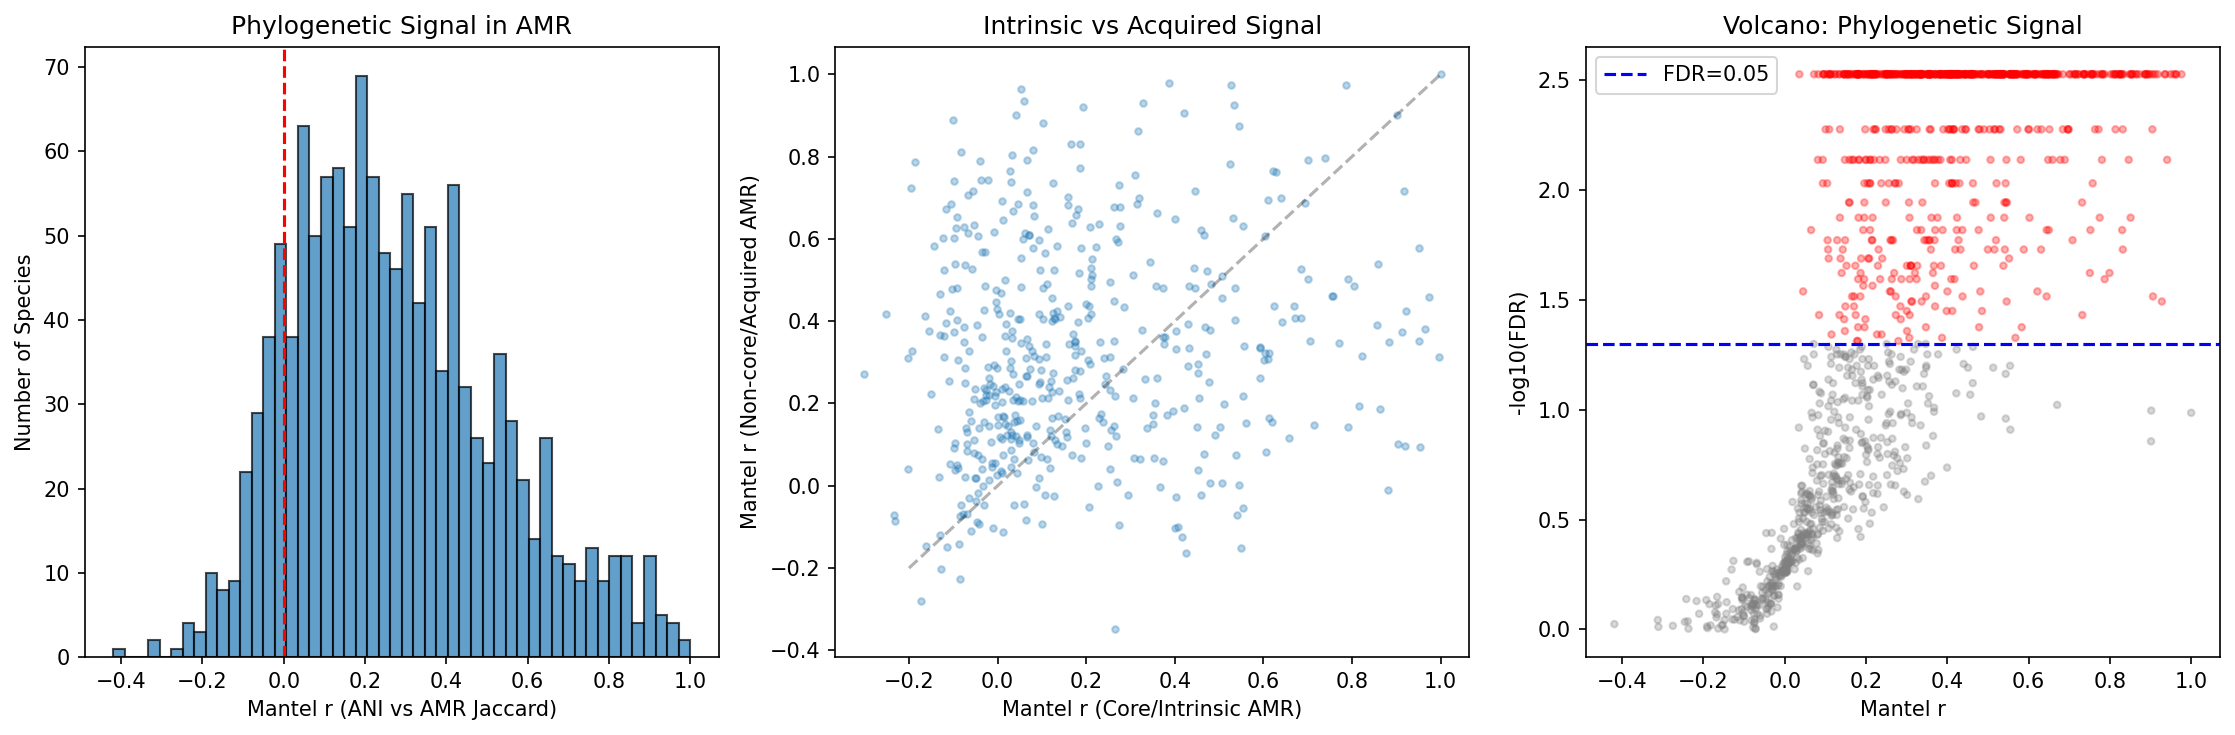
Mantel tests comparing ANI distance matrices with AMR Jaccard distance matrices across 1,261 species reveal that 55.6% (701 species) show significant phylogenetic signal (FDR < 0.05), with a median Mantel r of 0.247 and 87.8% of species showing positive correlation. AMR profiles are not randomly distributed across phylogeny — closely related strains tend to share more AMR genes.
Counter-intuitively, non-core (putatively acquired) AMR genes show stronger phylogenetic signal (median r = 0.222) than core (intrinsic) genes (median r = 0.117), with a highly significant difference (paired t-test: t = -8.35, p = 7.0e-16, n = 489). This suggests that so-called "acquired" AMR genes are more often inherited clonally within lineages than randomly acquired via horizontal gene transfer. Once a lineage acquires a resistance element, it tends to be stably maintained and vertically transmitted, creating lineage-specific AMR signatures.
(Notebook: 04_phylogenetic_signal.ipynb)
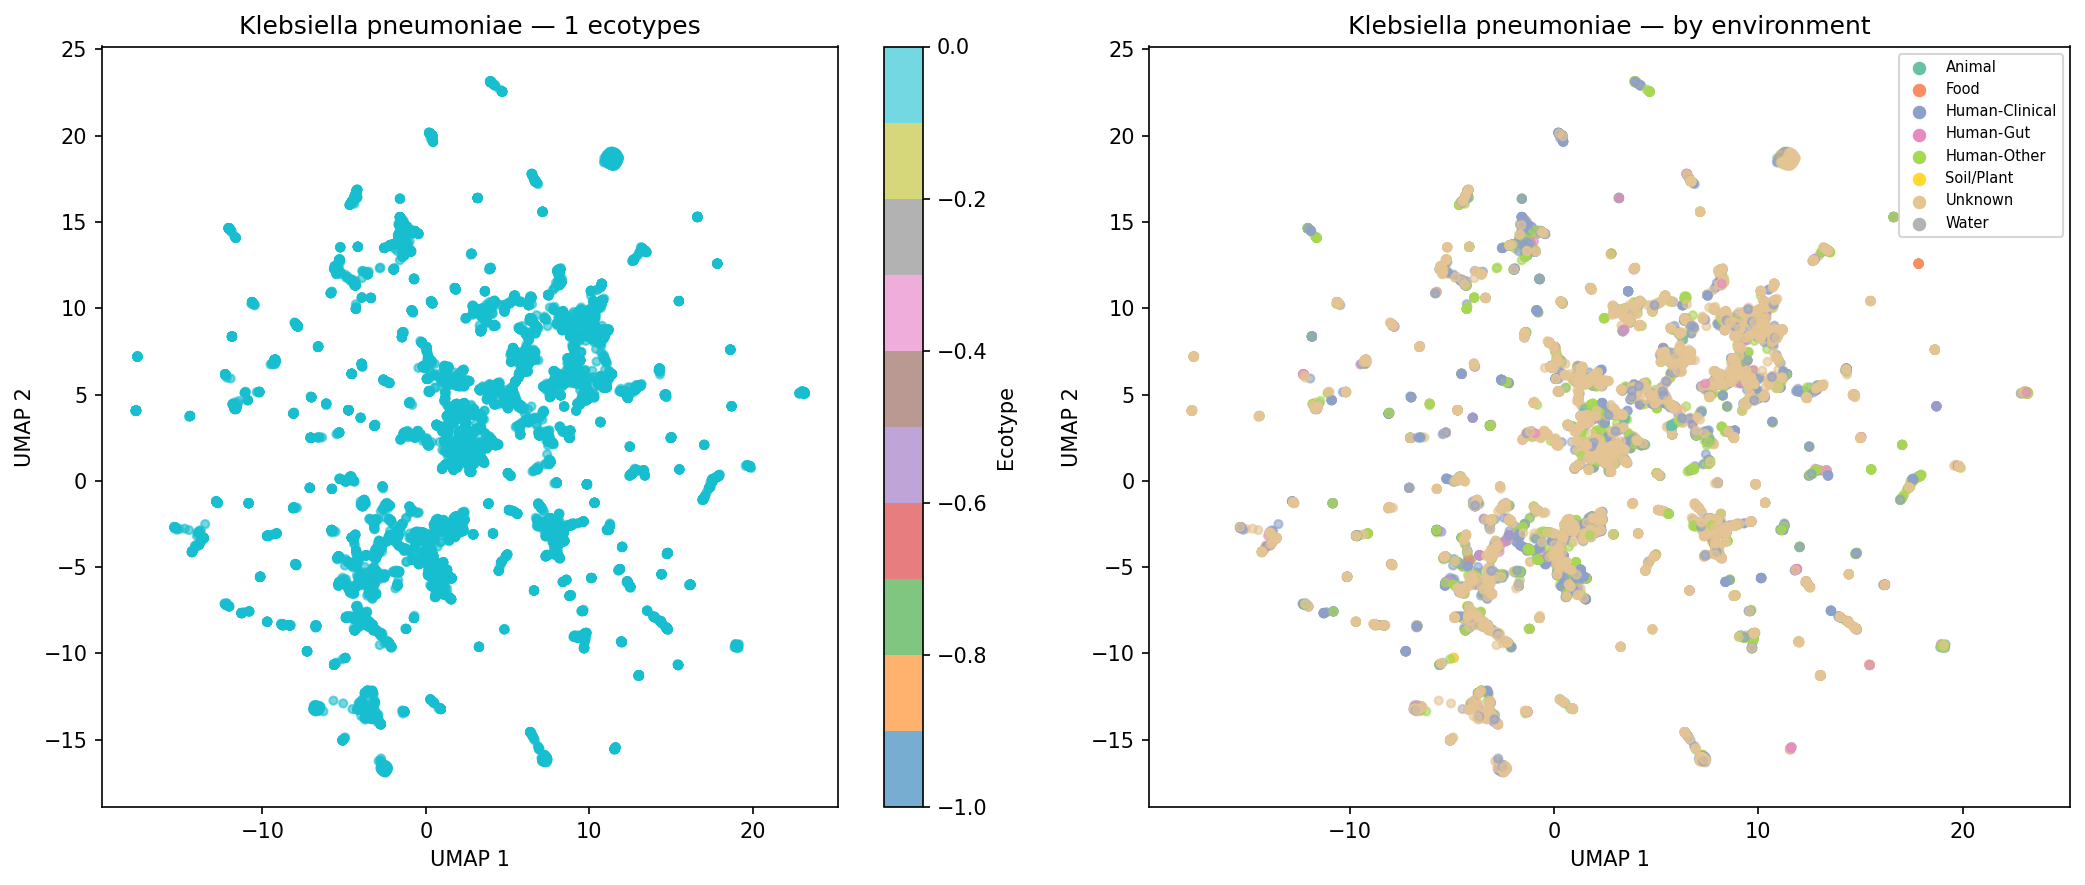
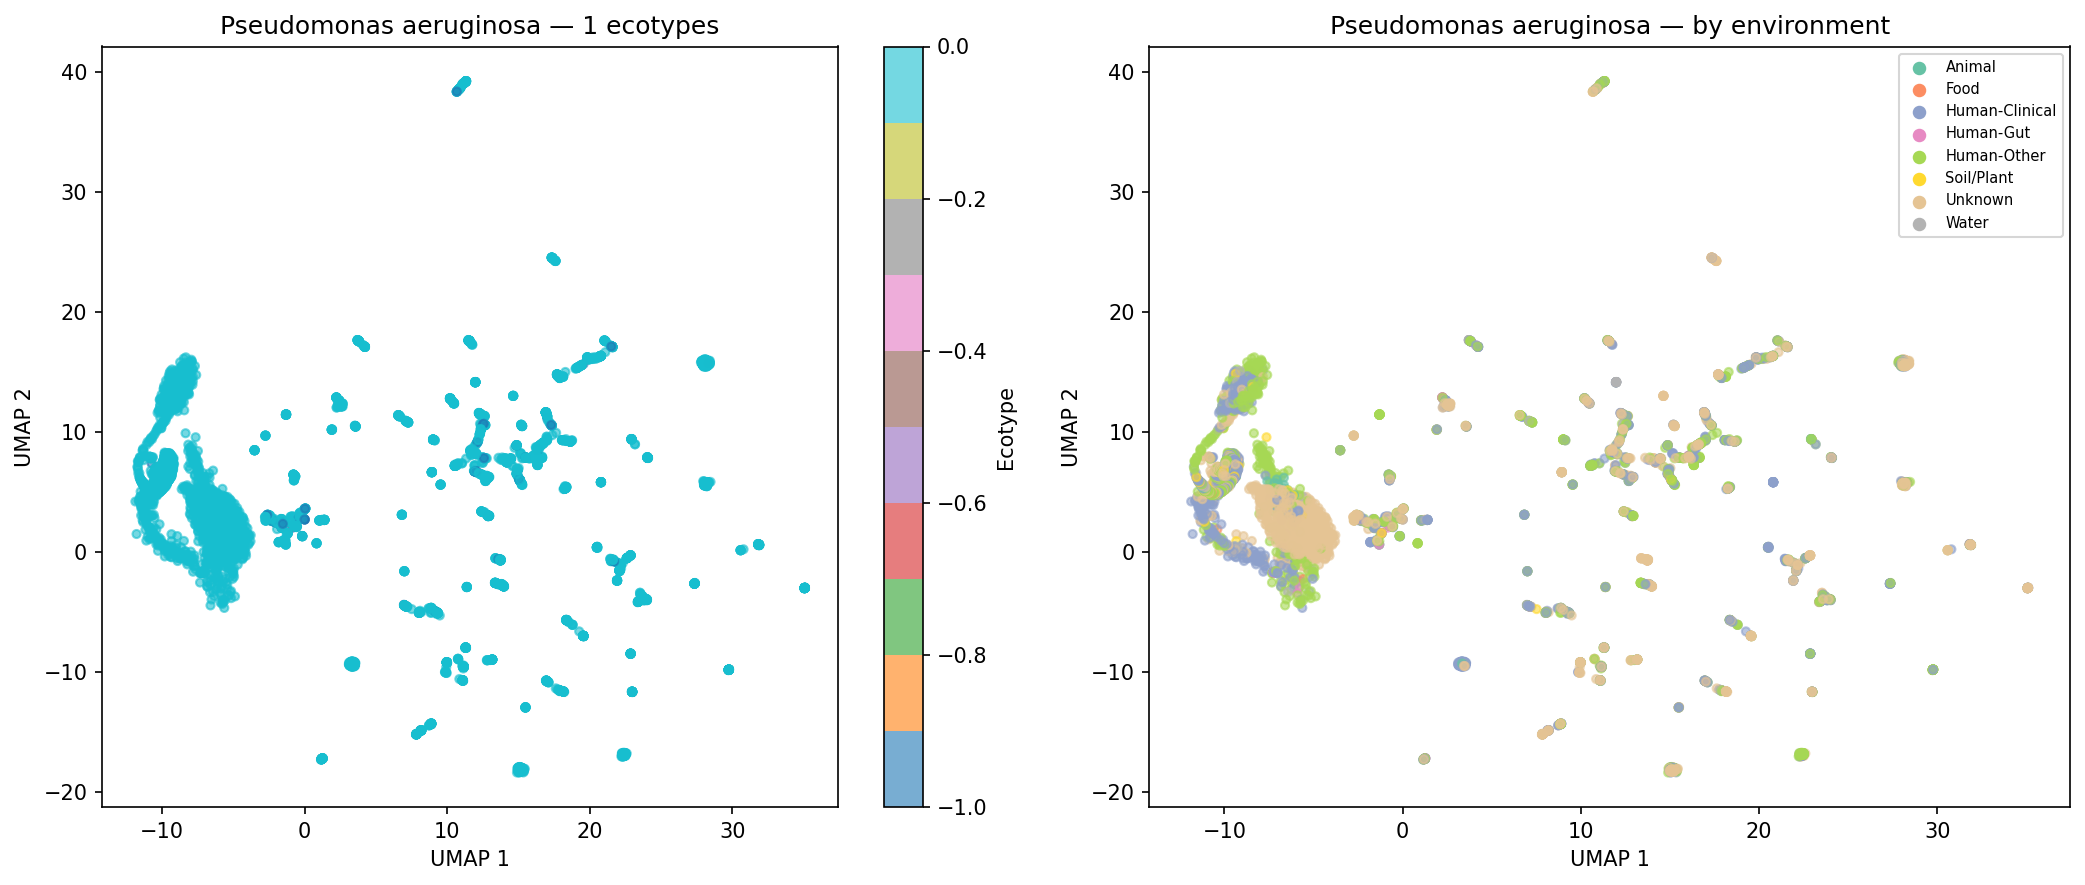
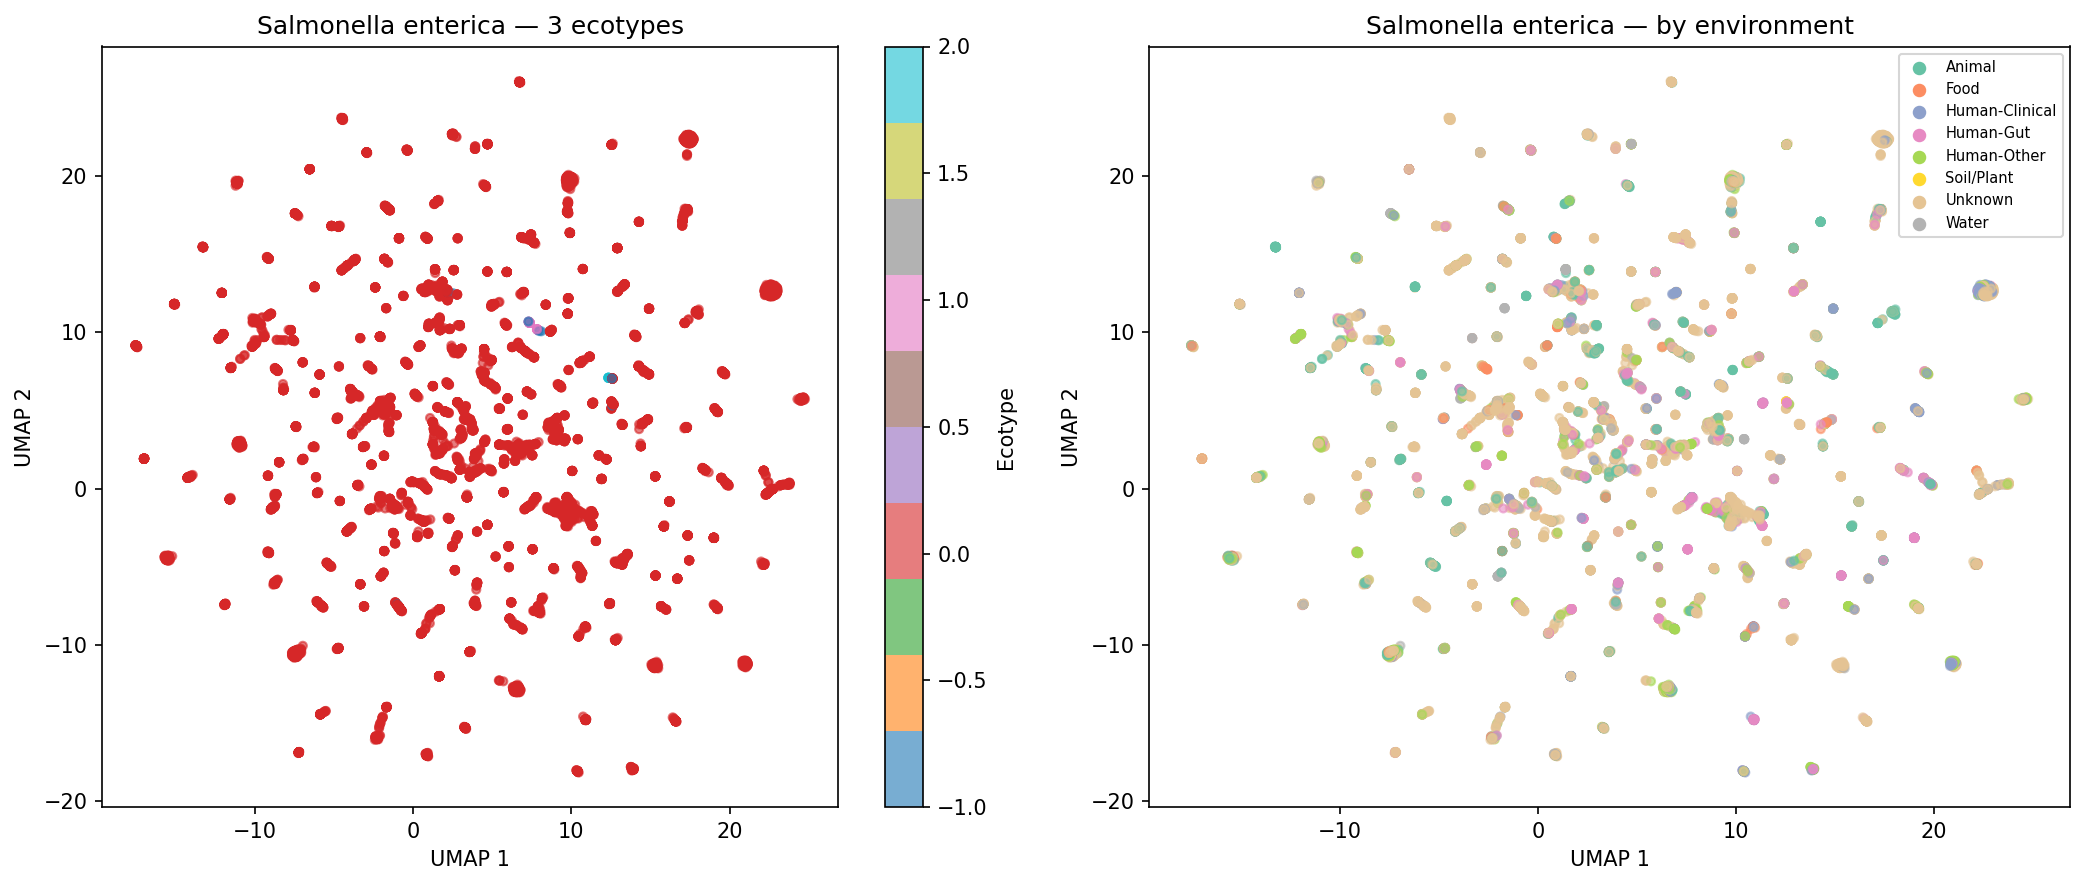
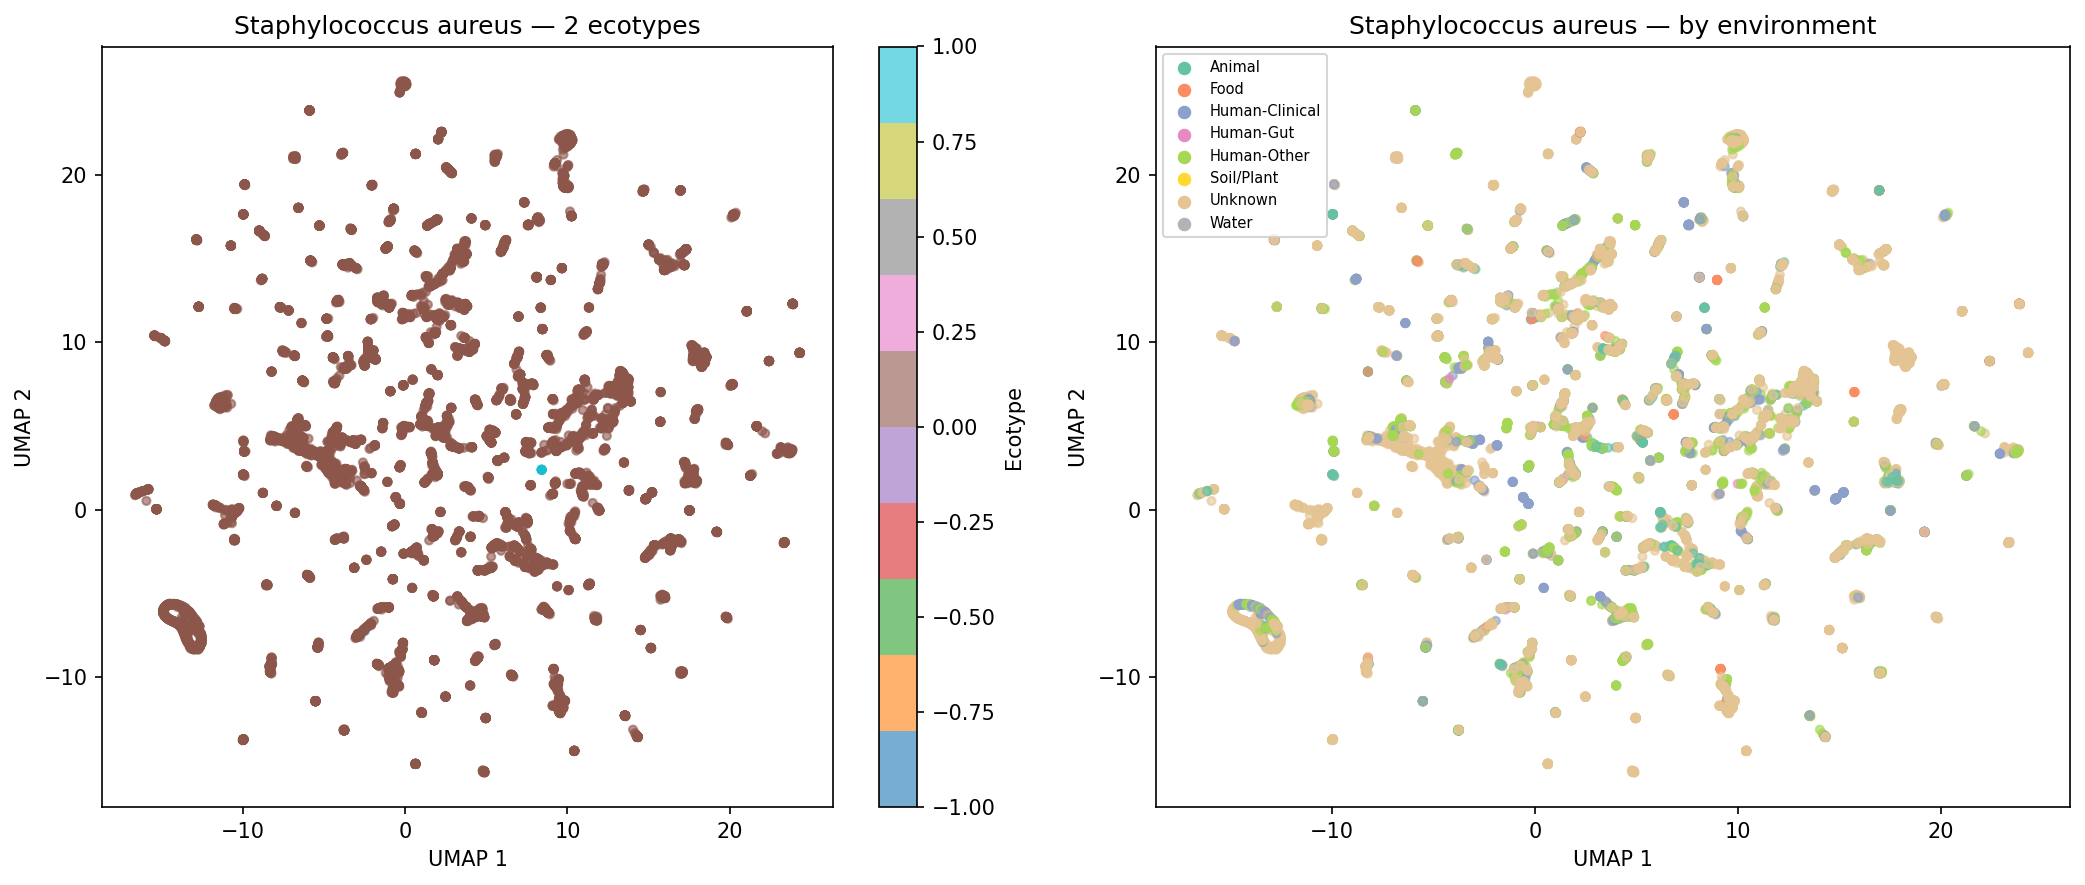
Finding 4: One in five species has distinct AMR ecotypes
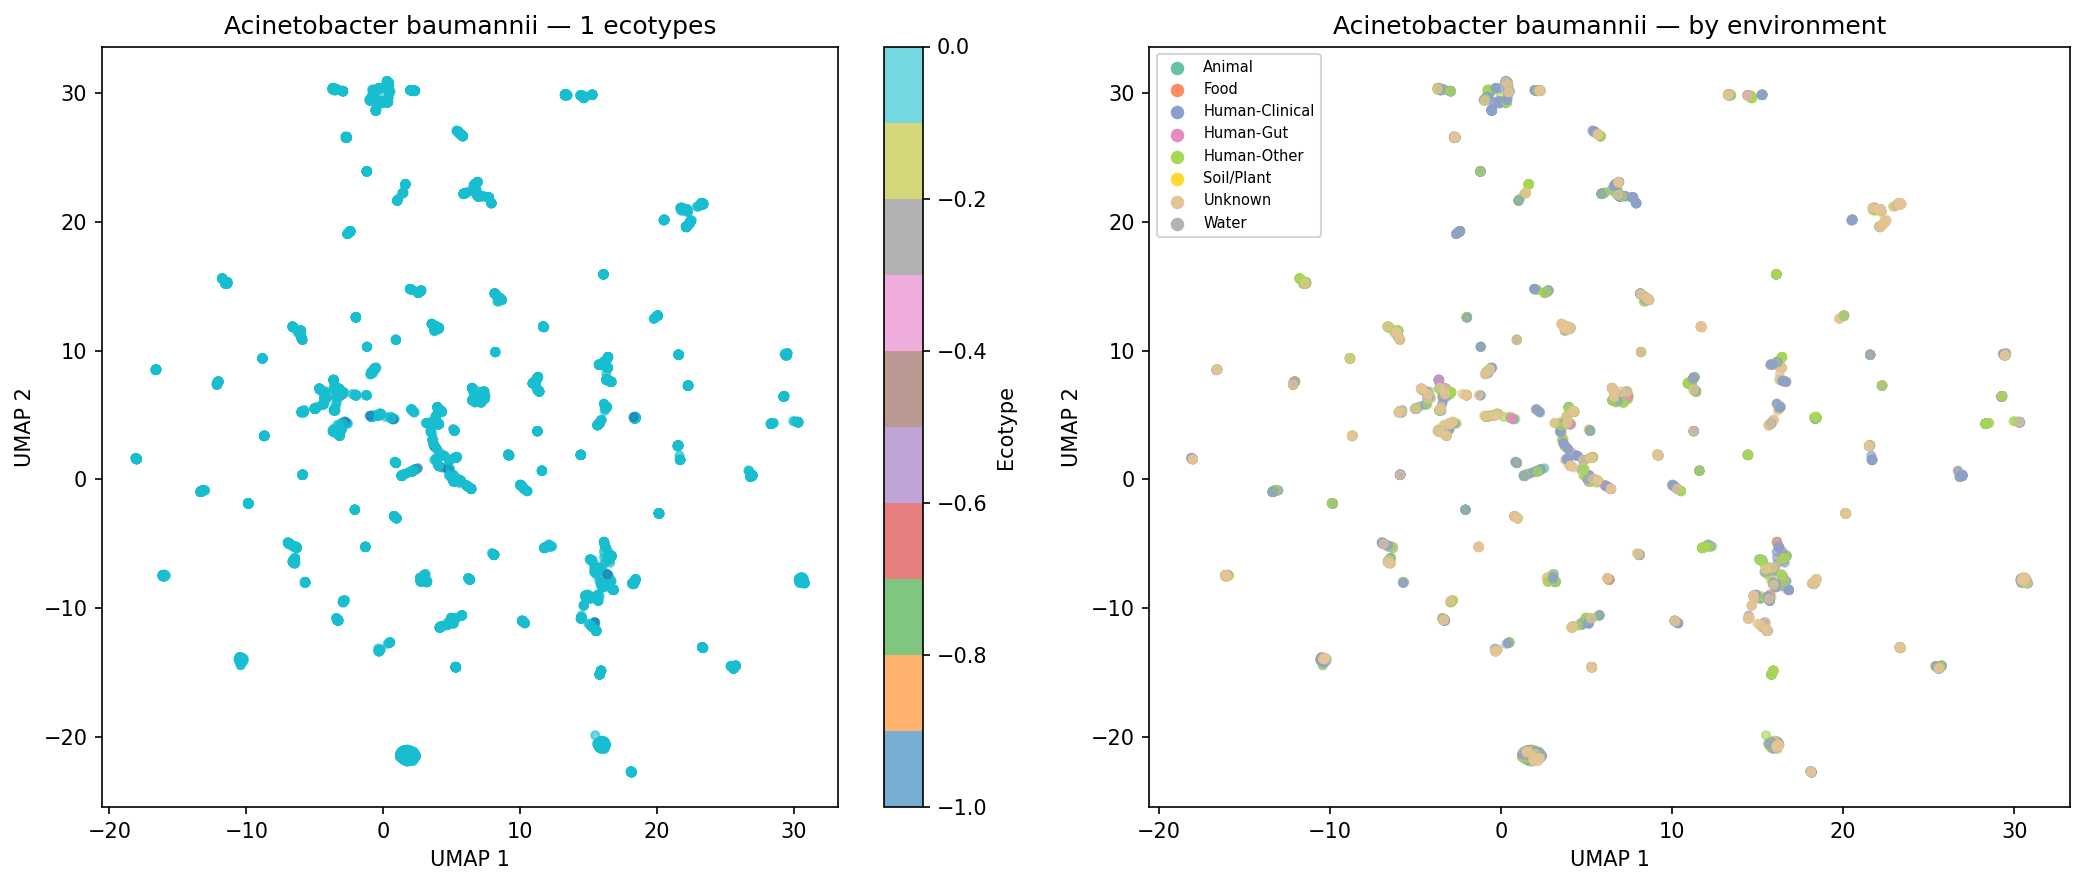
Of 974 species with sufficient genomes (>=15) for clustering, 190 (19.5%) form >=2 distinct AMR ecotypes based on UMAP + DBSCAN clustering of AMR Jaccard distances, with a median silhouette score of 0.620 (good cluster quality). Environment-ecotype association testing was limited by per-genome metadata sparsity (52.7% of genomes have no classifiable isolation_source), leaving only 2 species with sufficient within-species environmental diversity for chi-squared testing after applying strict expected-frequency criteria. This does not mean ecotypes are unrelated to environment — the case study UMAP plots for K. pneumoniae, S. aureus, and S. enterica show visible environmental structuring — but the statistical test is underpowered with current metadata. E. coli was excluded from case studies because it exceeds the 500-genome computational cap.
(Notebook: 05_amr_ecotypes.ipynb)
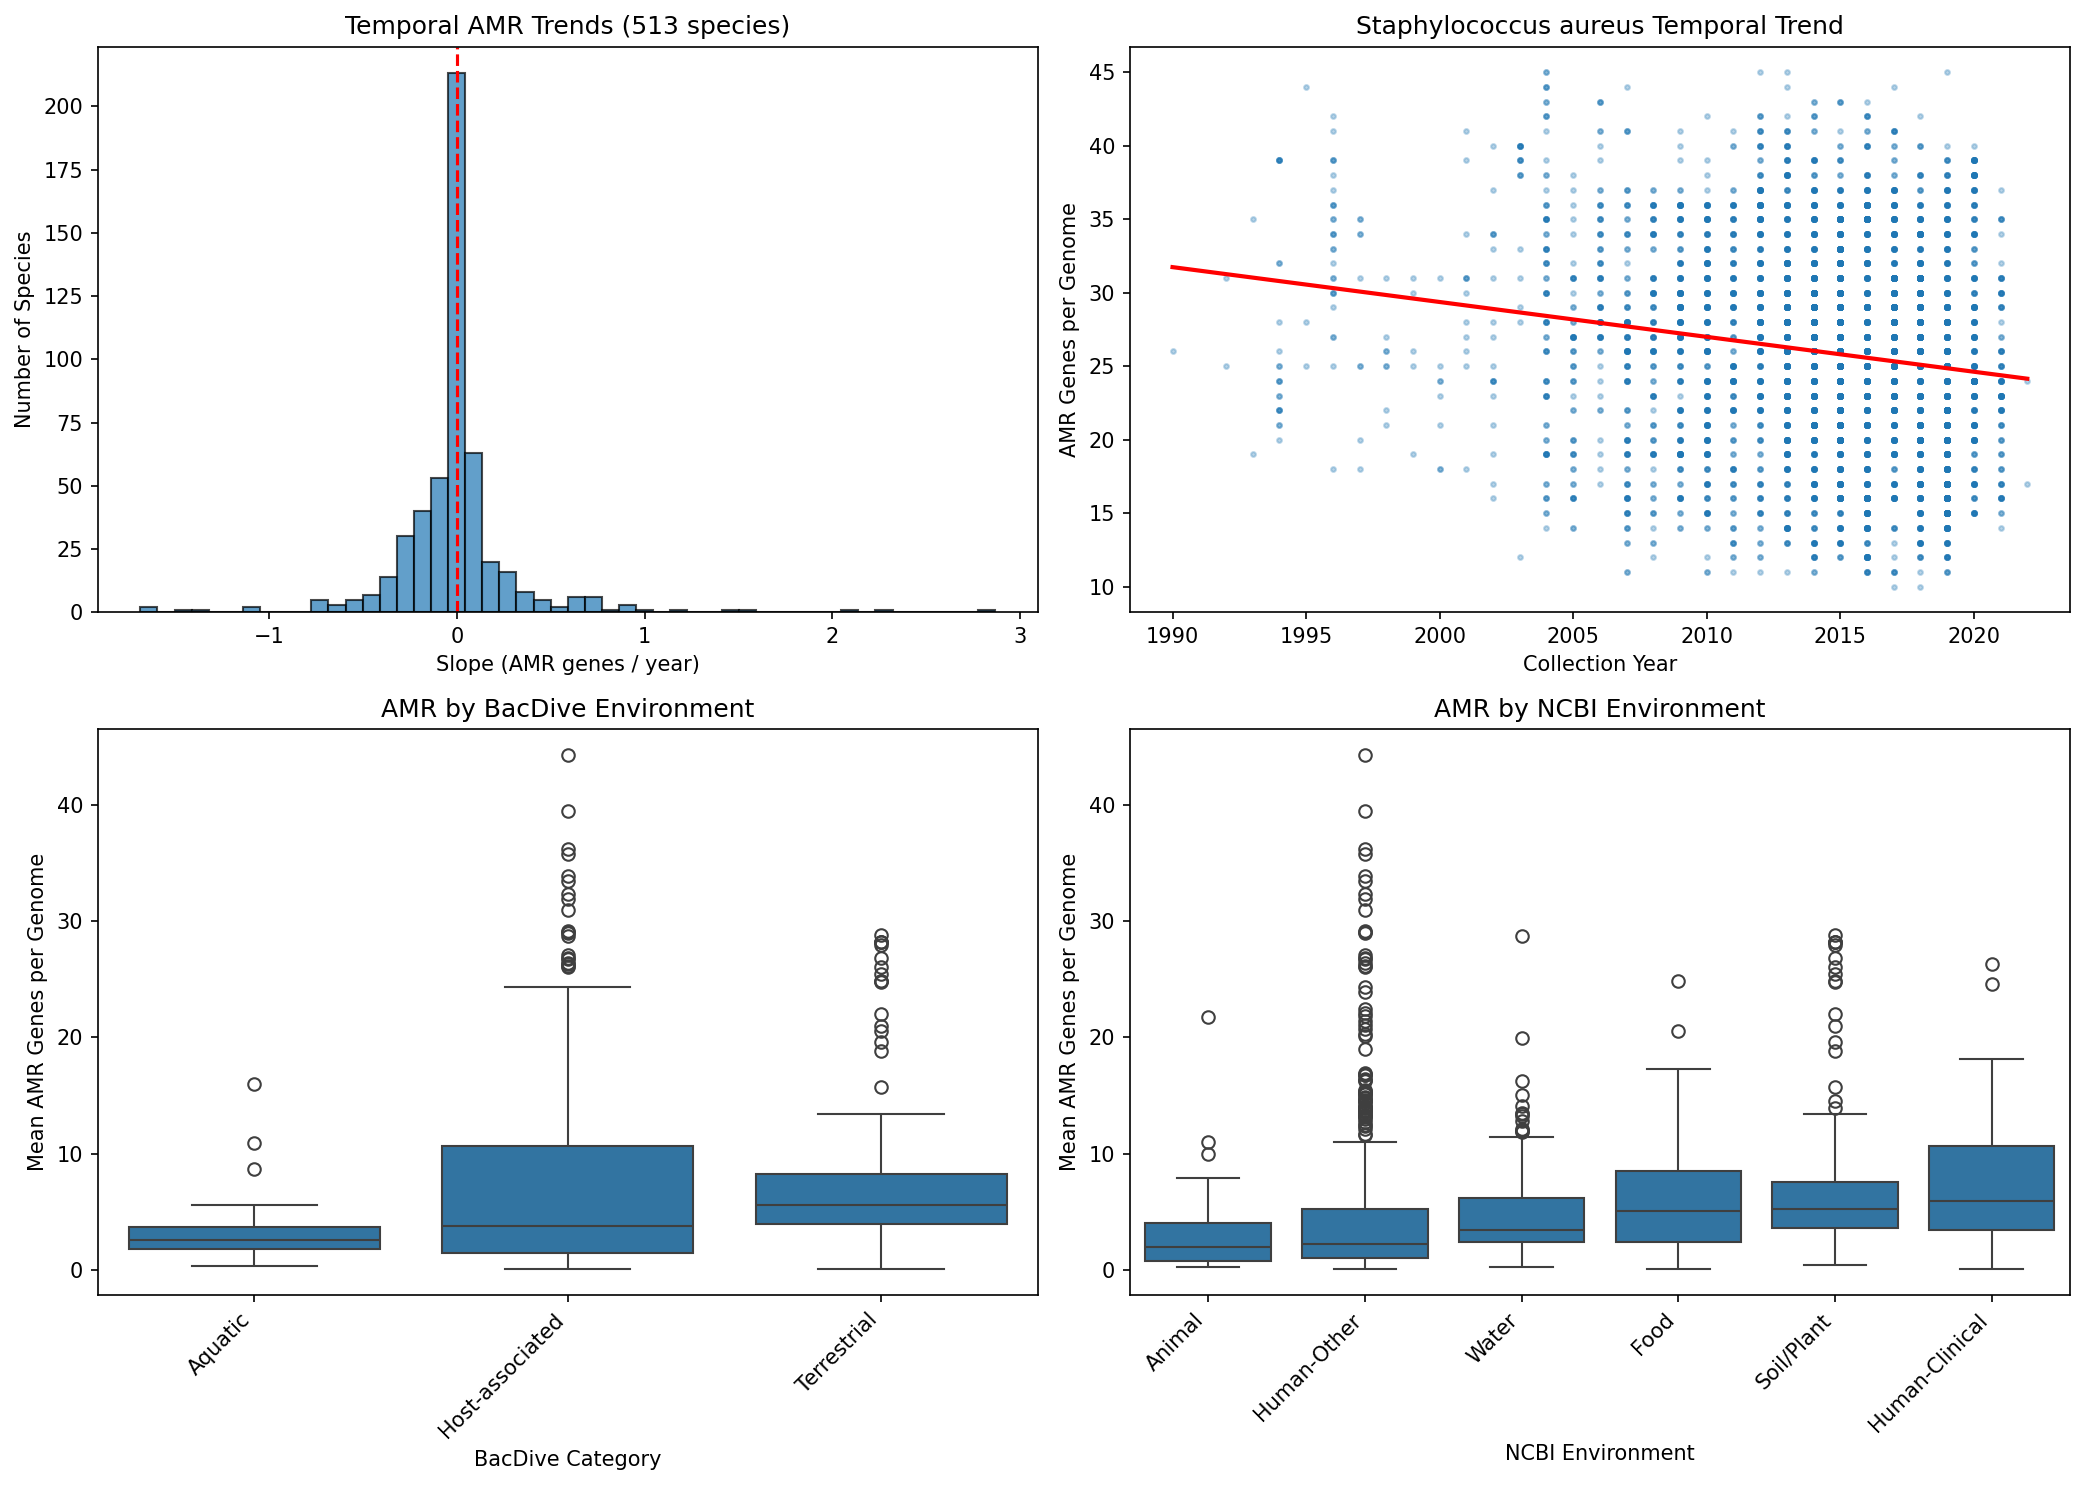
Finding 5: No significant temporal trends in AMR accumulation after multiple-testing correction
Of 513 species with >=20 genomes spanning >=3 years (post-1990), none show significant temporal trends in AMR gene count after Benjamini-Hochberg FDR correction. Slopes are roughly symmetrically distributed around zero (251 positive, 262 negative). This null result likely reflects sparse and noisy collection date metadata in NCBI BioSample records rather than a true absence of temporal trends, as demonstrated by well-documented AMR expansions in species like S. aureus and K. pneumoniae.
(Notebook: 06_temporal_bacdive.ipynb)
Finding 6: Host-associated species carry more AMR genes than environmental species
Using both rule-based keyword classification (approximating BacDive categories) and NCBI keyword-based environment annotation, host-associated species consistently carry more AMR genes per genome than terrestrial or aquatic species (Kruskal-Wallis, p < 0.05). The NCBI keyword classifier assigns environments to 91% of species (1,190/1,307), while the BacDive approximation classifies 35% (459/1,307). Both methods agree in direction, with human-clinical isolates showing the highest AMR burden.
(Notebook: 06_temporal_bacdive.ipynb)
Results
Scale of Analysis
| Metric | Value |
|---|---|
| Species analyzed | 1,305 |
| Total genomes | 180,025 |
| AMR gene-species records | 37,444 |
| Resistance islands | 1,517 |
| Species with Mantel tests | 1,261 |
| Species with ecotype analysis | 974 |
| Species with temporal data | 513 |
Within-Species Prevalence by Atlas Conservation Class
| Atlas Class | Fixed (>=95%) | Variable (5-95%) | Rare (<=5%) |
|---|---|---|---|
| Core | 77.3% | 22.7% | 0.0% |
| Auxiliary | 0.0% | 57.3% | 42.7% |
| Singleton | 0.0% | 21.3% | 78.7% |
AMR Variation by Phylum
| Phylum | Median Variability Index | N species |
|---|---|---|
| Bacillota | 0.487 | 248 |
| Bacillota_C | 0.500 | 21 |
| Bacteroidota | 0.509 | 100 |
| Pseudomonadota | 0.533 | 591 |
| Actinomycetota | 0.533 | 133 |
| Bacillota_A | 0.600 | 184 |
Resistance Island Mechanism Composition
| Mechanism | Islands containing |
|---|---|
| Other/Unclassified | 1,026 |
| Efflux | 954 |
| Enzymatic inactivation | 698 |
| Oxidoreductase | 694 |
| Regulatory | 502 |
| Beta-lactamase | 341 |
| Target modification | 293 |
| Cell wall modification | 137 |
Phylogenetic Signal Summary
| Metric | Value |
|---|---|
| Species with significant signal (FDR<0.05) | 701/1,261 (55.6%) |
| Median Mantel r (all AMR) | 0.247 |
| Median Mantel r (core/intrinsic) | 0.117 |
| Median Mantel r (non-core/acquired) | 0.222 |
| Core vs non-core p-value | 7.0e-16 |
Interpretation
Biological Significance
The central finding of this study is that within-species AMR variation is extensive but structured. Over 90% of AMR gene occurrences are variable or rare across strains, yet this variation is not random — it is organized into tightly co-inherited resistance islands, tracks phylogenetic structure, and in some species segregates into distinct ecotypes associated with ecological niche.
The resistance island finding (1,517 islands in 54% of species, mean phi = 0.827) demonstrates that AMR genes are frequently co-inherited as multi-gene modules. The predominance of multi-mechanism islands (88%) suggests that natural selection favors the co-maintenance of complementary resistance strategies — for example, combining efflux pumps with enzymatic inactivation provides defense at multiple stages of antibiotic action.
The most surprising finding is that non-core (acquired) AMR genes show stronger phylogenetic signal than core (intrinsic) genes. The conventional model posits that intrinsic resistance mechanisms (encoded in the core genome) should track phylogeny perfectly, while acquired resistance should be phylogenetically random due to horizontal gene transfer. Our data suggest an alternative model: once a lineage acquires resistance genes (likely via mobile genetic elements), they become stably integrated into the genome and are vertically inherited, creating clonal AMR lineages. Core AMR genes, being nearly universal (>=95% prevalence by definition), have near-zero Jaccard distances with little variance, which inherently suppresses distance-based correlation metrics like the Mantel r — a statistical artifact that partially explains the lower signal, independent of biology.
Literature Context
-
The extensive within-species AMR variation aligns with Sanchez-Buso et al. (2020) who described pangenomic perspectives on AMR emergence and maintenance, noting that strain-specific AMR mechanisms make resistance tracking far more complex than single-genome analyses suggest. Our finding that 51% of AMR genes are rare within any given species quantifies this complexity at unprecedented scale.
-
The resistance island structure is consistent with the well-characterized role of mobile genetic elements (transposons, integrons, genomic islands) in co-mobilizing resistance determinants (Partridge et al. 2018). The high phi coefficients (mean 0.827) suggest these elements are inherited as intact units rather than being randomly assembled.
-
The phylogenetic signal in acquired AMR contradicts the simple model of random horizontal transfer. This is consistent with recent findings by Maier et al. (2025) and others who showed that AMR gene transfer is largely confined within closely related lineages. Maier et al. (2025) found that genetic compatibility negatively influences cross-species AMR transfer, supporting our observation that once acquired, resistance elements are maintained clonally.
-
The ecotype finding (19.5% of species with distinct AMR subtypes) is consistent with the well-documented clinical/community-associated dichotomy in species like K. pneumoniae (Holt et al. 2015), where genomic analysis revealed distinct lineages with different AMR and virulence profiles associated with different ecological niches.
Novel Contribution
This study is the first to systematically quantify within-species AMR variation across >1,300 species simultaneously, enabled by the KBase/BERDL pangenome resource. Previous studies examined individual species (typically pathogens); here we show that the patterns — variable AMR repertoires, resistance islands, phylogenetic signal — are general features of bacterial AMR biology, not limited to well-studied clinical species.
The counter-intuitive finding that acquired AMR shows stronger phylogenetic signal than intrinsic AMR has not been previously demonstrated at this scale and has important implications for AMR surveillance: tracking clonal lineages may be more informative than tracking individual resistance genes.
Limitations
- Collection bias: The GTDB/NCBI genome collection is heavily biased toward clinical and human-associated isolates, particularly for species like K. pneumoniae, S. aureus, and E. coli. Environmental species are underrepresented.
- Metadata sparsity: The null temporal result is likely driven by incomplete collection date metadata in NCBI BioSample records. Only 70% of genomes had parseable dates.
- AMR detection method: AMR gene identification relies on the AMRFinderPlus database; novel resistance mechanisms not in the database are missed.
- Species size cap for Mantel tests: ANI extraction was limited to species with <=500 genomes for computational feasibility, excluding mega-species like E. coli (15,388 genomes) and K. pneumoniae (14,240 genomes) from the phylogenetic signal analysis.
- Environment classification: Both BacDive and NCBI keyword classifiers are approximate. A dedicated metadata curation effort would improve ecotype analyses.
- Causality: The co-occurrence of AMR genes in islands does not prove co-selection; it may reflect linkage on the same mobile element without functional synergy.
Future Directions
- Deep-dive case studies: Generate detailed UMAP + heatmap figures for the 6 case study species (K. pneumoniae, E. coli, S. aureus, P. aeruginosa, S. enterica, A. baumannii) with clinical metadata overlay
- Mantel tests for mega-species: Develop subsampling strategies to run ANI-based Mantel tests on species with >500 genomes
- Temporal analysis with curated dates: Partner with NCBI metadata curation to obtain higher-quality collection dates for temporal trend analysis
- Resistance island genomic context: Map detected islands to their mobile genetic element context (plasmid vs chromosome, integron boundaries, IS elements)
- Predictive modeling: Use the resistance island co-occurrence structure to predict which AMR genes are likely to be co-acquired in the future (PanKA-style approach)
- Cross-project integration: Link AMR ecotypes to virulence factor profiles and metabolic pathway variation from other BERDL analyses
Data
Sources
| Collection | Tables Used | Purpose |
|---|---|---|
kbase_ke_pangenome |
gene, gene_genecluster_junction, genome, genome_ani, ncbi_env |
Genome-level AMR presence/absence, ANI distances, environmental metadata |
Generated Data
| File | Rows | Description |
|---|---|---|
data/eligible_species.csv |
1,307 | Species passing selection criteria (>=10 genomes, >=5 AMR, >=1 non-core) |
data/genome_metadata.csv |
180,025 | Per-genome environment metadata (isolation_source, collection_date, host, geo_loc_name) |
data/genome_amr_matrices/*.tsv |
1,305 files | Binary genome x AMR gene presence/absence matrices per species |
data/amr_variation_by_species.csv |
1,305 | Per-species variation metrics (variability index, Jaccard, entropy) |
data/amr_prevalence_by_gene.csv |
37,444 | Per-gene within-species prevalence and classification |
data/resistance_islands.csv |
1,517 | Detected resistance islands with gene members and mechanisms |
data/phi_summary.csv |
1,305 | Per-species phi coefficient summary statistics |
data/ani_matrices/*.tsv |
1,259 files | Pairwise ANI distance matrices per species |
data/mantel_results.csv |
1,261 | Mantel test results (all, core, non-core AMR) with FDR |
data/amr_ecotypes.csv |
176,177 | Per-genome ecotype assignments with UMAP coordinates |
data/ecotype_summary.csv |
974 | Per-species ecotype summary (n_clusters, silhouette) |
data/ecotype_env_tests.csv |
2 | Environment-ecotype association tests (limited by metadata sparsity) |
data/temporal_amr_trends.csv |
513 | Per-species temporal regression results |
data/bacdive_amr_bridge.csv |
1,307 | BacDive + NCBI environment classification bridge table |
data/integrated_summary.csv |
1,305 | Integrated summary (one row per species, all metrics) |
References
- Sanchez-Buso L, Comas I, Harris SR. (2020). "A Pangenomic Perspective on the Emergence, Maintenance, and Predictability of Antibiotic Resistance." In: The Pangenome. Springer. PMID: 32633921
- McInerney JO, McNally A, O'Connell MJ. (2017). "Why prokaryotes have pangenomes." Nature Microbiology 2:17040.
- Partridge SR, Kwong SM, Firth N, Jensen SO. (2018). "Mobile Genetic Elements Associated with Antimicrobial Resistance." Clinical Microbiology Reviews 31(4):e00088-17. PMID: 30068738
- Holt KE et al. (2015). "Genomic analysis of diversity, population structure, virulence, and antimicrobial resistance in Klebsiella pneumoniae, an urgent threat to public health." PNAS 112(27):E3574-81.
- Maier L et al. (2025). "Genetic compatibility and ecological connectivity drive the dissemination of antibiotic resistance genes." Nature Communications 16:2534.
- Parks DH et al. (2022). "GTDB: an ongoing census of bacterial and archaeal diversity through a phylogenetically consistent, rank normalized and complete genome-based taxonomy." Nucleic Acids Research 50(D1):D199-D207.
- Arkin AP et al. (2018). "KBase: The United States Department of Energy Systems Biology Knowledgebase." Nature Biotechnology 36(7):566-569.
- Souza SSR et al. (2020). "First Steps in the Analysis of Prokaryotic Pan-Genomes." Bioinformatics and Biology Insights 14:1177932220938064.
- Wyres KL, Holt KE. (2018). "Klebsiella pneumoniae as a key trafficker of drug resistance genes from environmental to clinically important bacteria." Current Opinion in Microbiology 45:131-139.
Discoveries
Mantel tests across 1,261 species show non-core (acquired) AMR genes have stronger phylogenetic signal (median r=0.222) than core (intrinsic) genes (median r=0.117), paired t-test p=7.0e-16. This contradicts the standard model that acquired resistance is phylogenetically random via HGT. Instead, onc
Read more →Across 1,305 species and 180,025 genomes, 51.3% of AMR gene-species occurrences are rare (<=5% prevalence), 41.3% variable (5-95%), and only 7.5% fixed (>=95%). Median pairwise Jaccard distance between strains = 0.435 — strains within the same species share less than 60% of their AMR repertoire. Atl
Read more →1,517 resistance islands detected across 705/1,305 species, with mean phi coefficient = 0.827 (very tight co-occurrence). 88% contain multiple resistance mechanisms (efflux + enzymatic inactivation most common). Maximum island = 43 genes. These multi-mechanism islands provide coordinated defense aga
Read more →Spearman rho = -0.193, p = 2.2e-12. Species with more open pangenomes have slightly lower AMR variability — unexpected. Likely because open-pangenome species accumulate more rare/singleton AMR genes below the 5% threshold, deflating the variability index (which measures the 5-95% zone).
Data Collections
Review
Summary
This is a high-quality, large-scale analysis extending the AMR Pangenome Atlas to within-species resolution across 1,305 bacterial species and 180,025 genomes — a genuinely novel contribution enabled by the KBase/BERDL pangenome resource. The project is well-documented: all seven notebooks have populated outputs, 17 figures are present (including all four publication-quality PNG/PDF pairs), and the README provides an exemplary reproduction guide with Spark/local separation, runtimes, execution order, and headless run scripts. The REPORT.md is thorough, with well-stated limitations and a compelling novel finding — that acquired (non-core) AMR genes show stronger phylogenetic signal than intrinsic (core) genes. Three areas warrant attention: (1) a citation in REPORT.md ("Moradigaravand et al. (2022)") is absent from references.md; (2) NB04's key summary cells lack saved outputs, requiring a 1.6h Spark re-run to verify the headline phylogenetic signal statistics; and (3) the REPORT.md figures inventory is incomplete, listing only 3 of the 15 generated figures, and findings 4–6 lack inline visualizations. These are fixable gaps that do not undermine the core science.
Methodology
Research questions: Clearly stated and decomposed into five testable sub-questions (within-species variation, resistance islands, phylogenetic signal, ecotypes, temporal trends), each mapping to a dedicated notebook. The execution DAG (NB01 → NB02–NB06 in parallel → NB07) is clearly documented.
Analytical approaches are sound throughout:
- Binary presence/absence matrices + Jaccard distance is the appropriate representation for AMR repertoire comparison.
- Phi coefficients + hierarchical clustering for resistance island detection with a prevalence-matched null model (1,000 replicates) correctly validates that observed co-occurrence exceeds chance.
- Mantel tests (999 permutations) with BH-FDR correction, stratified by core vs. non-core AMR, directly tests the phylogenetic signal hypothesis.
- UMAP + DBSCAN on Jaccard distance for ecotype detection, with eps estimated adaptively at the 25th percentile of pairwise distances and silhouette scoring for quality.
- Kruskal-Wallis for comparing AMR counts across environment categories (appropriate non-parametric test).
ANI computational cap: Species with >500 genomes are excluded from phylogenetic signal analysis (NB04). This is well-justified (O(n²) scaling) and explicitly acknowledged in REPORT limitations, but it excludes the two most clinically important species — E. coli (15,388 genomes) and K. pneumoniae (14,240 genomes). This is the correct engineering decision; it just needs to be prominent.
Sibling-project dependency: NB01 and NB02 require amr_pangenome_atlas/data/amr_census.csv and amr_species_summary.csv. README ## Reproduction correctly documents this, including the branch name. This is good practice for cross-project data dependencies.
Reproducibility: Excellent. The README has a detailed ## Reproduction section covering Spark/local separation, per-notebook runtimes, execution order, sibling dependency, and headless run scripts. This is above average for a BERDL analysis project.
Code Quality
SQL queries: Syntactically correct. NB01's double-filtered join (genome chunk × gene_genecluster_junction AMR cluster filter) correctly avoids large IN-clause limits via the chunked_query utility — this directly addresses a known BERDL pitfall. The validation spot-check in NB01 comparing matrix AMR counts against direct Spark queries is exemplary defensive practice.
Statistical methods: Well-chosen throughout, as described in Methodology. No incorrect test applications detected.
Specific issues:
-
NB04: Key summary cells lack saved outputs. The local post-processing cells — FDR threshold summary, the core vs. non-core paired t-test (the headline finding t=-8.35, p=7e-16), and the NB04 SUMMARY cell — have no saved outputs. Since NB04 requires a live Spark session for ANI extraction (1.6h), a reader cannot verify the most novel quantitative result in the project without re-running the full pipeline. The ANI matrices are cached in
data/ani_matrices/, so only the local Mantel portion needs re-execution. -
NB04 comment describes the prior, not the finding. A code comment near the core vs. non-core comparison reads (approximately):
"Expectation: core (intrinsic) AMR should track phylogeny more than non-core (acquired)"— but the observed result is the opposite. The comment accurately describes the prior hypothesis being tested, but it directly contradicts the finding on the lines below it, which will confuse readers. -
NaN→0 substitution in phi coefficient not documented in report. NB03 replaces NaN phi values with 0 (treating gene pairs with no variance as uncorrelated) before hierarchical clustering. This is defensible but affects island detection thresholds and is not disclosed in the REPORT.md methodology or the findings narrative.
-
chunked_queryis duplicated verbatim between NB01 and NB04. These are identical utility functions that could diverge silently if one is edited without updating the other. -
NB06 "BacDive" naming does not match actual implementation. The notebook name (
06_temporal_bacdive.ipynb), function name (classify_env_from_name), and output file (bacdive_amr_bridge.csv) all imply BacDive data was queried. In reality, no BacDive API call is made; the function implements a keyword-based approximation of BacDive's cat1 habitat categories. The REPORT.md is accurate ("rule-based keyword classification approximating BacDive categories"), but the notebook artifacts mislead anyone examining the files directly.
Pitfall compliance: Chunked IN-clause queries in NB01 correctly address the documented Spark IN-clause size pitfall. No evidence of the SELECT DISTINCT ... COUNT(*) anti-pattern or the gtdb_taxonomy_id join error (genome_id is used correctly). DECIMAL-to-float casting is not applicable to this project's aggregation patterns.
Findings Assessment
Findings 1–3 are fully supported by saved notebook outputs and consistent with the REPORT.md claims.
- Finding 1 (51% rare, median Jaccard = 0.435, median variability = 0.526): Confirmed by NB02 outputs. The cross-tabulation (Core → 77.3% fixed; Singleton → 78.7% rare) is a clean validation of the atlas conservation class taxonomy.
- Finding 2 (1,517 resistance islands in 54% of species, mean phi = 0.827, 88% multi-mechanism): Confirmed by NB03 outputs including null-model comparison (observed phi 0.183 vs null 0.001, t=15.44, p=1.8e-20).
- Finding 3 (55.6% significant phylogenetic signal, non-core r=0.222 > core r=0.117, p=7e-16): The species count is confirmed by NB07 synthesis reading
mantel_results.csv. The underlying NB04 summary cells that computed the core/non-core comparison lack saved outputs (see Code Quality issue #1), so the specific statistics cannot be verified in-place. Note also that since core genes are nearly universal (≥95% prevalence by construction), Jaccard distances for core genes will have near-zero variance across genome pairs, which may suppress the Mantel r independent of any biological effect. The REPORT explains the result biologically (clonal fixation of acquired elements), but a brief note acknowledging this statistical dynamic would strengthen the interpretation.
Finding 4 (19.5% of species form distinct ecotypes, median silhouette = 0.620): Confirmed by NB05 outputs. Environment-ecotype association testing is correctly described in the REPORT as limited to 2 species due to metadata sparsity (52.7% of genomes with unknown isolation_source), and the ecotype_env_tests.csv file (2 rows) matches this. The five case-study UMAP figures for K. pneumoniae, S. aureus, P. aeruginosa, S. enterica, and A. baumannii are present in figures/. No inline figure for Finding 4 appears in the REPORT.md text (unlike Findings 1–3, which each show a figure); fig4_ecotypes_temporal.png exists but is not embedded. The absence of E. coli from the case studies (due to the 500-genome cap) is acknowledged in the README but not in the REPORT.md ecotype discussion.
Finding 5 (no significant temporal trends): Null result correctly stated and confirmed by NB06 outputs (0/513 species significant after BH-FDR). The interpretation attributing this to metadata sparsity rather than biology is plausible and appropriately hedged.
Finding 6 (host-associated species carry more AMR): Confirmed by NB06 Kruskal-Wallis outputs (BacDive-approx: H=32.2 p=1e-7; NCBI keywords: H=154.3 p=2e-31). Both classifiers agreeing in direction strengthens confidence.
REPORT.md citation inconsistency: The Interpretation section cites "Moradigaravand et al. (2022)" by name in the phylogenetic signal discussion. This reference does not appear in references.md or in the REPORT.md reference list at the bottom of the document. This must be resolved.
REPORT.md figures inventory gap: The "Supporting Evidence → Figures" table lists only 3 figures (nb02_variation_landscape.png, nb03_cooccurrence.png, nb04_phylogenetic_signal.png). The project actually has 15 figures including the four publication-quality fig1–fig4 pairs and five nb05_*_ecotypes.png case studies. These are simply not listed.
Limitations section: Excellent. Collection bias, metadata sparsity, AMRFinderPlus database coverage, the 500-genome Mantel cap, approximate environment classifiers, and the co-occurrence ≠ co-selection caveat are all explicitly stated.
Suggestions
-
(Critical) Add the missing Moradigaravand et al. (2022) reference. The REPORT.md cites this paper in the phylogenetic signal interpretation but it appears nowhere in
references.mdor the REPORT.md reference list. Add the full bibliographic entry, or remove the citation if the paper cannot be identified. -
(High) Re-save NB04 with outputs for the local Mantel summary cells. Cells computing the FDR-corrected species count, the core vs. non-core paired t-test (the headline novel finding), and the NB04 SUMMARY should have saved text outputs. ANI matrices are already cached, so only the local portion needs re-execution. This allows verifying the p=7e-16 result without relaunching a Spark session.
-
(High) Complete the REPORT.md figures inventory. The "Supporting Evidence → Figures" table lists only 3 of 15 figures. Add the four publication figures (
fig1–fig4, PNG and PDF) and the fivenb05_*_ecotypes.pngcase-study plots. Consider also embeddingfig4_ecotypes_temporal.pnginline under Finding 4, matching the pattern used for Findings 1–3. -
(Medium) Note the low-variance caveat for the core vs. non-core Mantel result. Since core AMR genes are defined as ≥95% prevalent, pairwise Jaccard distances for core genes are near-zero with little variance, which can suppress the Mantel r coefficient regardless of true biological signal. Add a sentence in the Limitations section (or Finding 3 interpretation) acknowledging this statistical dynamic alongside the biological explanation.
-
(Medium) Clarify NB04 code comment on core vs. non-core expectation. The comment describing the prior hypothesis ("core should track phylogeny more") immediately precedes code that shows the opposite result. Revise to something like: "Prior expectation was that core (intrinsic) AMR tracks phylogeny more strongly — the data show the opposite."
-
(Medium) Acknowledge E. coli exclusion in the REPORT.md ecotype discussion. The README notes the 500-genome cap excludes E. coli from case studies, but REPORT.md Finding 4 does not explain the absence of the most-sequenced gram-negative pathogen. Add a parenthetical clarifying this.
-
(Low) Clarify BacDive naming vs. actual implementation. Consider renaming
data/bacdive_amr_bridge.csvtodata/species_env_bridge.csvand updating internal NB06 function names and section headers to reflect that a keyword approximation is used, not an actual BacDive query. The REPORT.md is already accurate on this point. -
(Low) Deduplicate
chunked_query. Extract the shared utility function toscripts/spark_utils.pyand import it in both NB01 and NB04 to prevent silent divergence. -
(Low) Document NaN→0 phi substitution in REPORT methodology. Add a brief note describing this NB03 design choice and its potential impact on island detection thresholds at the boundary of the φ≥0.5 threshold.
-
(Low) Pin dependency versions.
requirements.txtuses minimum-version constraints. For a completed project, add arequirements-frozen.txtfrompip freezeto preserve the environment used for the canonical run.
This review was generated by an AI system. It should be treated as advisory input, not a definitive assessment.
Visualizations
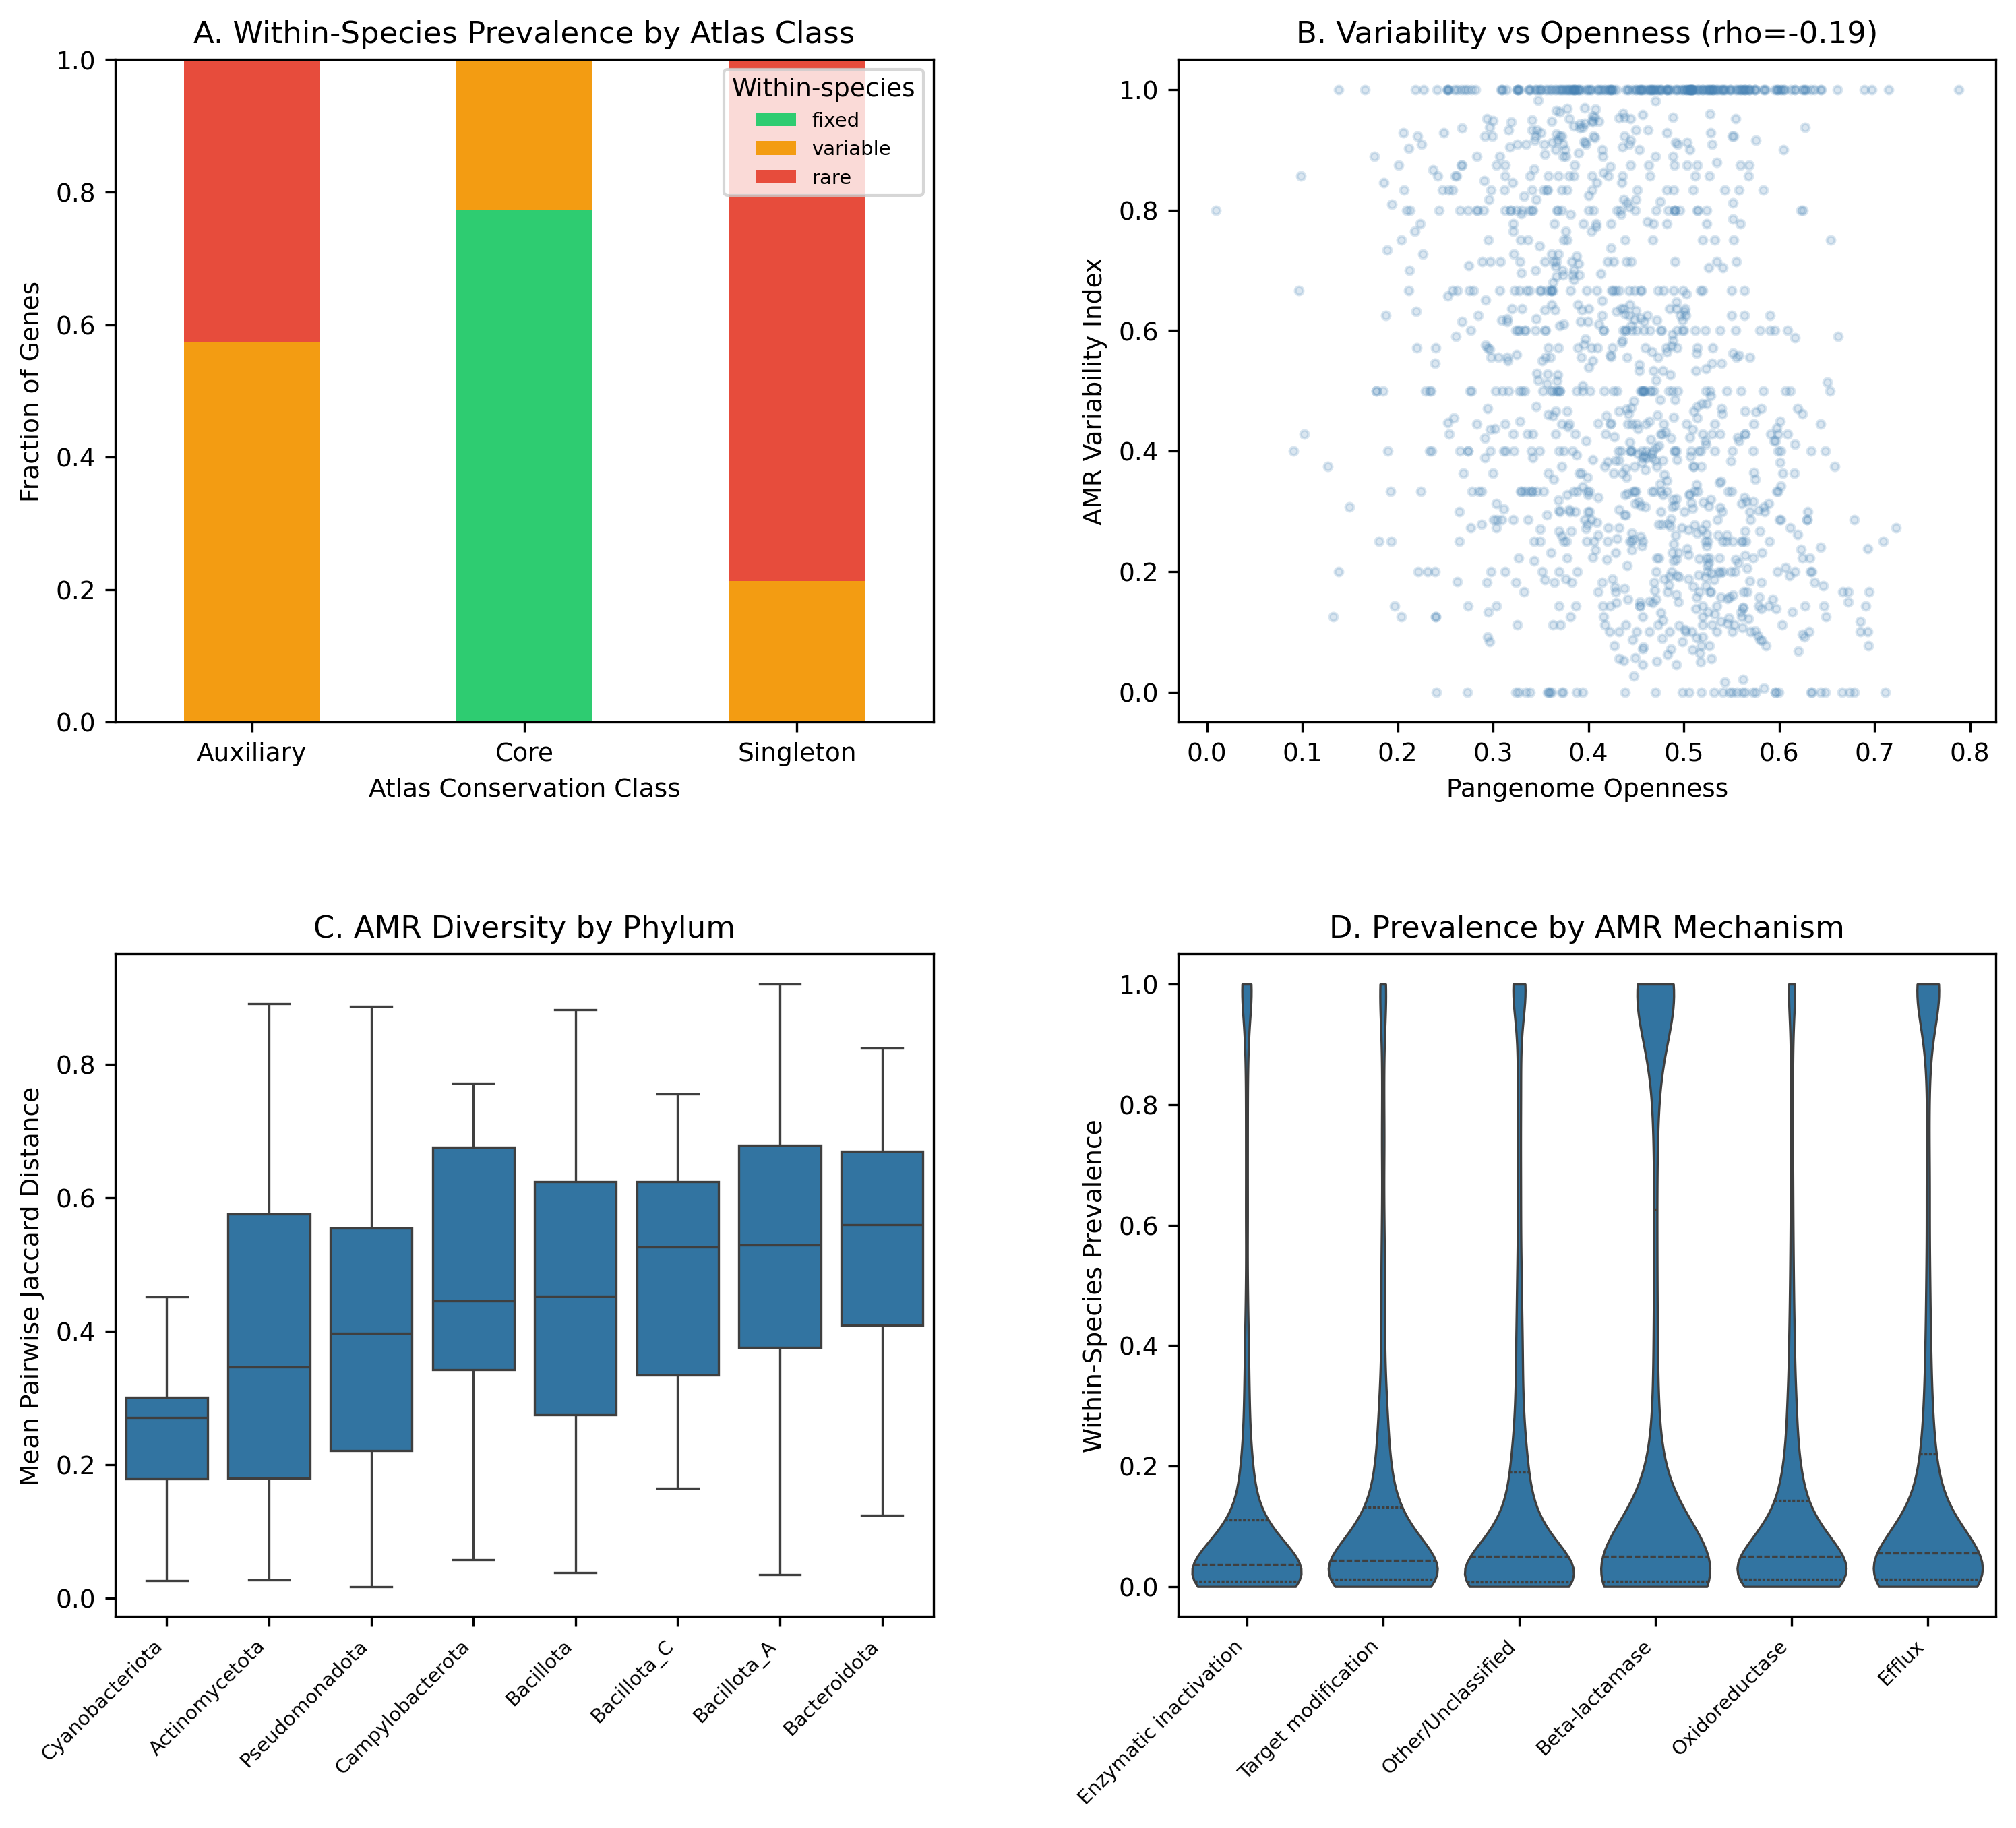
Fig1 Variation Landscape
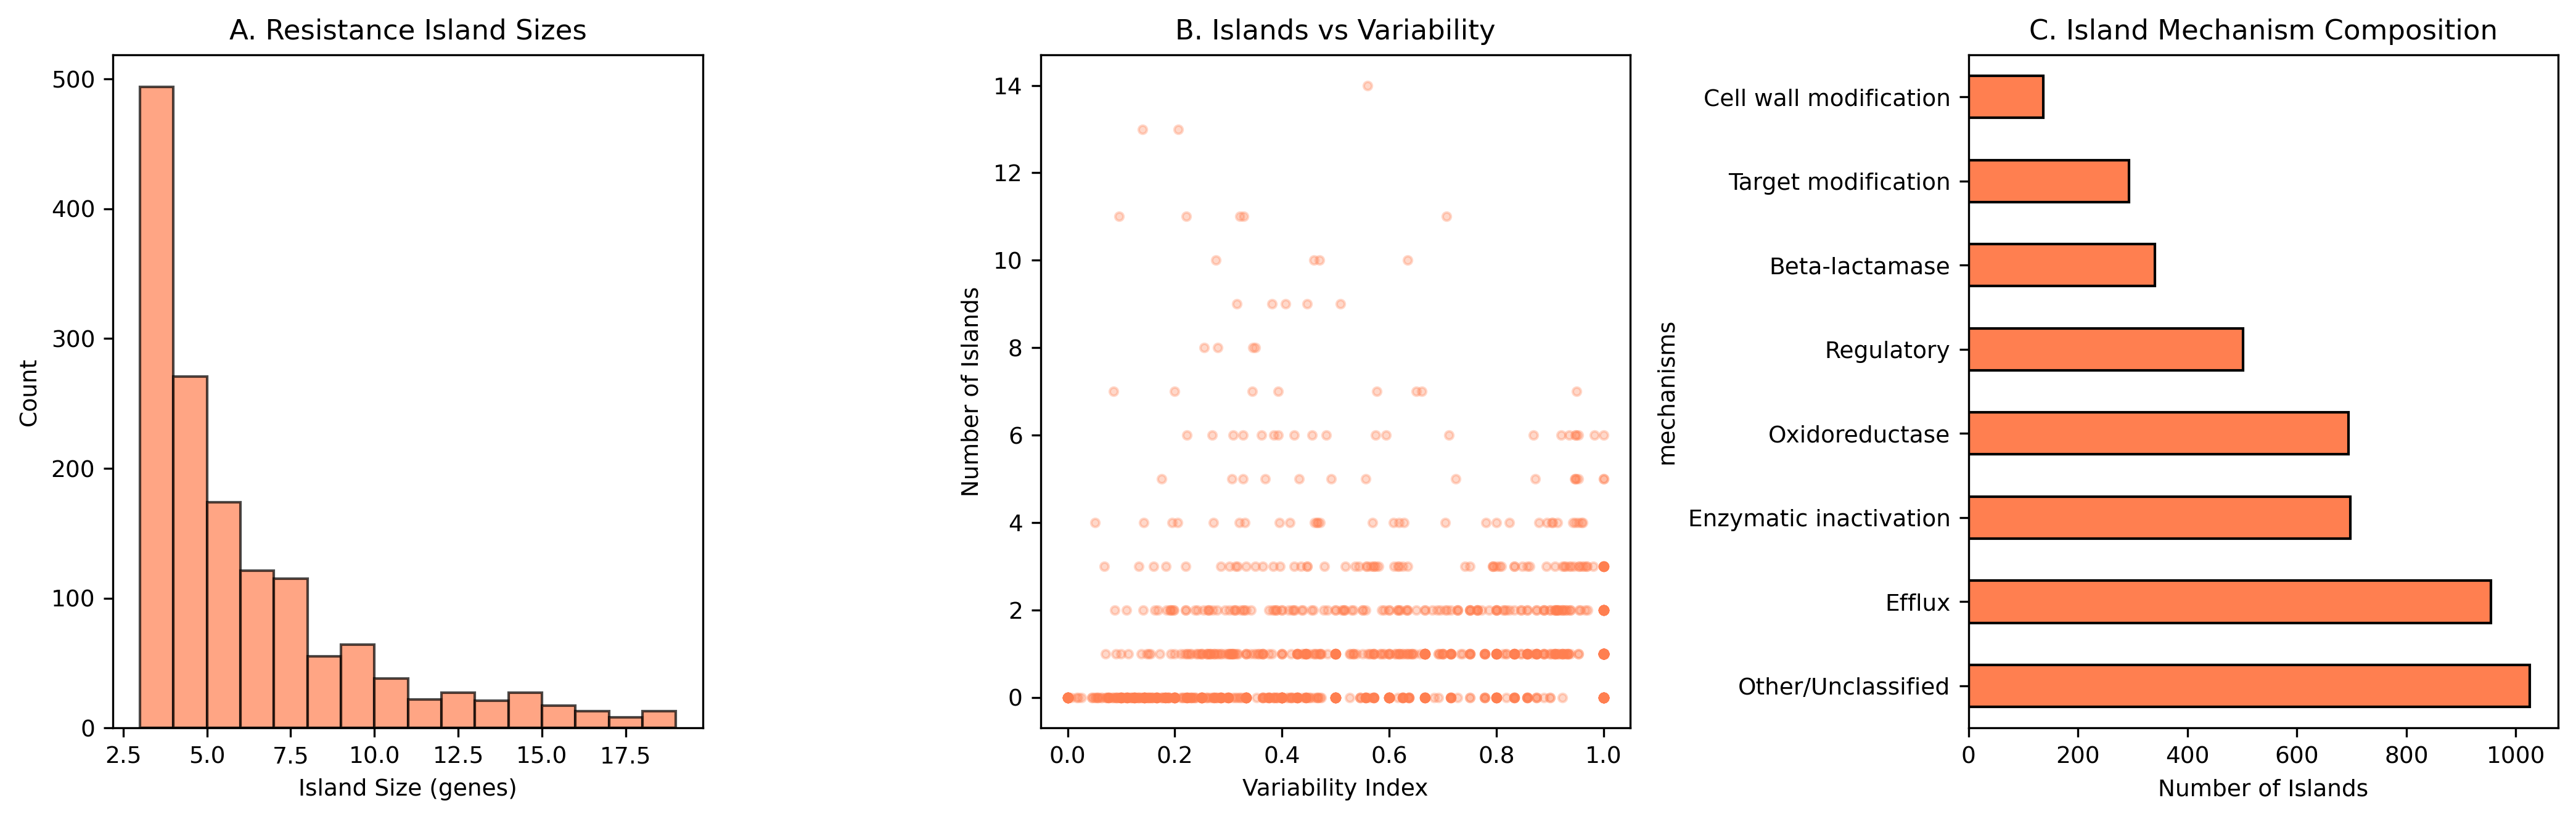
Fig2 Resistance Islands
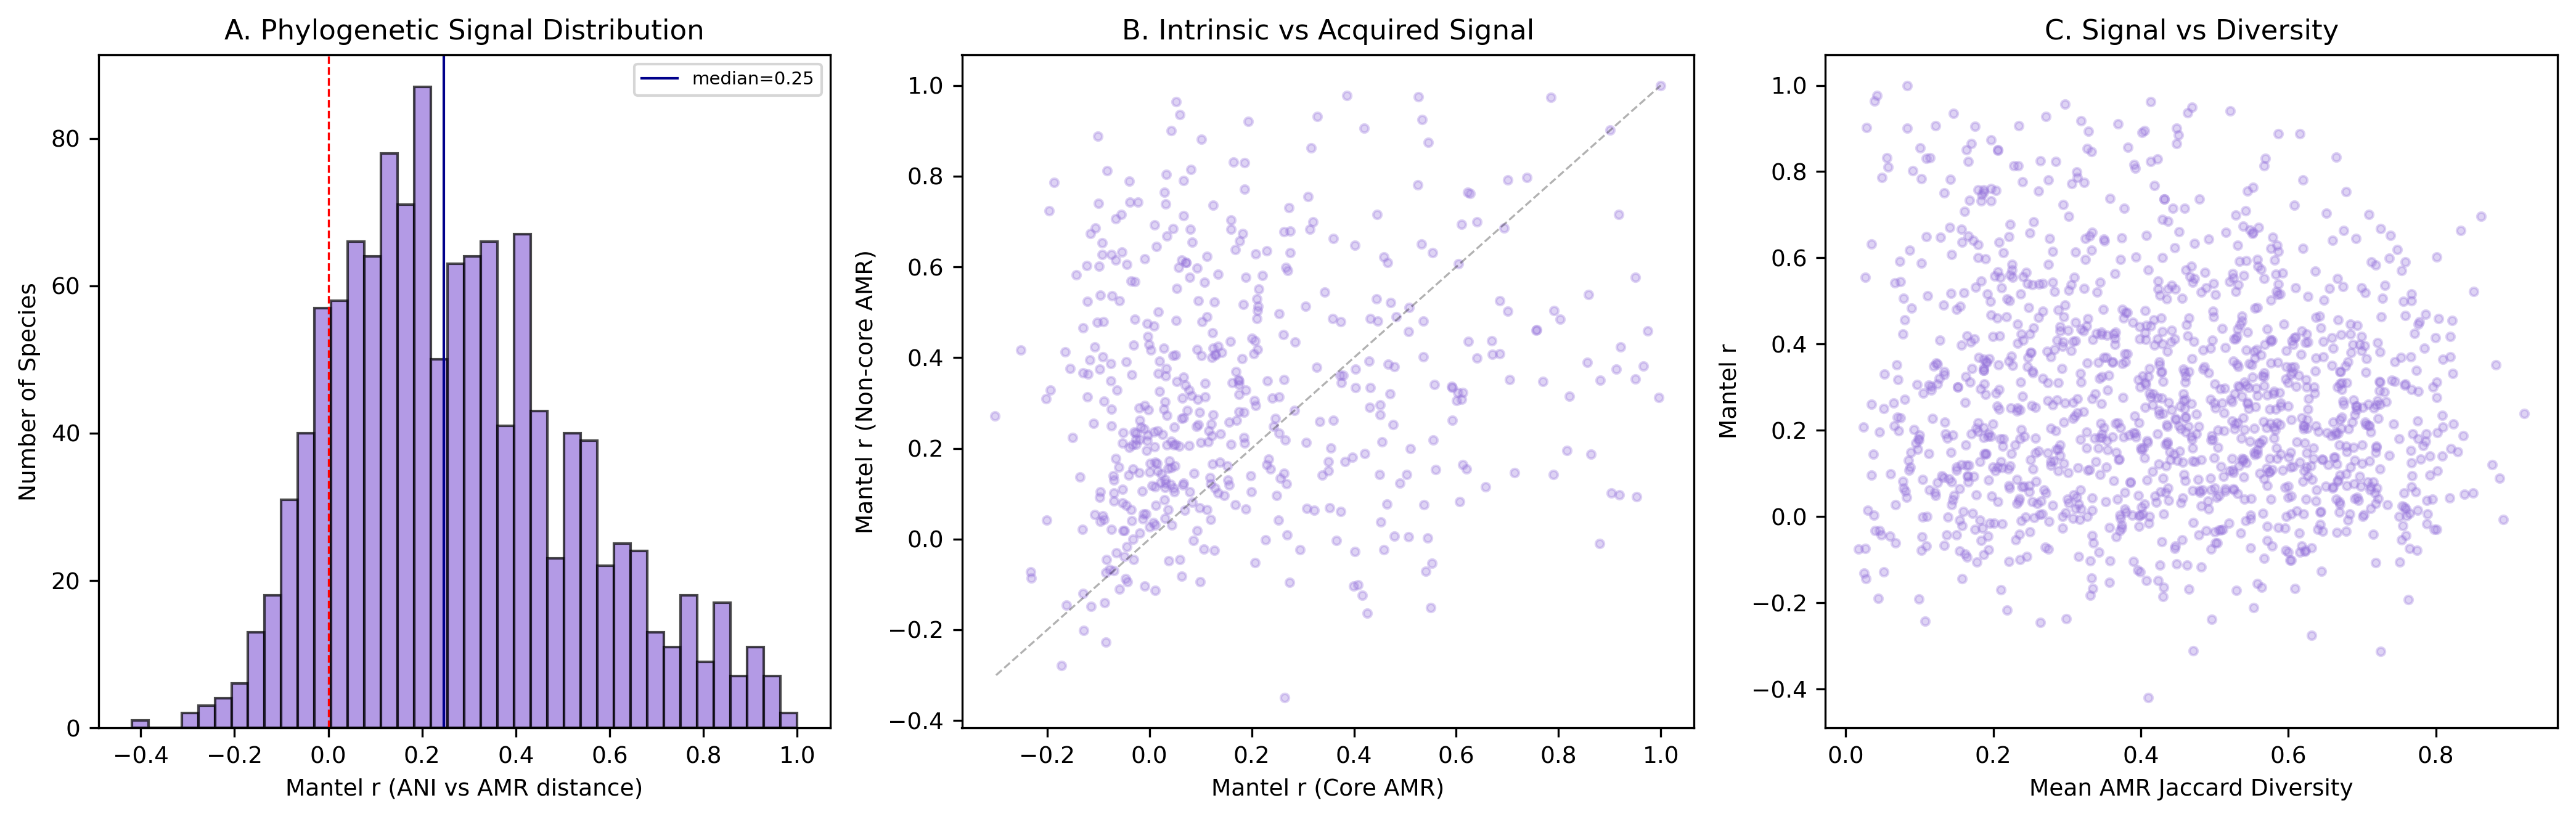
Fig3 Phylogenetic Signal
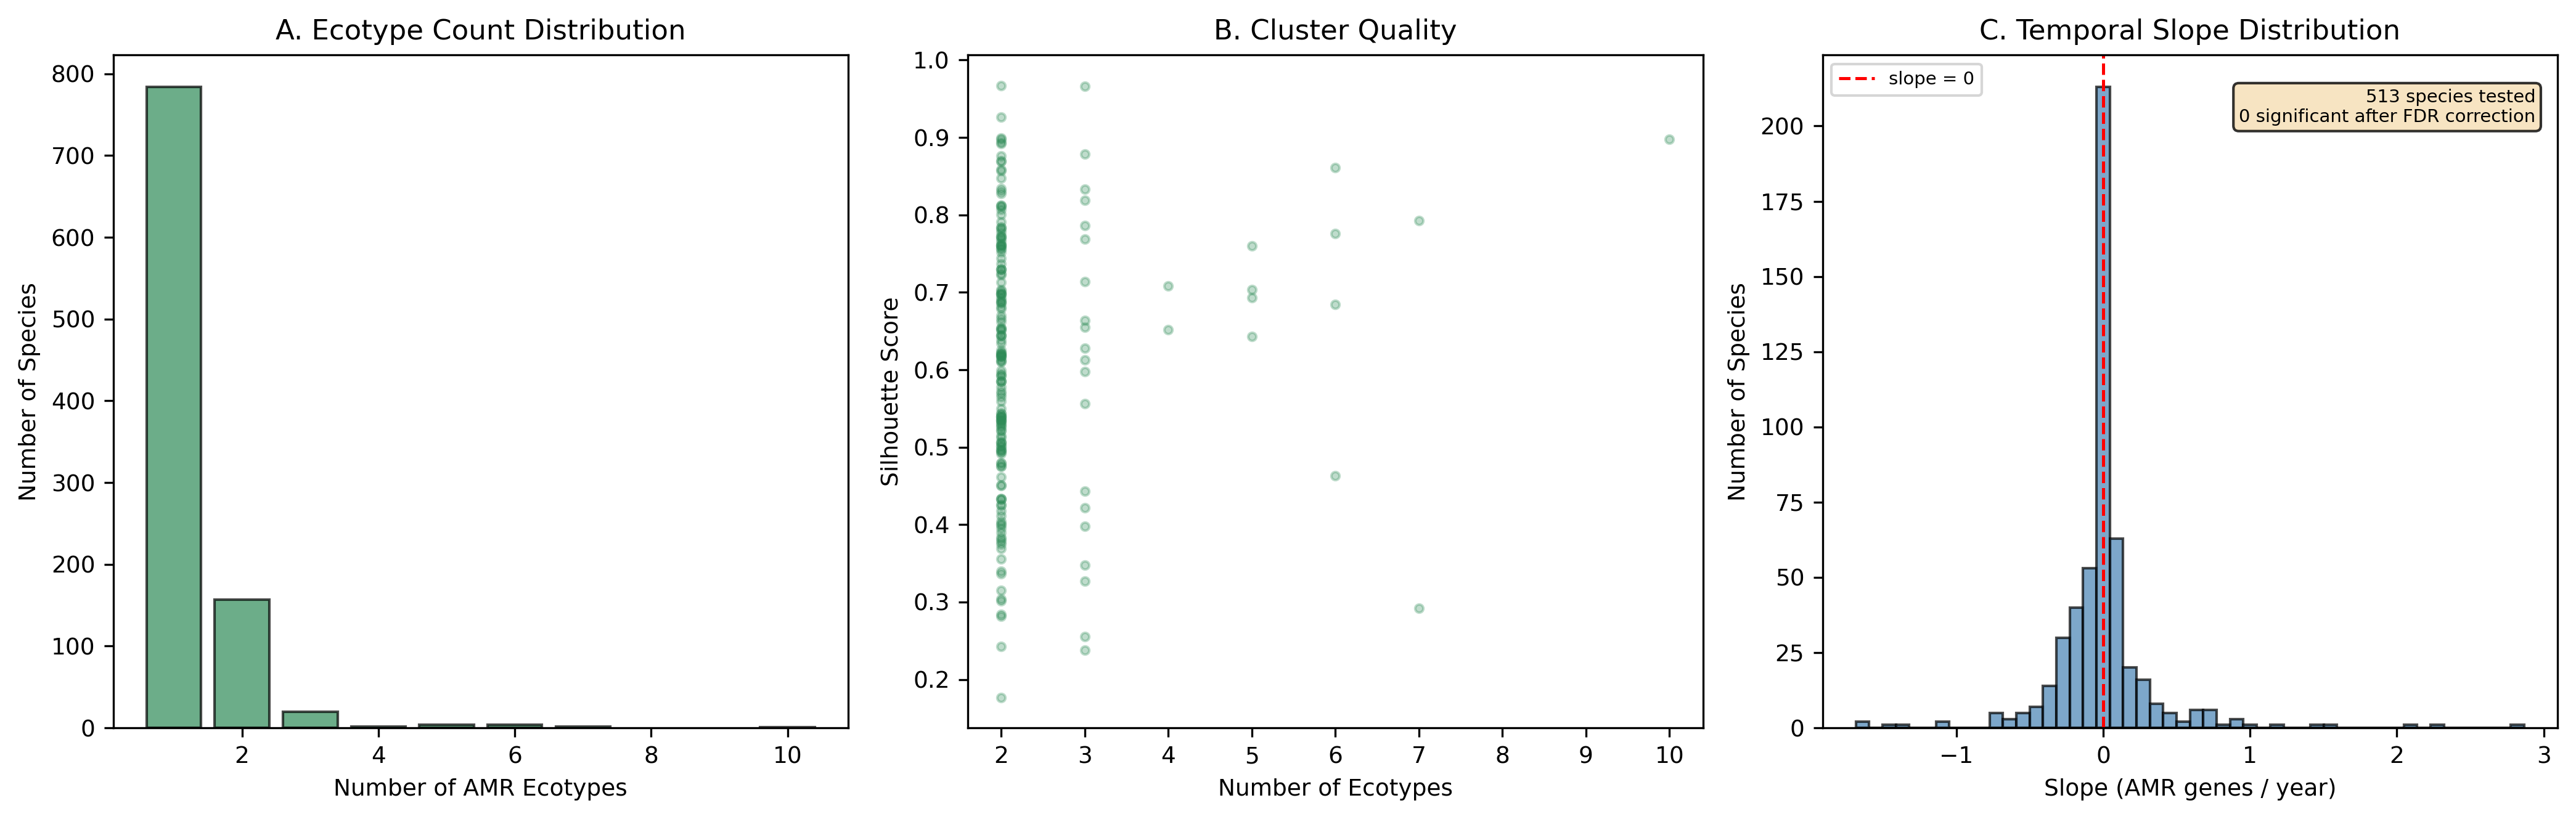
Fig4 Ecotypes Temporal
Nb02 Variation Landscape
Nb03 Cooccurrence
Nb04 Phylogenetic Signal
Nb05 Acinetobacter Baumannii Ecotypes
Nb05 Klebsiella Pneumoniae Ecotypes
Nb05 Pseudomonas Aeruginosa Ecotypes
Nb05 Salmonella Enterica Ecotypes
Nb05 Staphylococcus Aureus Ecotypes
Nb06 Temporal Bacdive
Notebooks
01_data_extraction.ipynb
01 Data Extraction
View notebook →
02_variation_metrics.ipynb
02 Variation Metrics
View notebook →
03_cooccurrence_islands.ipynb
03 Cooccurrence Islands
View notebook →
04_phylogenetic_signal.ipynb
04 Phylogenetic Signal
View notebook →
05_amr_ecotypes.ipynb
05 Amr Ecotypes
View notebook →
06_temporal_bacdive.ipynb
06 Temporal Bacdive
View notebook →
07_synthesis.ipynb
07 Synthesis
View notebook →