ADP1 Triple Essentiality Concordance
In ProgressResearch Question
Among genes that TnSeq says are dispensable in Acinetobacter baylyi ADP1, does FBA correctly predict which ones have growth defects? Can direct mutant growth rate measurements serve as an independent axis to evaluate where computational (FBA) and genetic (TnSeq) methods agree or disagree?
Research Plan
Hypothesis
FBA-essential genes that are TnSeq-dispensable should show measurable growth defects in mutant growth assays, while FBA-blocked (zero flux) genes should not. If this holds, growth measurements validate FBA predictions even when TnSeq disagrees. If it doesn't, the discordance reveals systematic biases in one or both computational/genetic approaches.
Approach
Phase 1: Data Assembly (NB01)
- Load
genome_featuresfrom SQLite — extract TnSeq essentiality, FBA class, mutant growth rates, annotations - Define the triple-covered gene set: genes with TnSeq + FBA + any growth measurement (~478 genes)
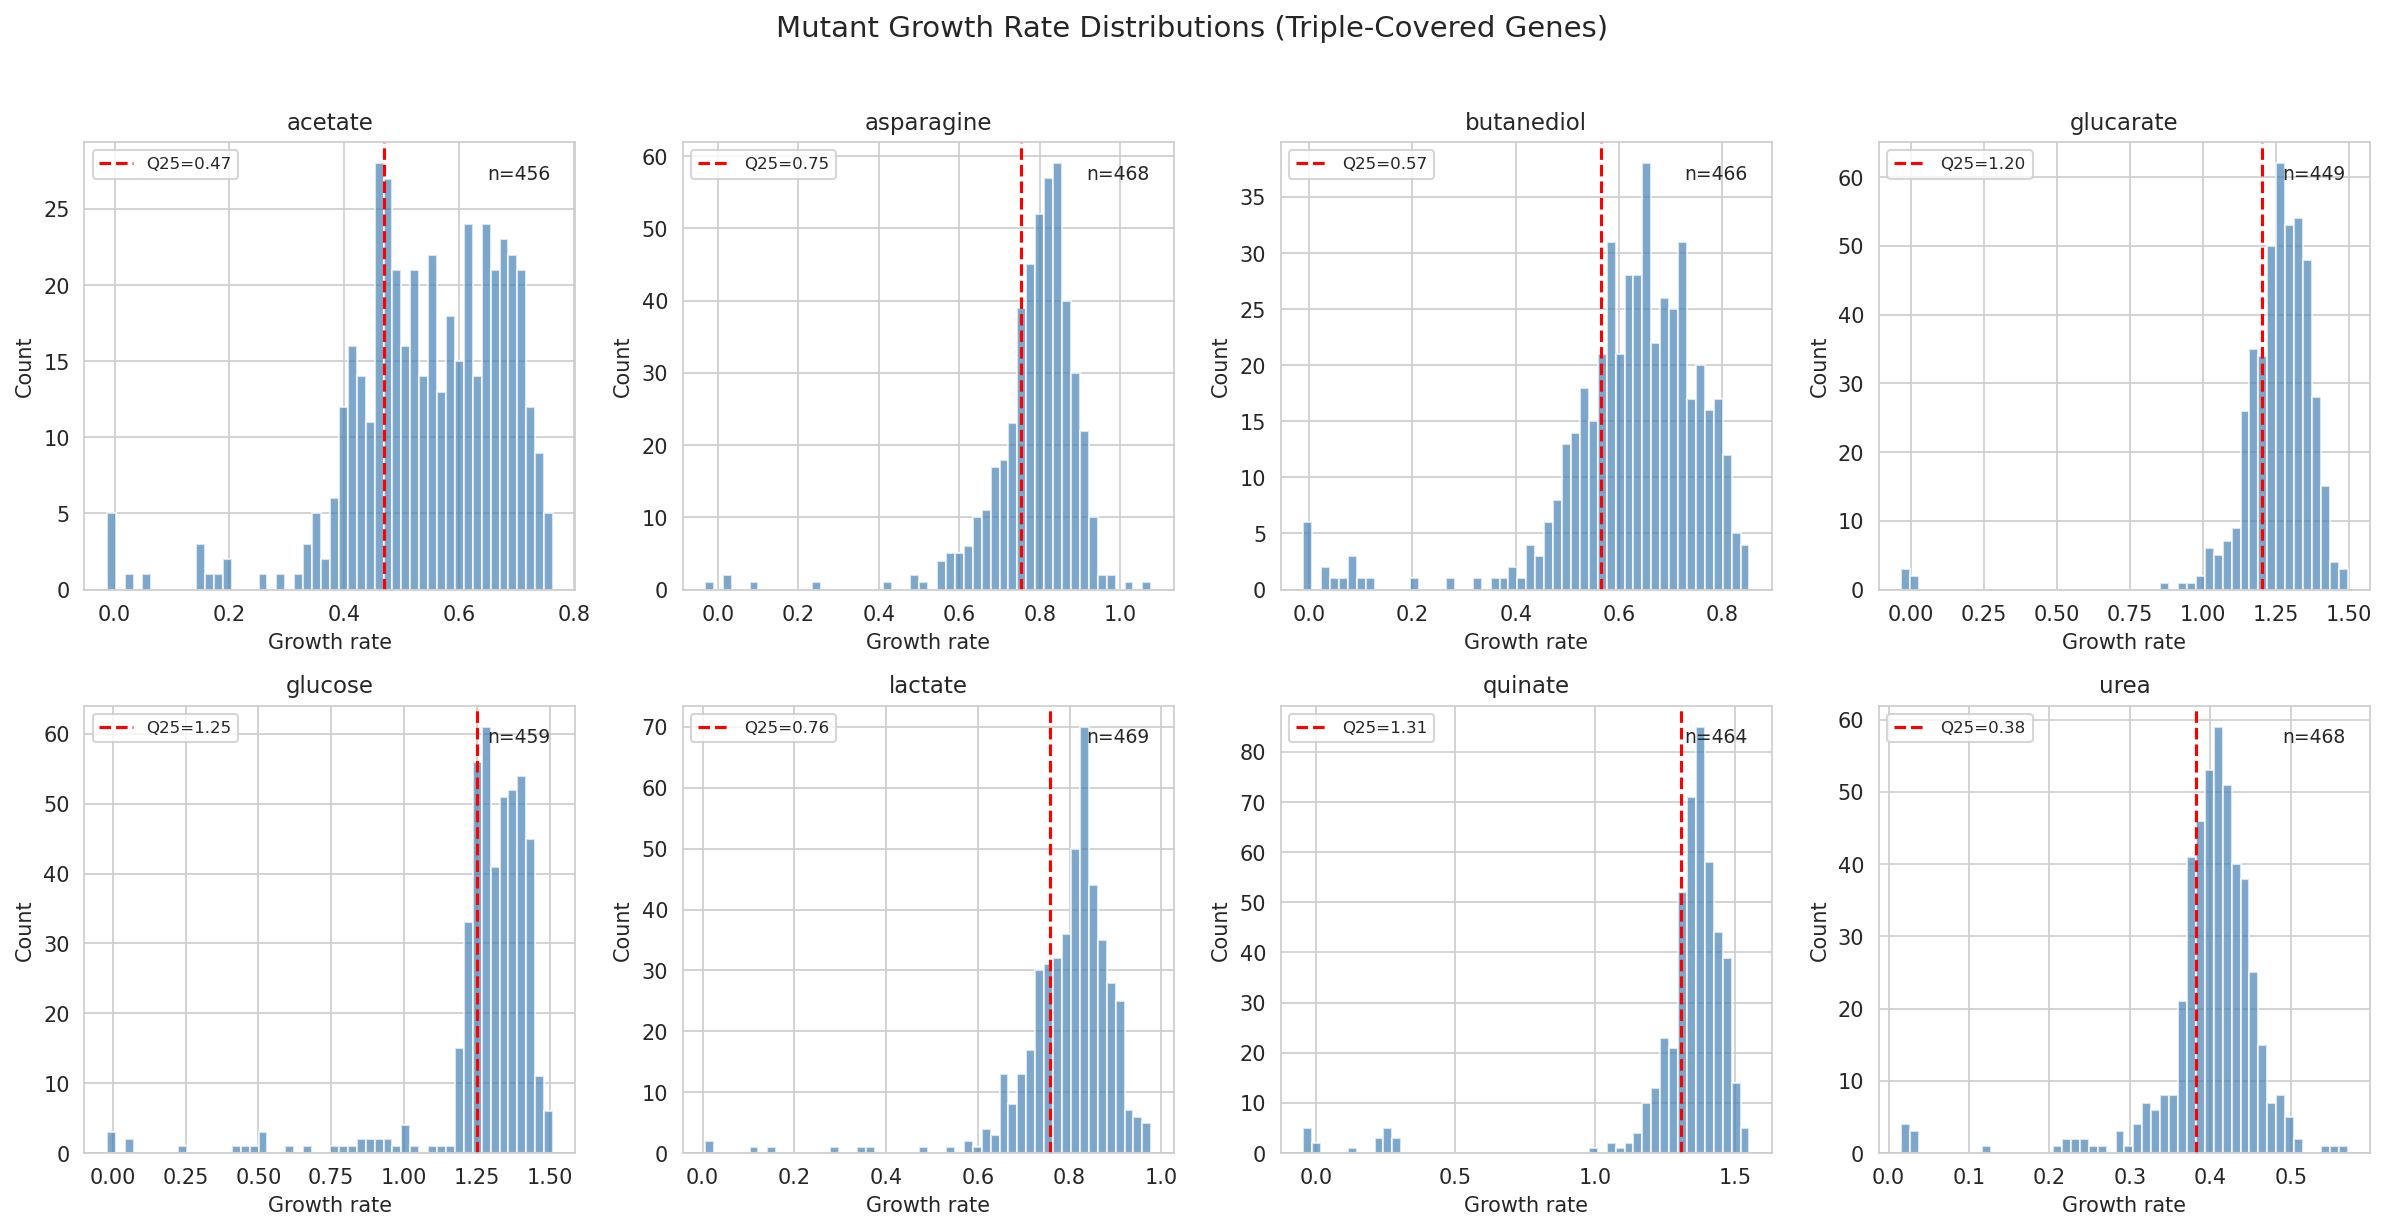
- Define growth defect thresholds per condition using condition-specific distributions
- Create binary "growth_important" flags per condition
- Load
gene_phenotypesfor per-condition FBA flux predictions, join to triple table - Join pangenome annotations via
cluster_id_mapping.csv - Save assembled table to
data/triple_gene_table.csv
Phase 2: Concordance Analysis (NB02)
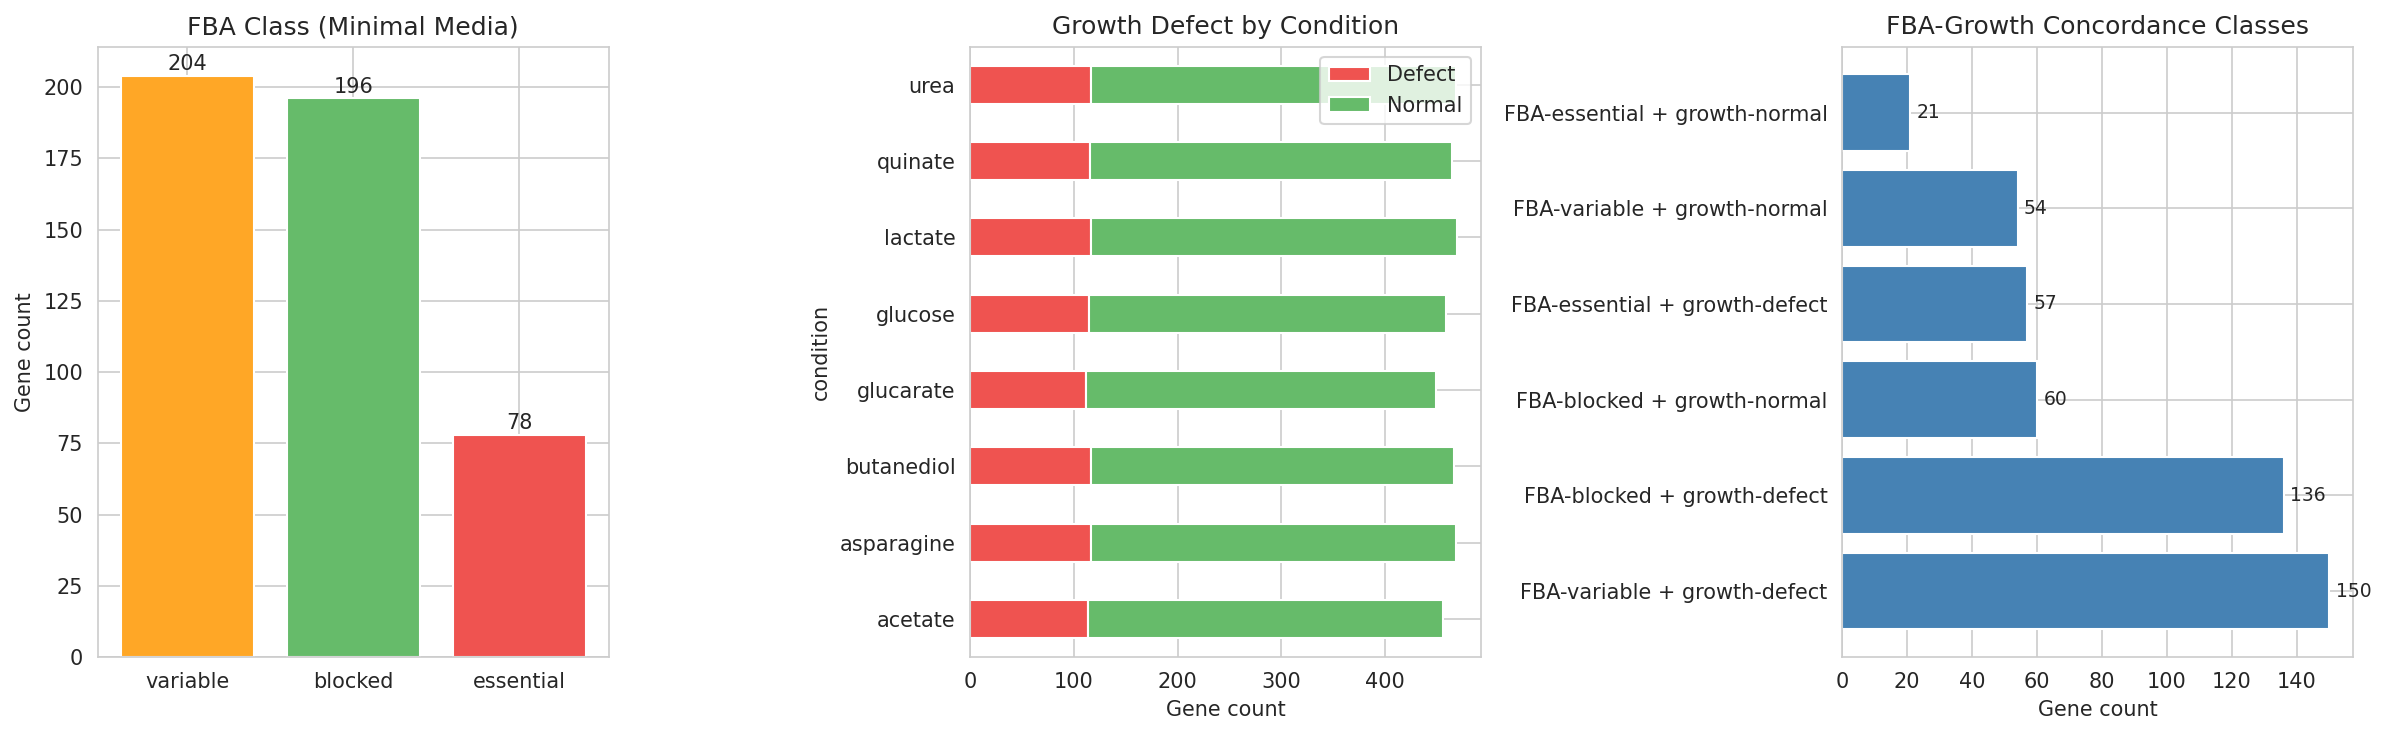
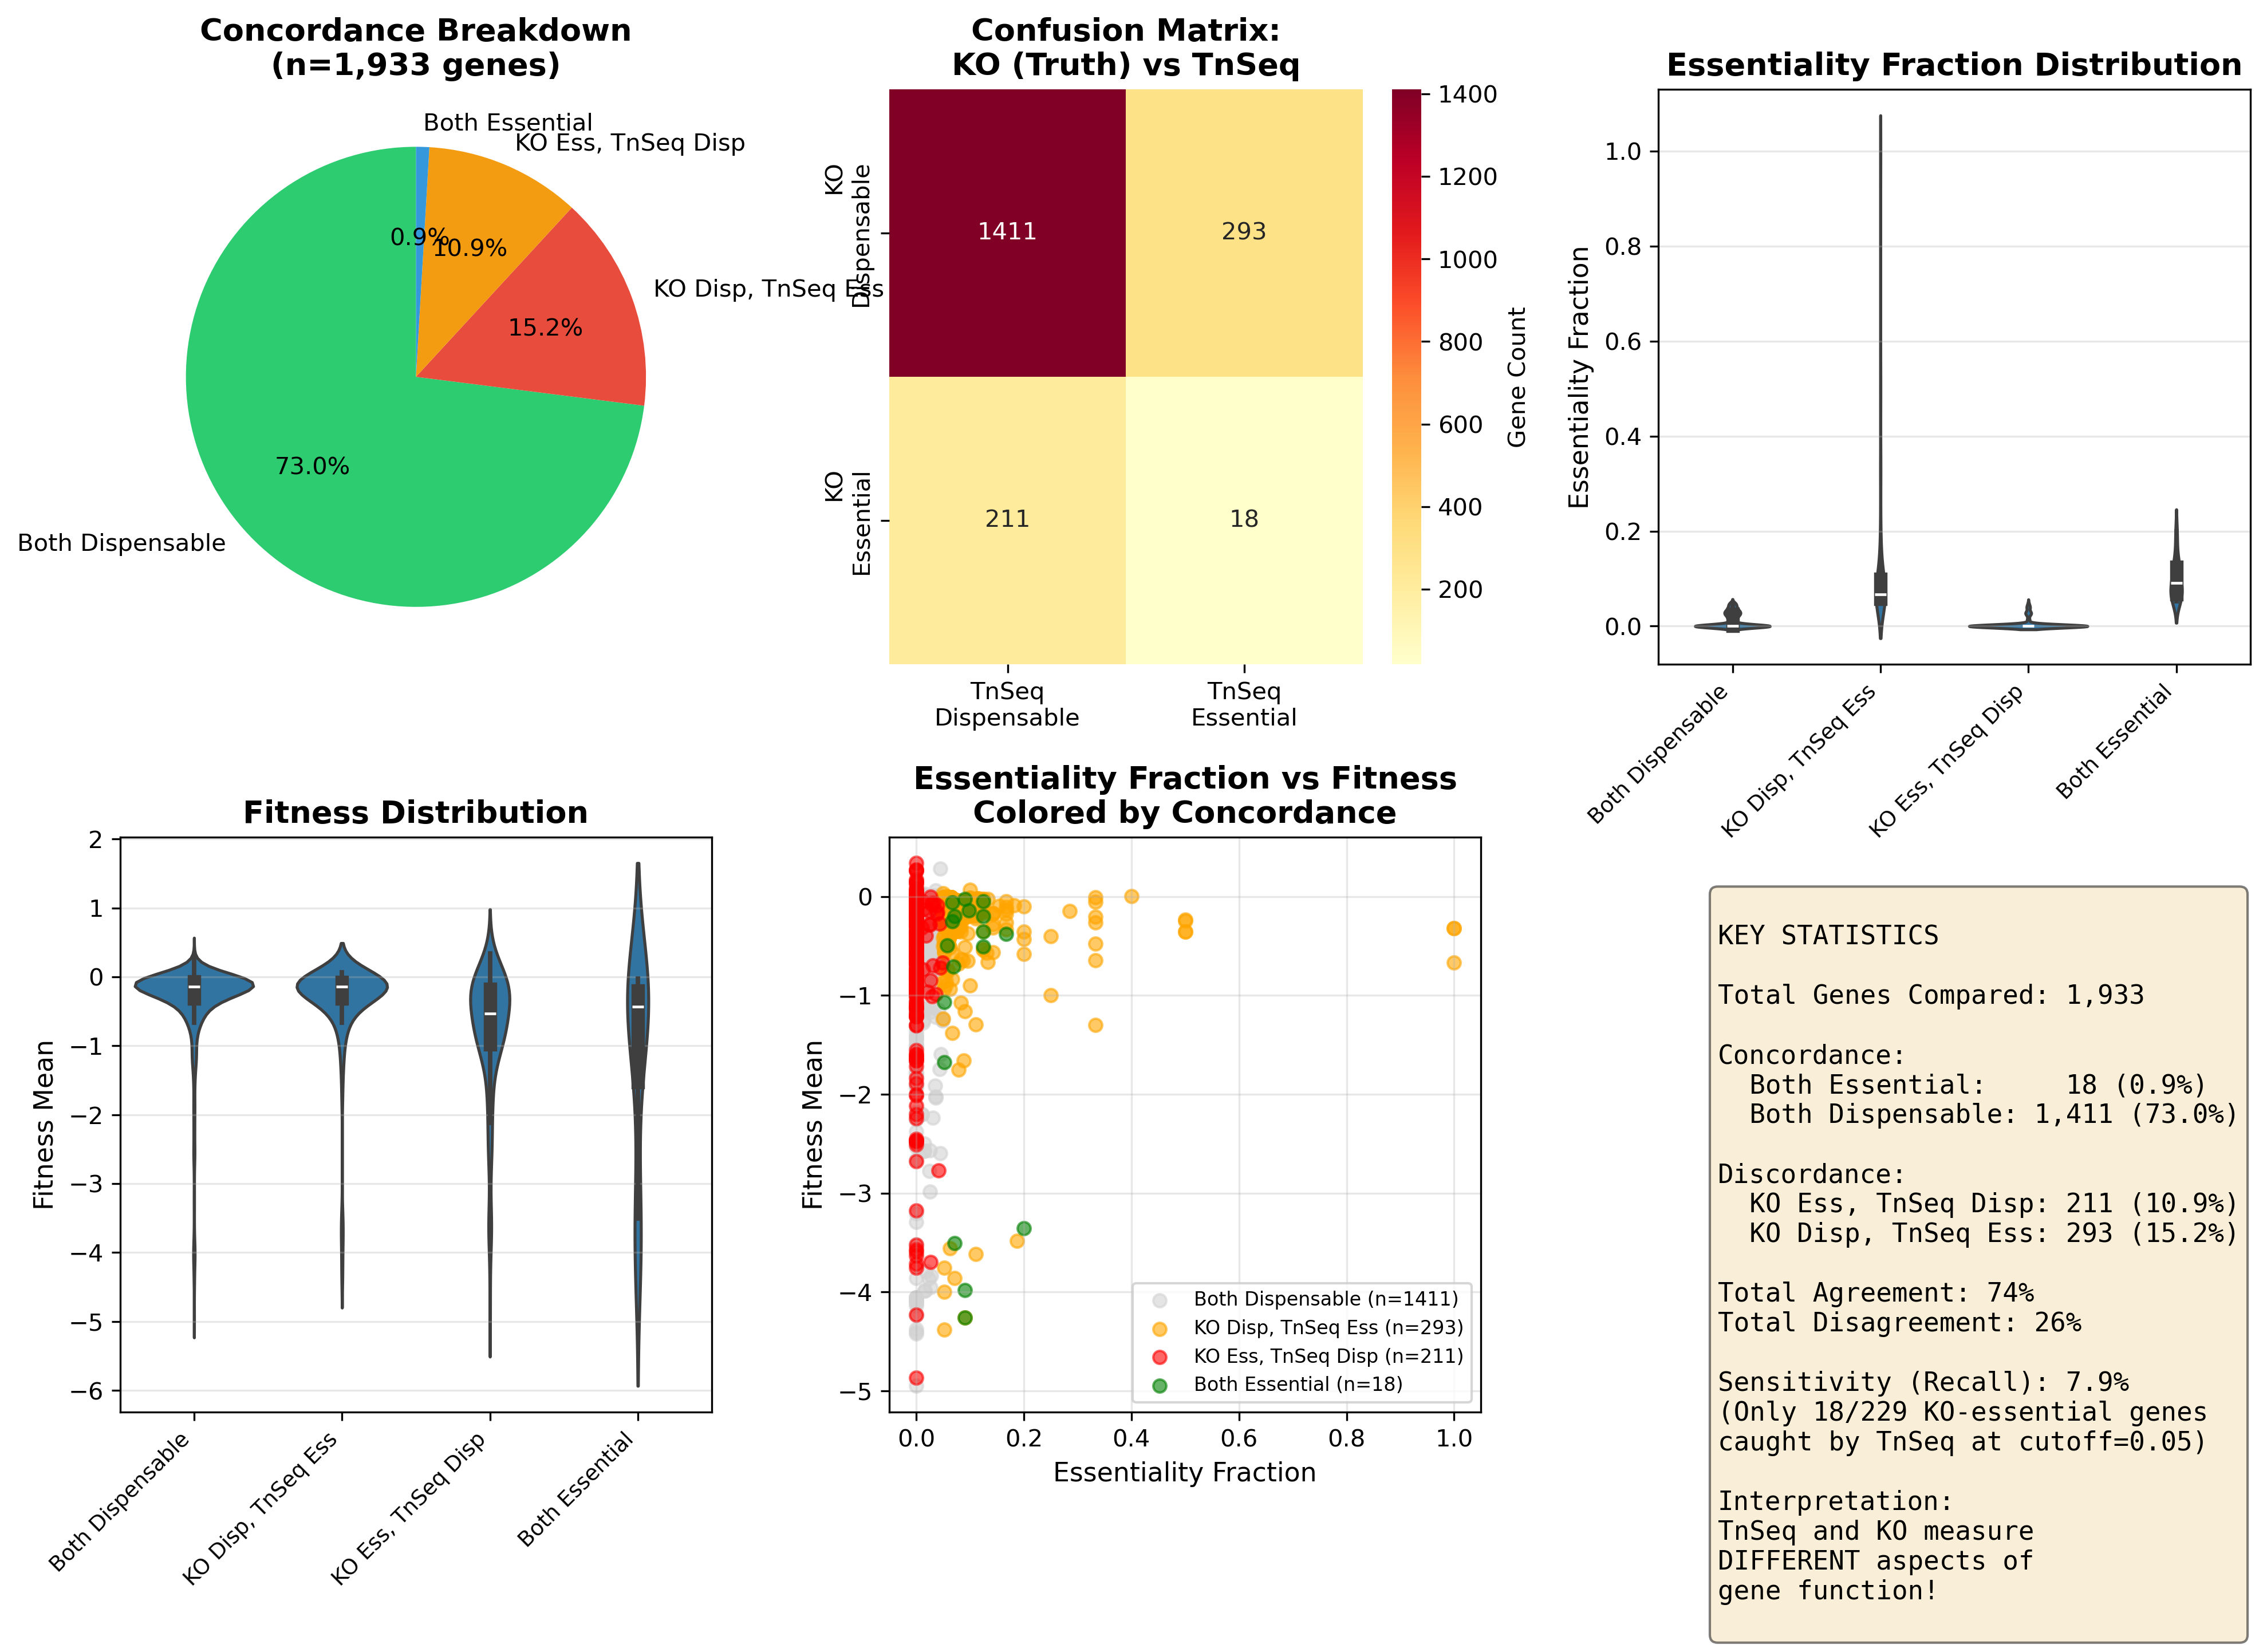
- Triple concordance matrix: Cross-tabulate FBA class x growth defect status; compute Cohen's kappa for FBA-essential vs growth-defect agreement
- Growth as tie-breaker: For FBA-TnSeq discordant genes, test whether mutants show growth defects (FBA-essential/TnSeq-dispensable) or grow normally (FBA-blocked/TnSeq-dispensable)
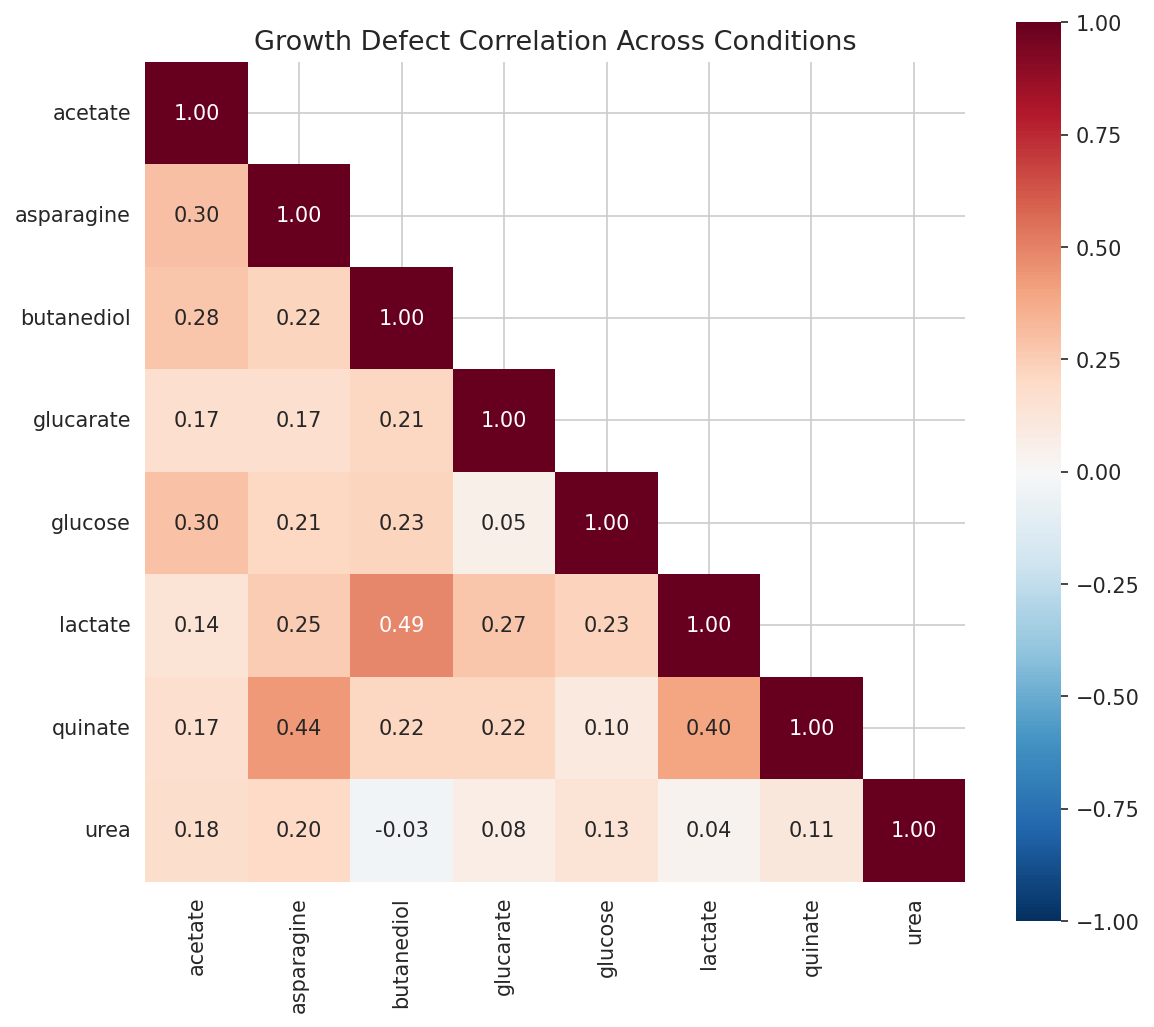
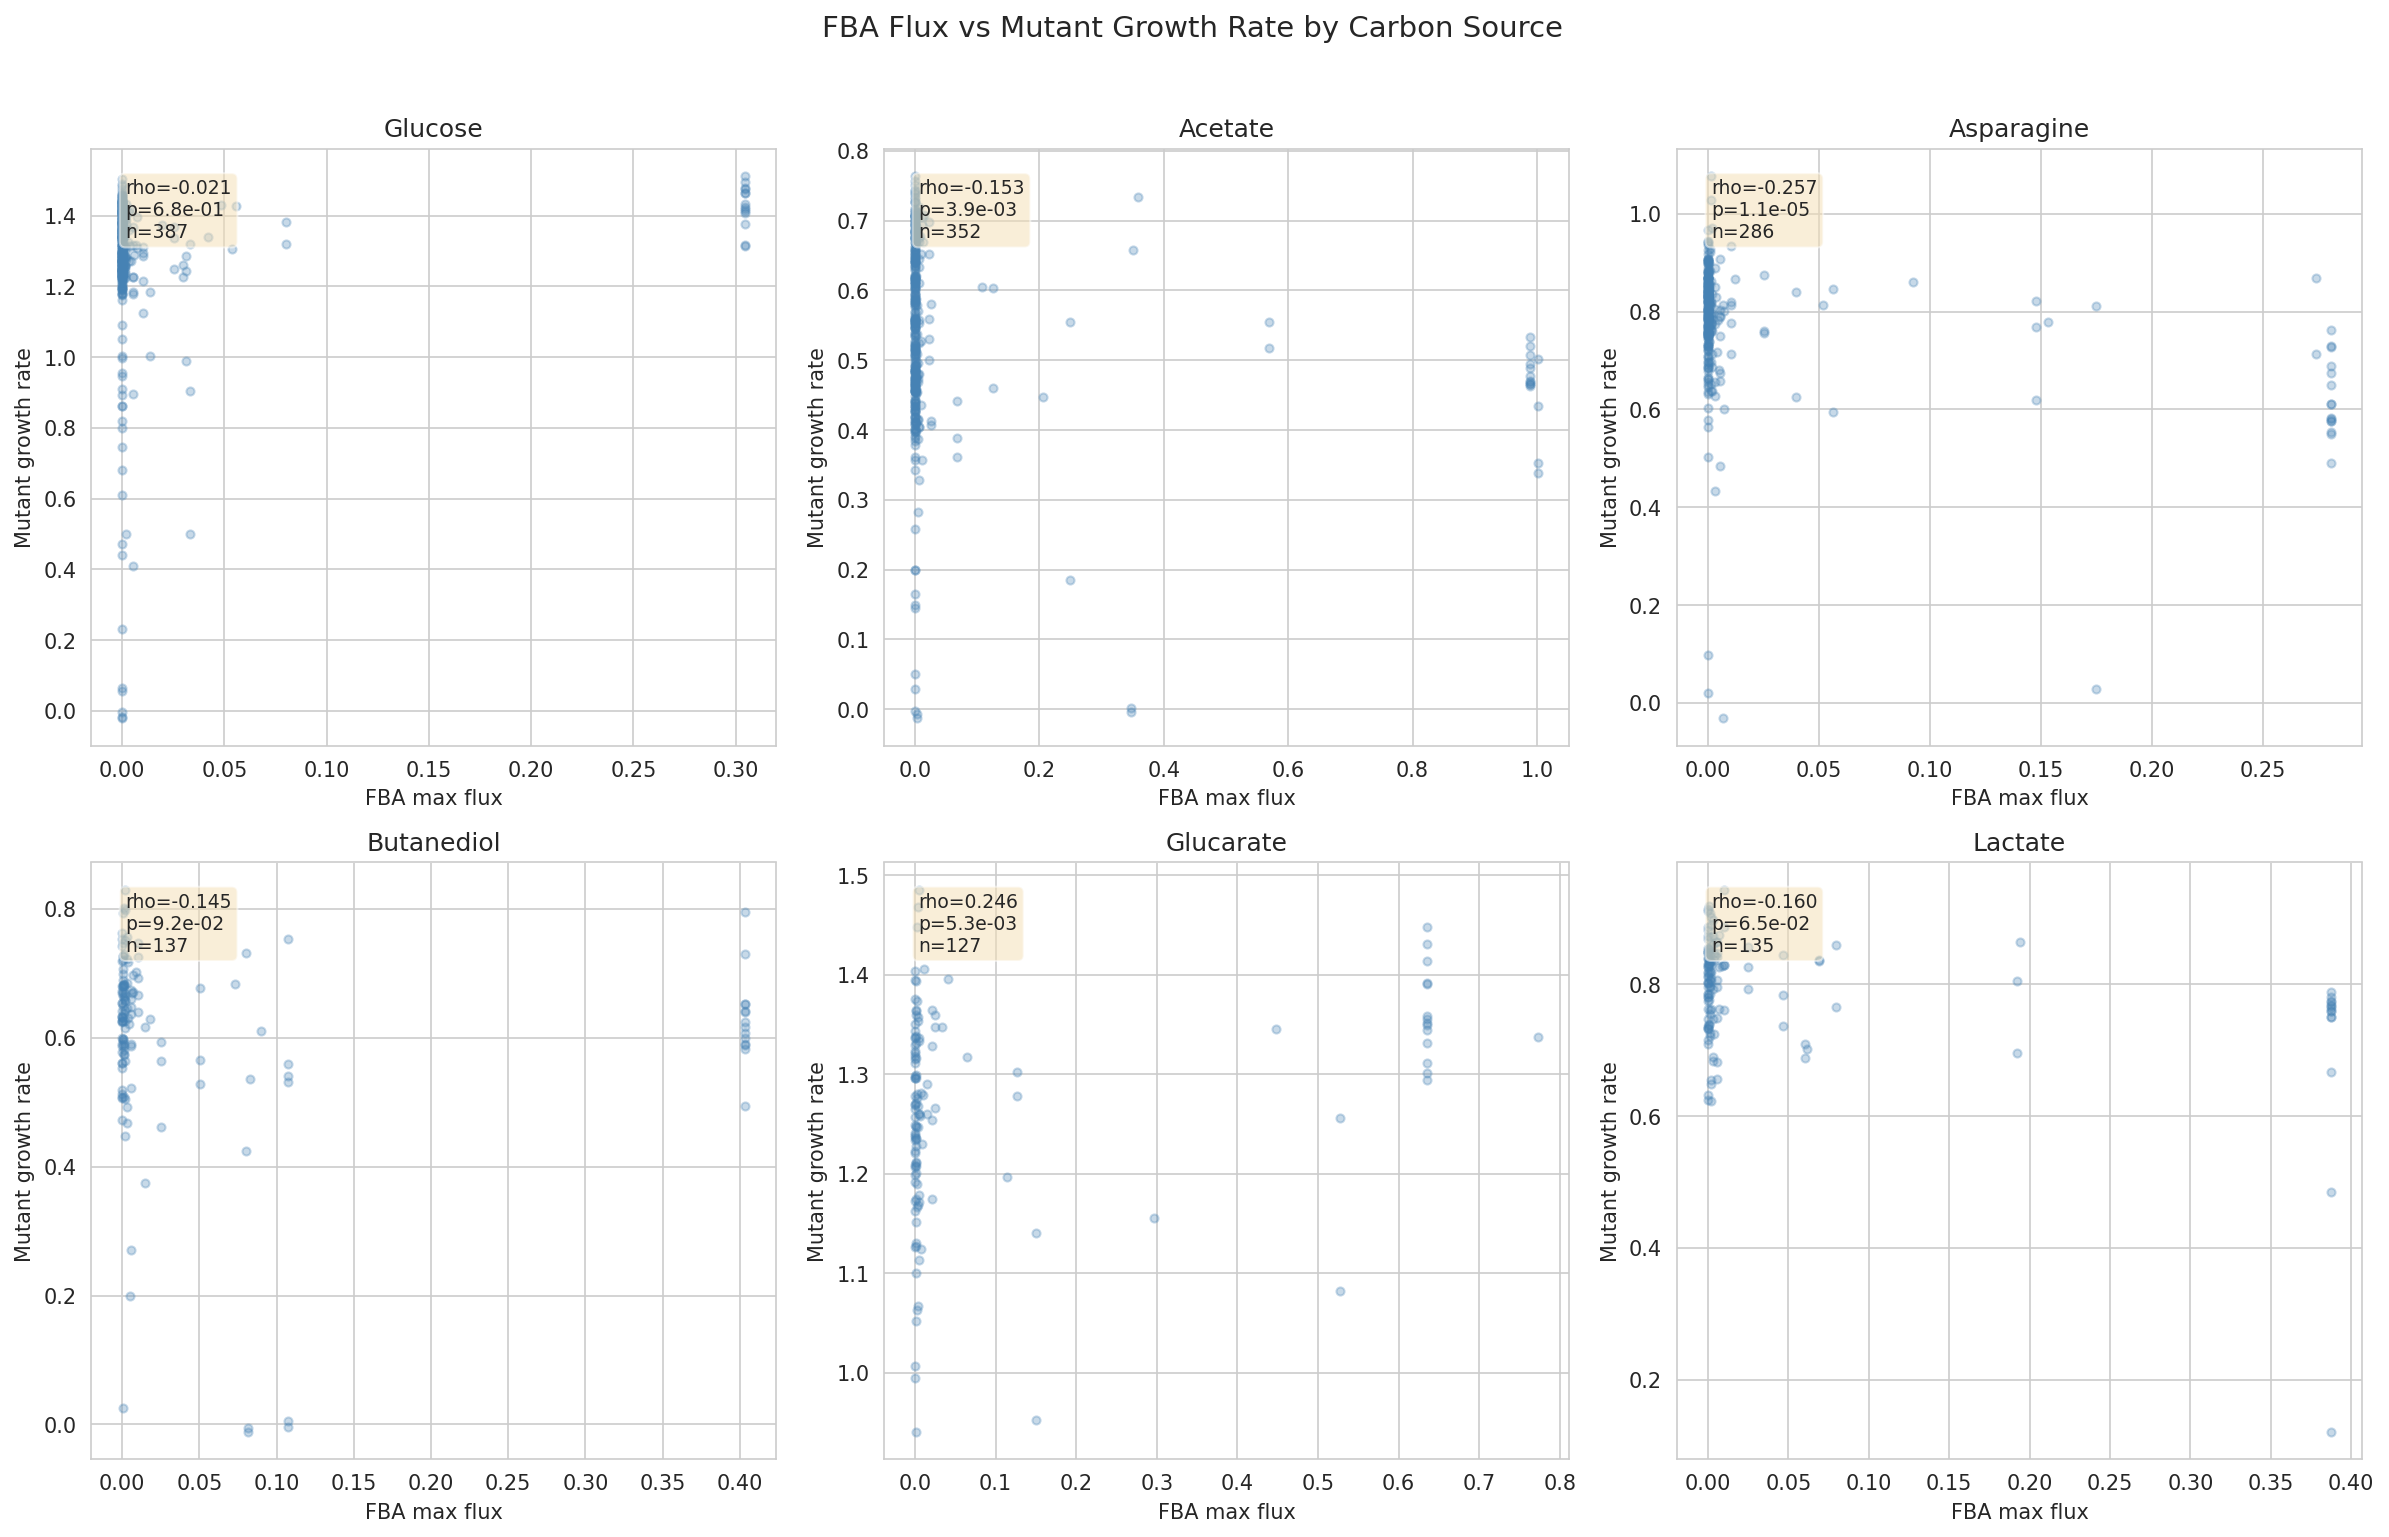
- Condition-specificity: For 6 matched conditions, scatter FBA flux vs growth rate; compute Spearman correlations; identify which conditions show best/worst agreement
Phase 3: Discordant Characterization (NB03)
- Define discordance classes (FBA-essential+growth-normal, FBA-blocked+growth-defect, etc.)
- COG category enrichment via Fisher's exact test
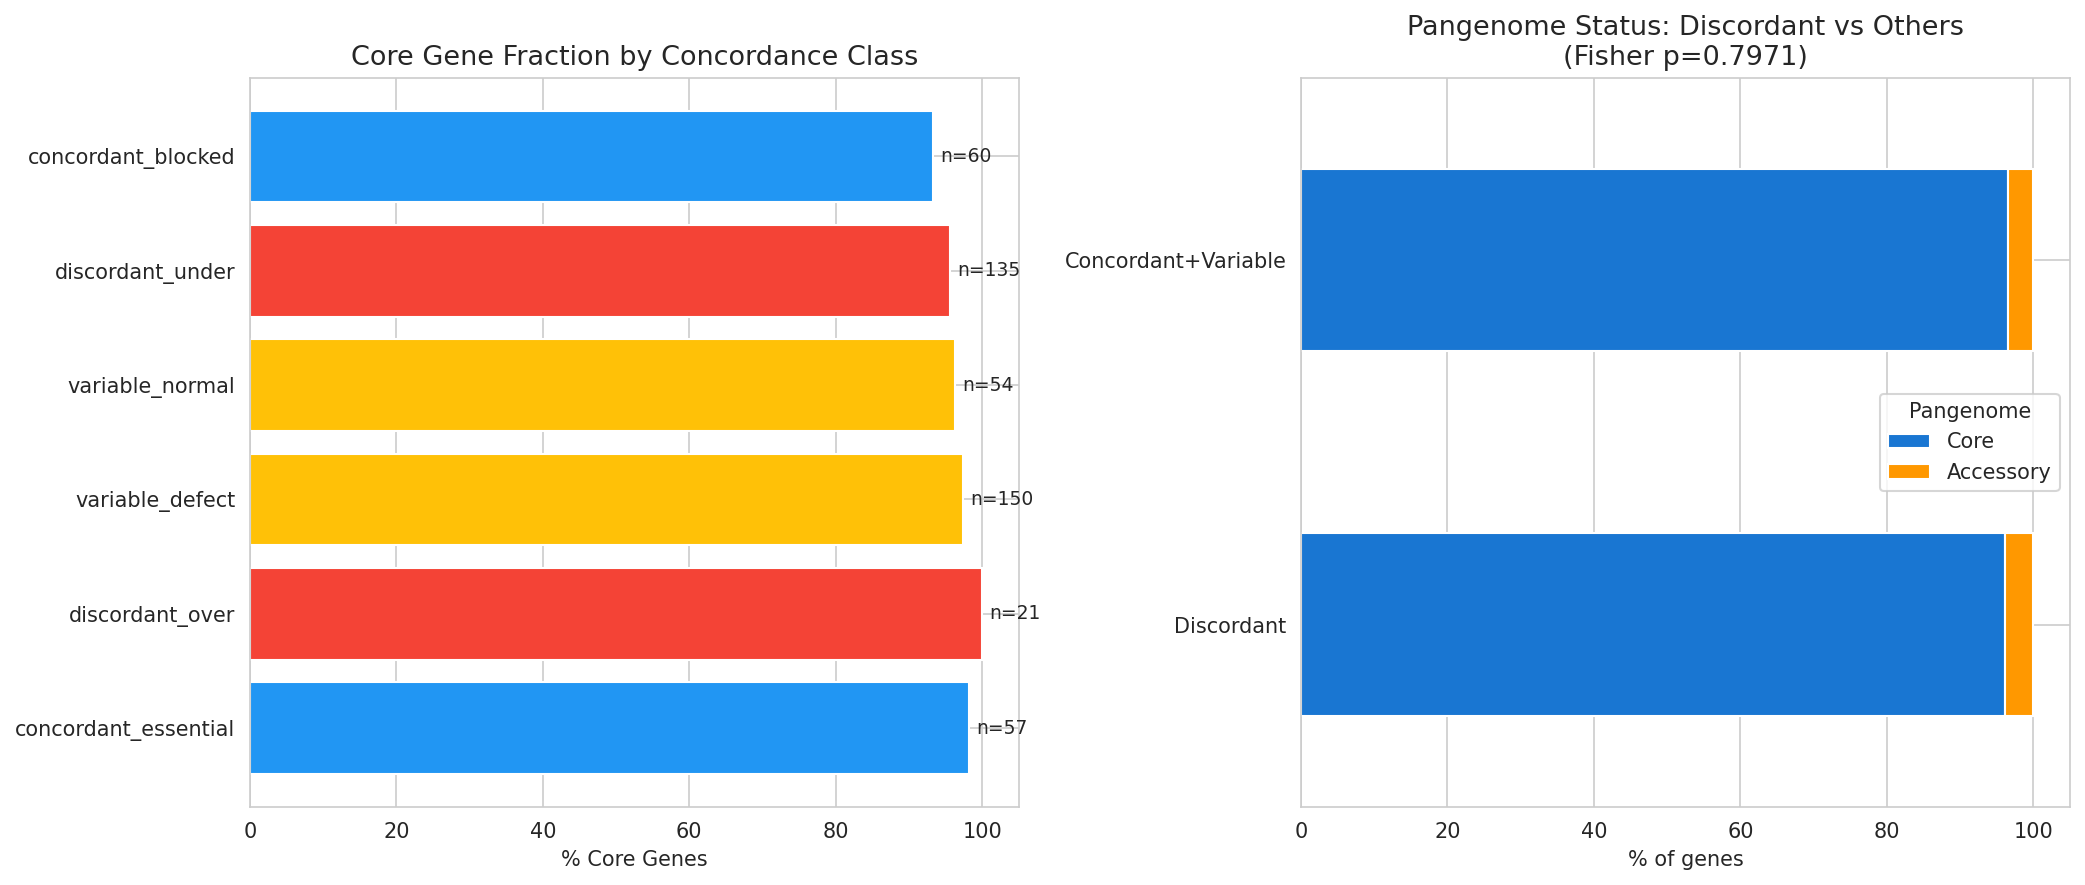
- Pangenome status (core vs accessory) of discordant genes
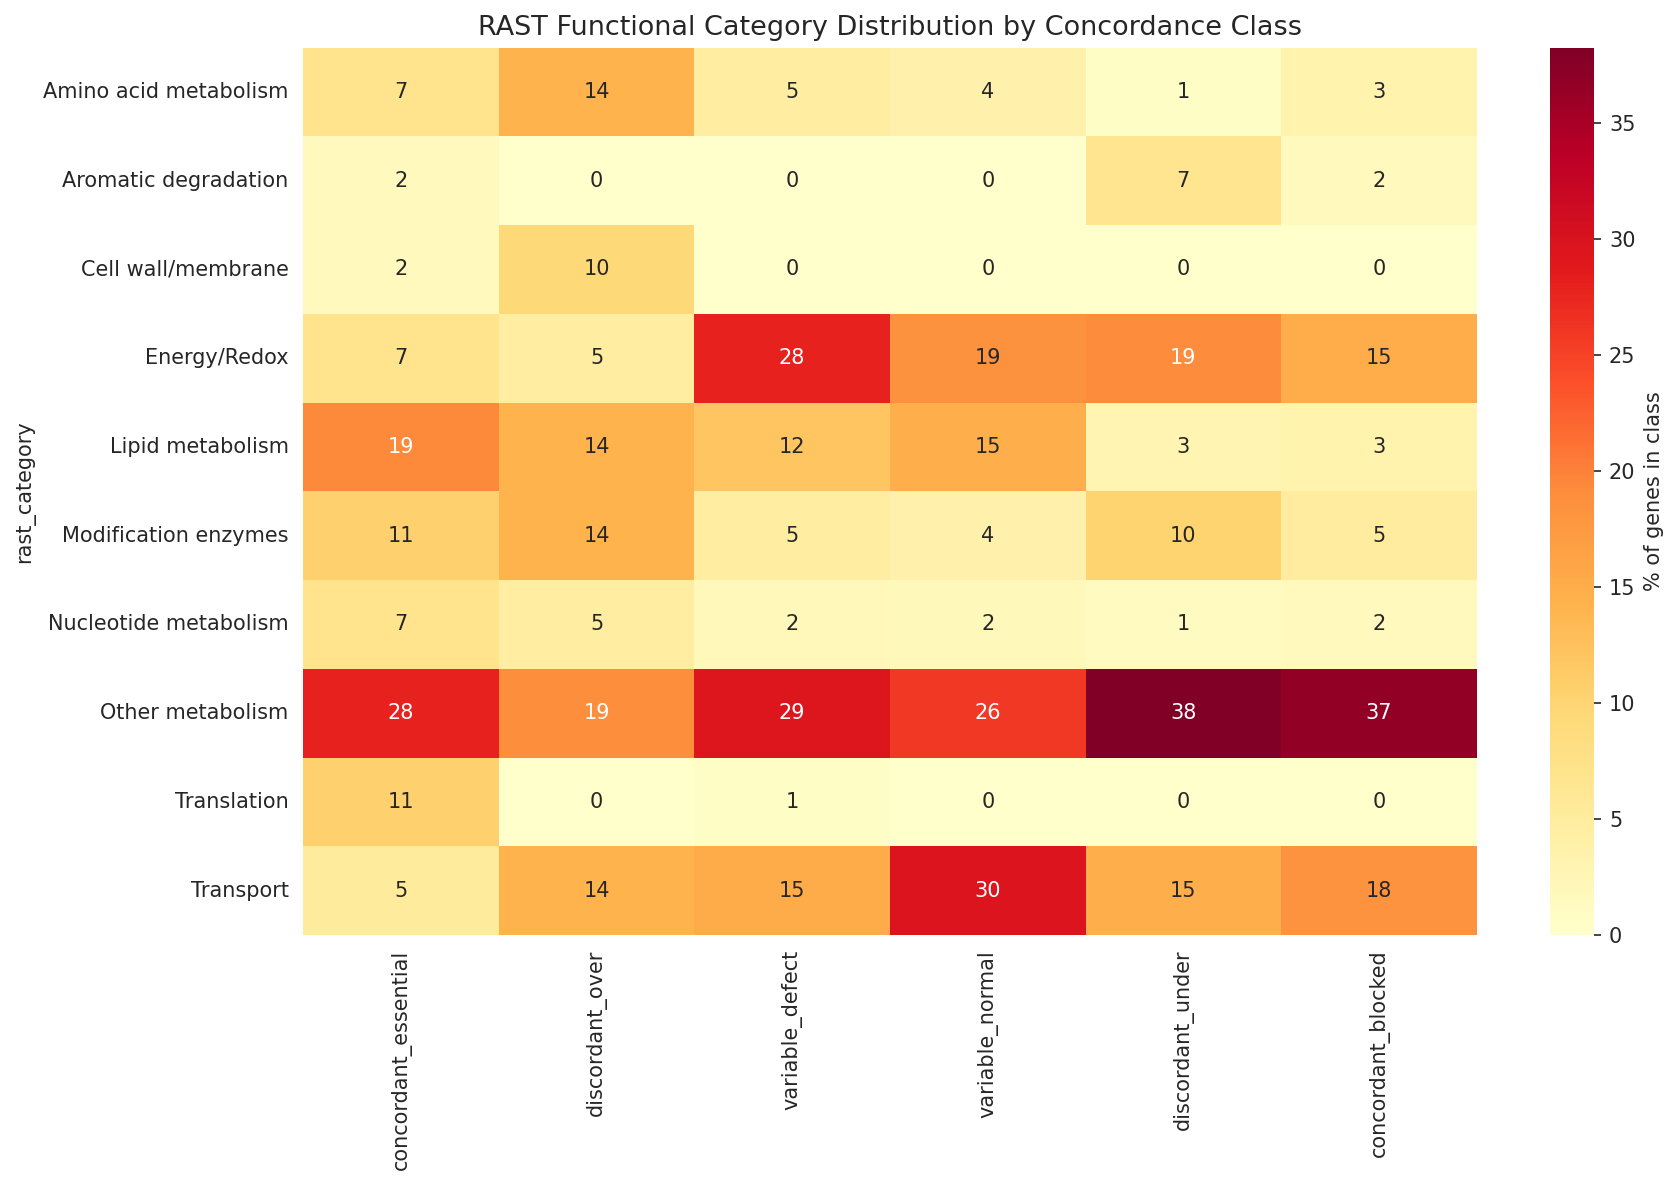
- Functional annotation clustering by KEGG pathway and RAST function
Revision History
- v1 (2026-02-18): Initial plan
Overview
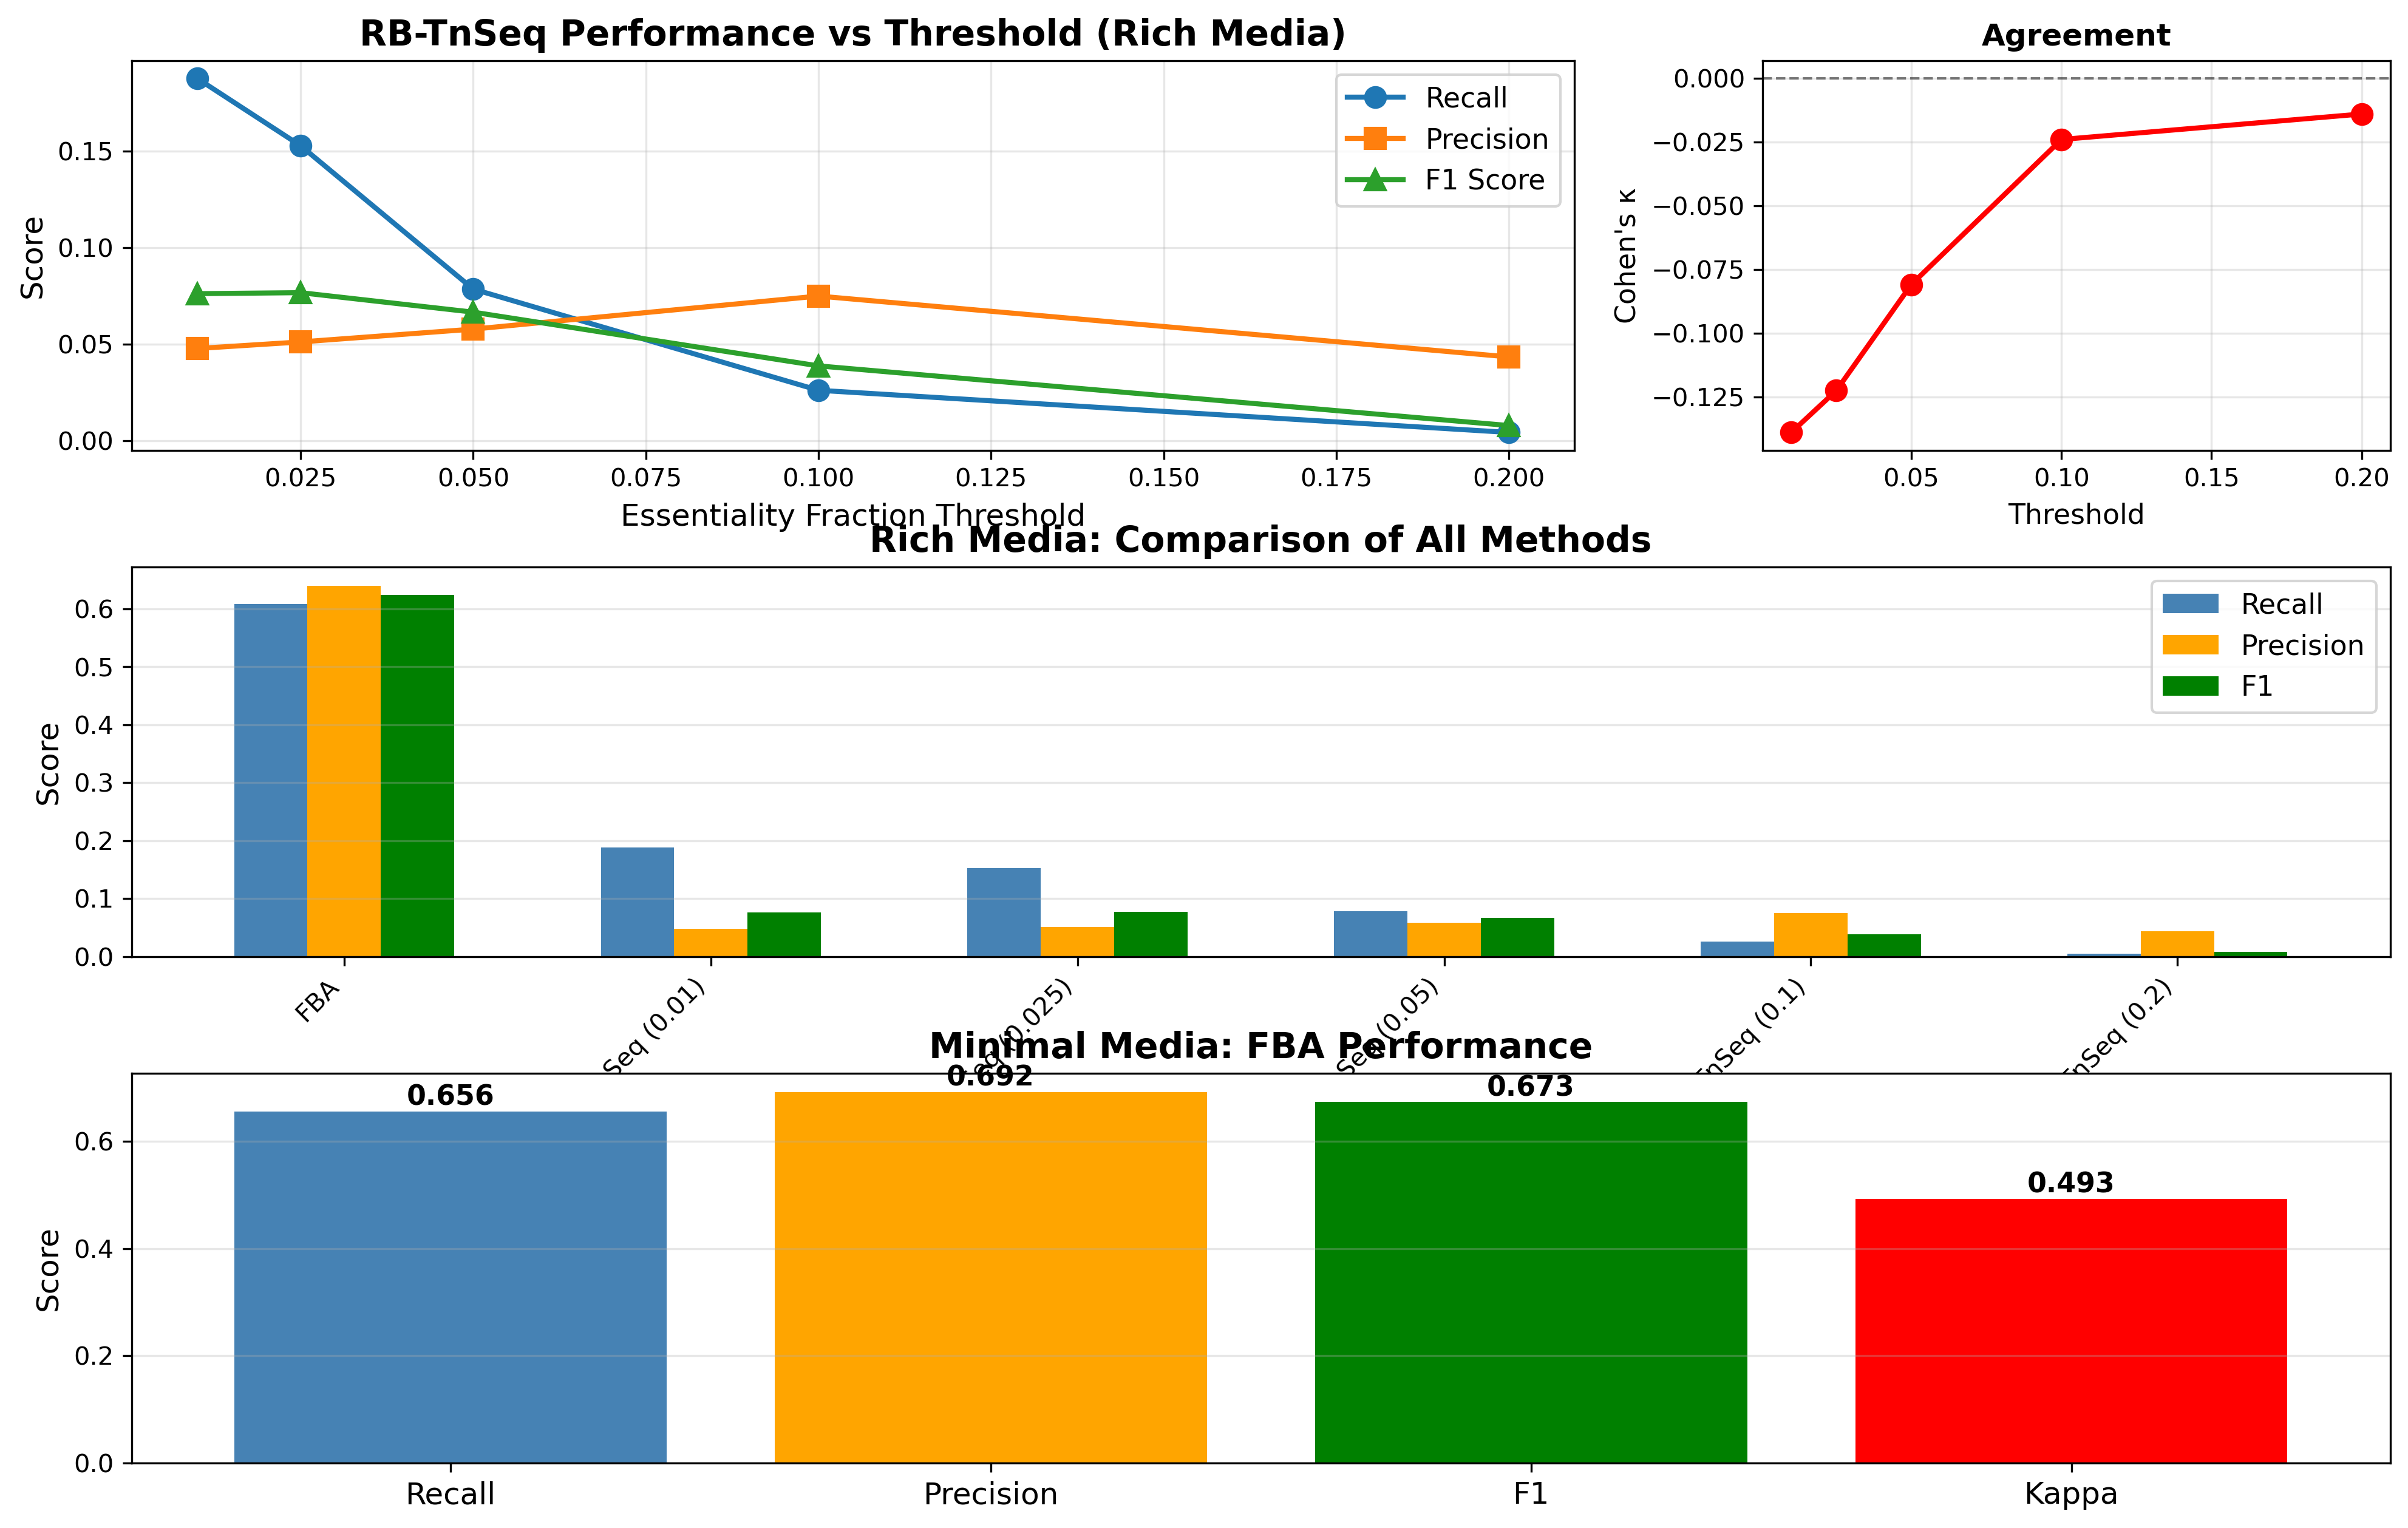
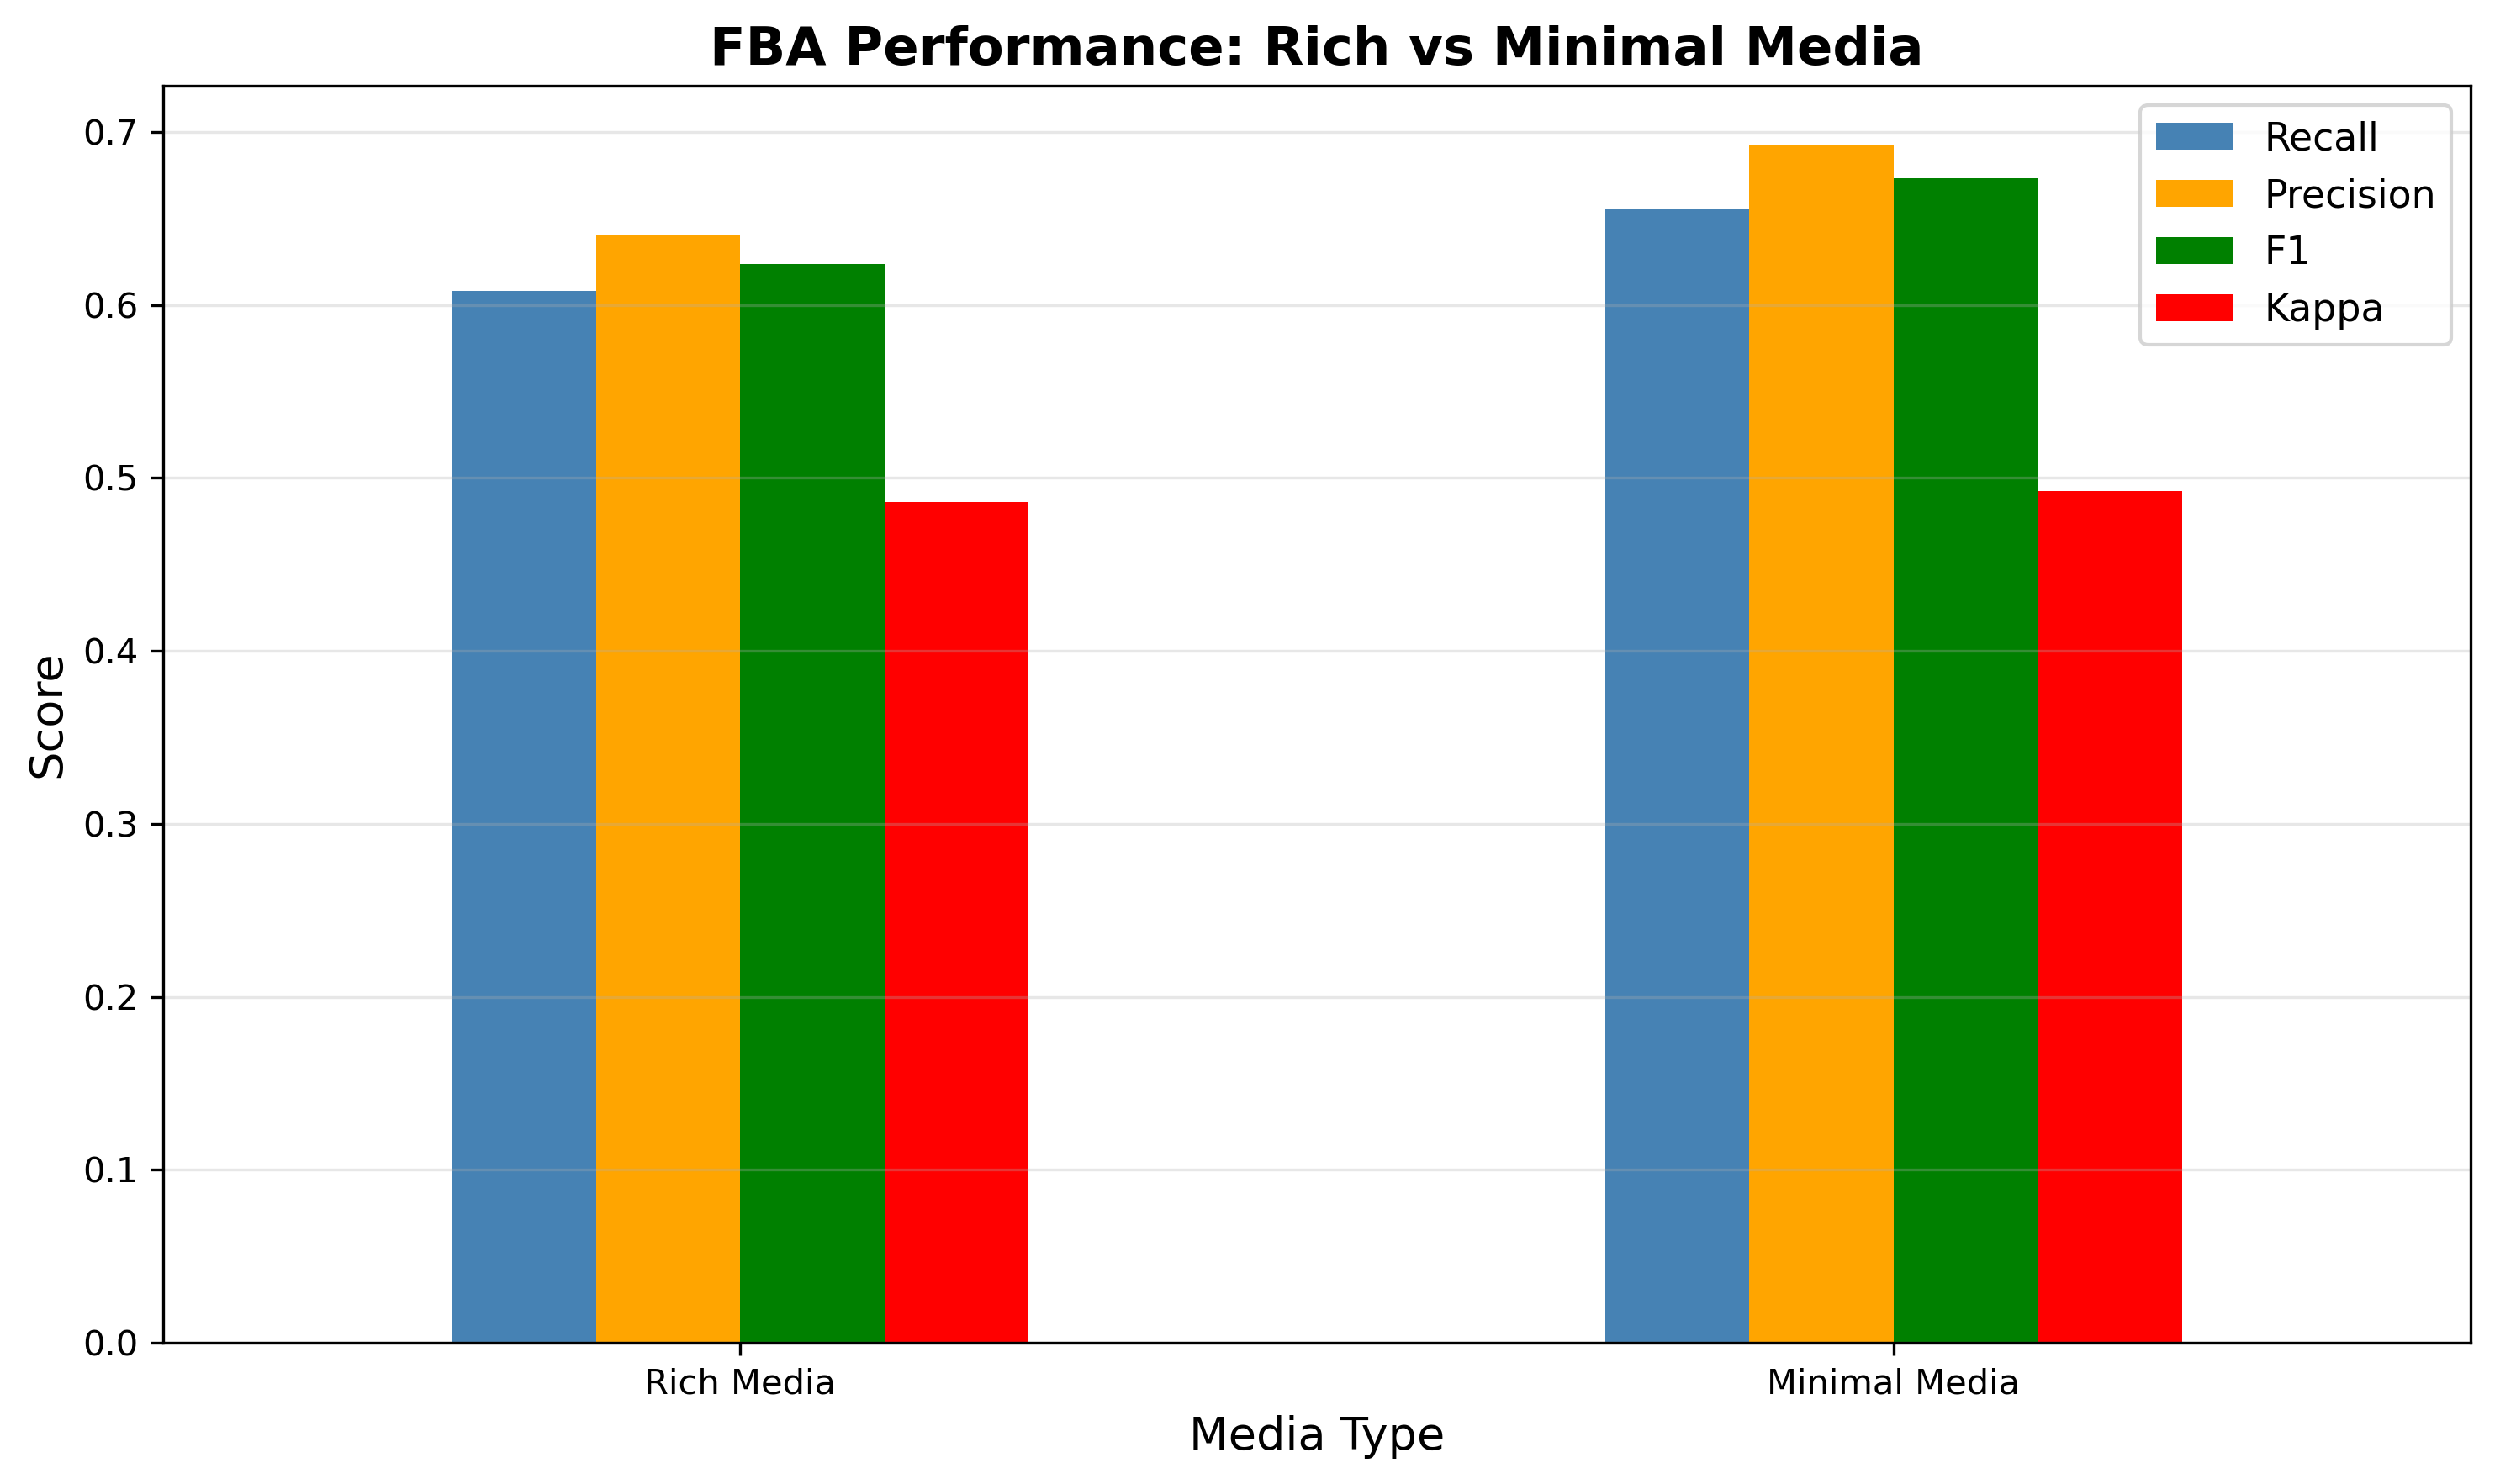
The acinetobacter_adp1_explorer project found 74% concordance between FBA and TnSeq essentiality for ADP1, but never incorporated the mutant growth rate data as a third axis. This project adds mutant growth rates on 8 carbon sources as an independent experimental measure.
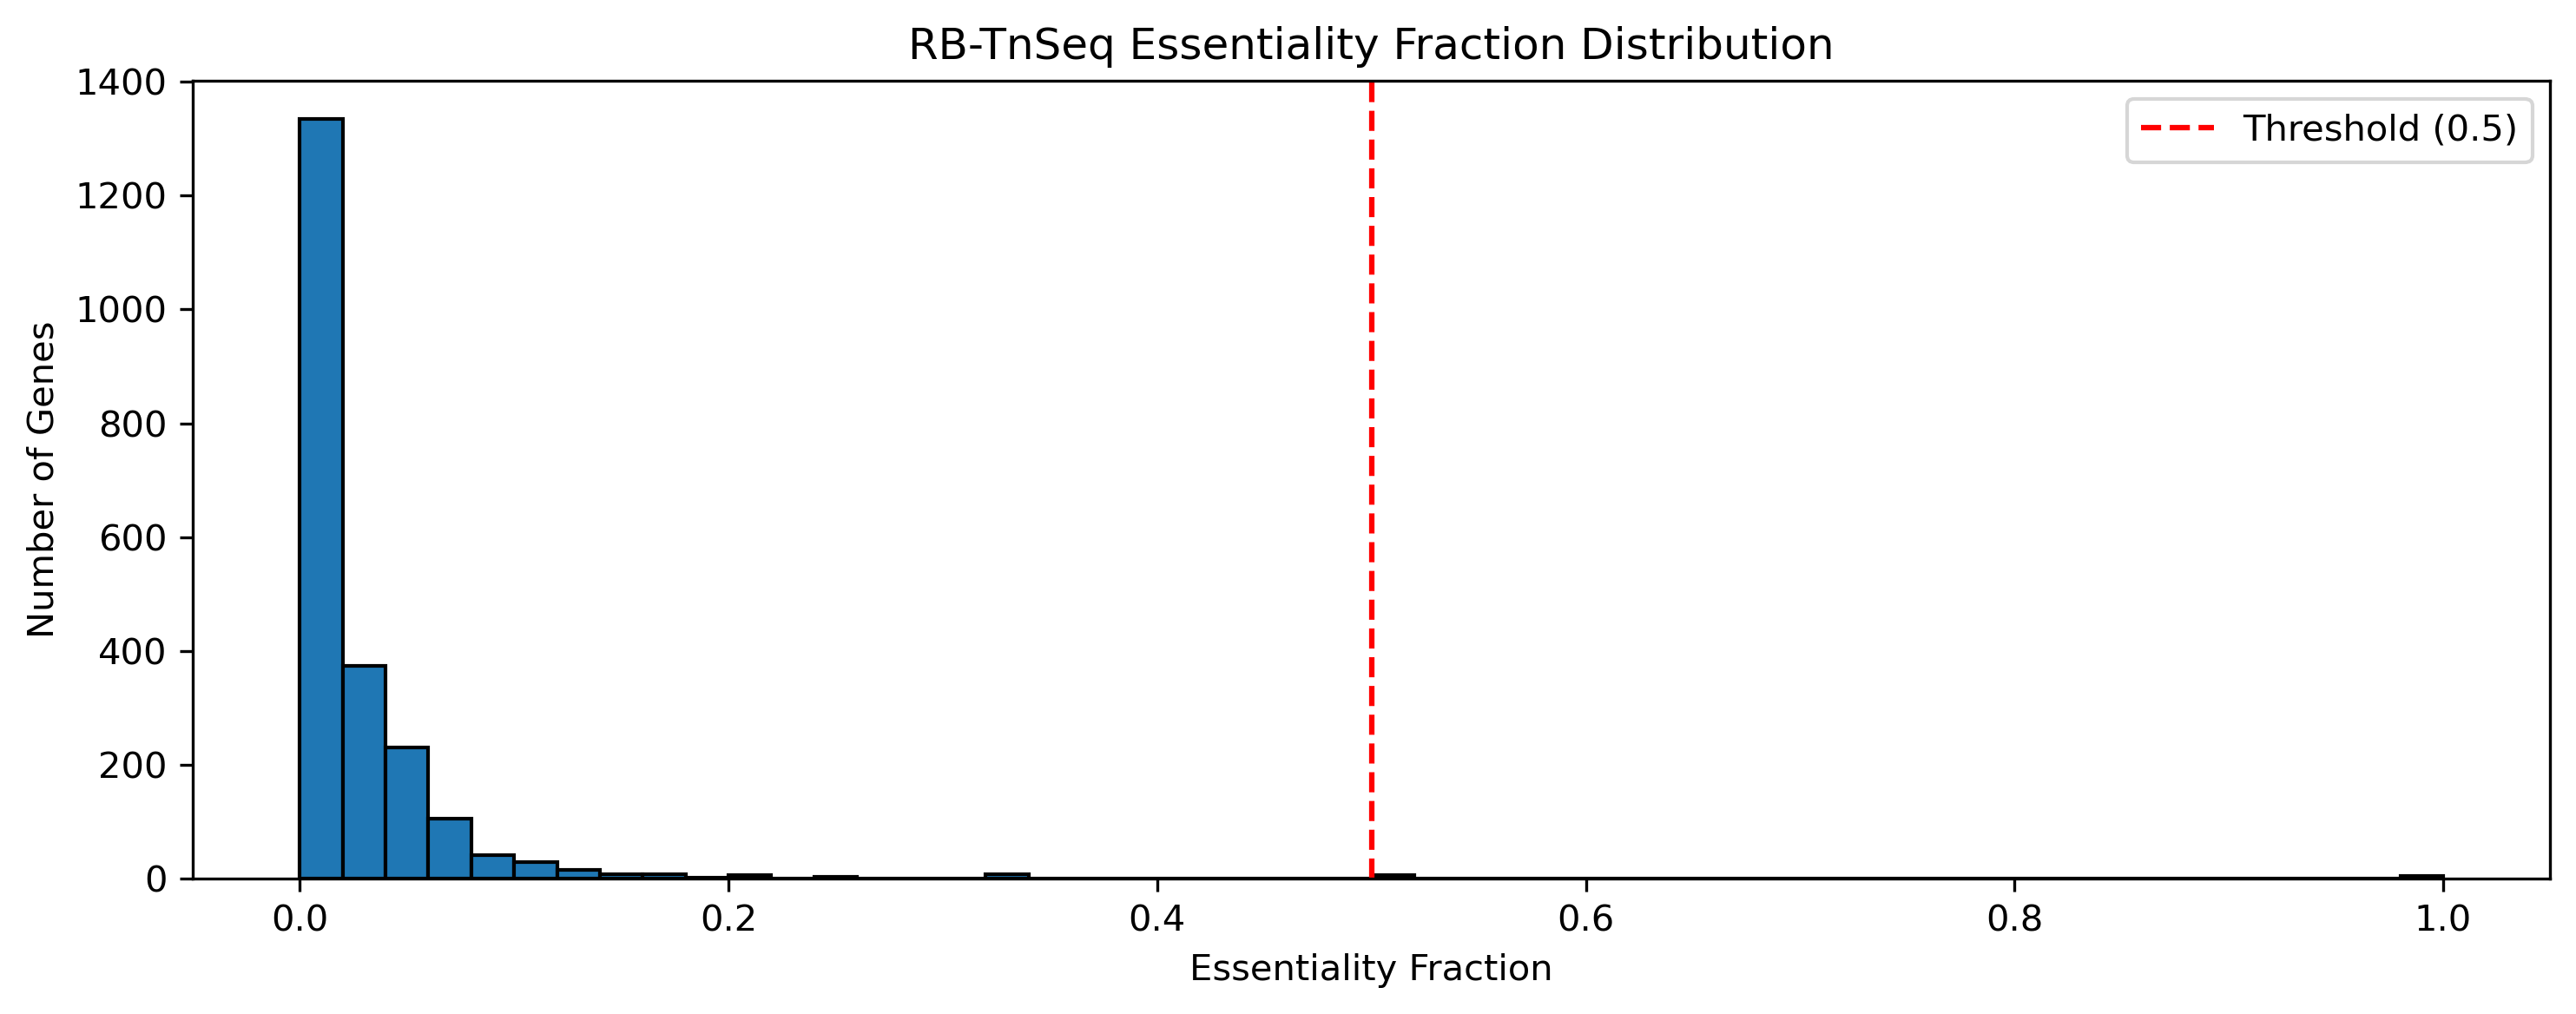
Key constraint: All 478 triple-covered genes (having TnSeq + FBA + growth data) are TnSeq-dispensable on minimal media. This is biologically expected — TnSeq-essential genes have no viable deletion mutants, so they cannot have growth rate measurements. The analysis therefore asks: among dispensable genes, does FBA correctly predict which ones matter for growth?
The gene_phenotypes table provides per-carbon-source FBA flux predictions, enabling condition-matched comparisons for 6 of 8 carbon sources (glucose, acetate, asparagine, butanediol, glucarate, lactate).
Review
Summary
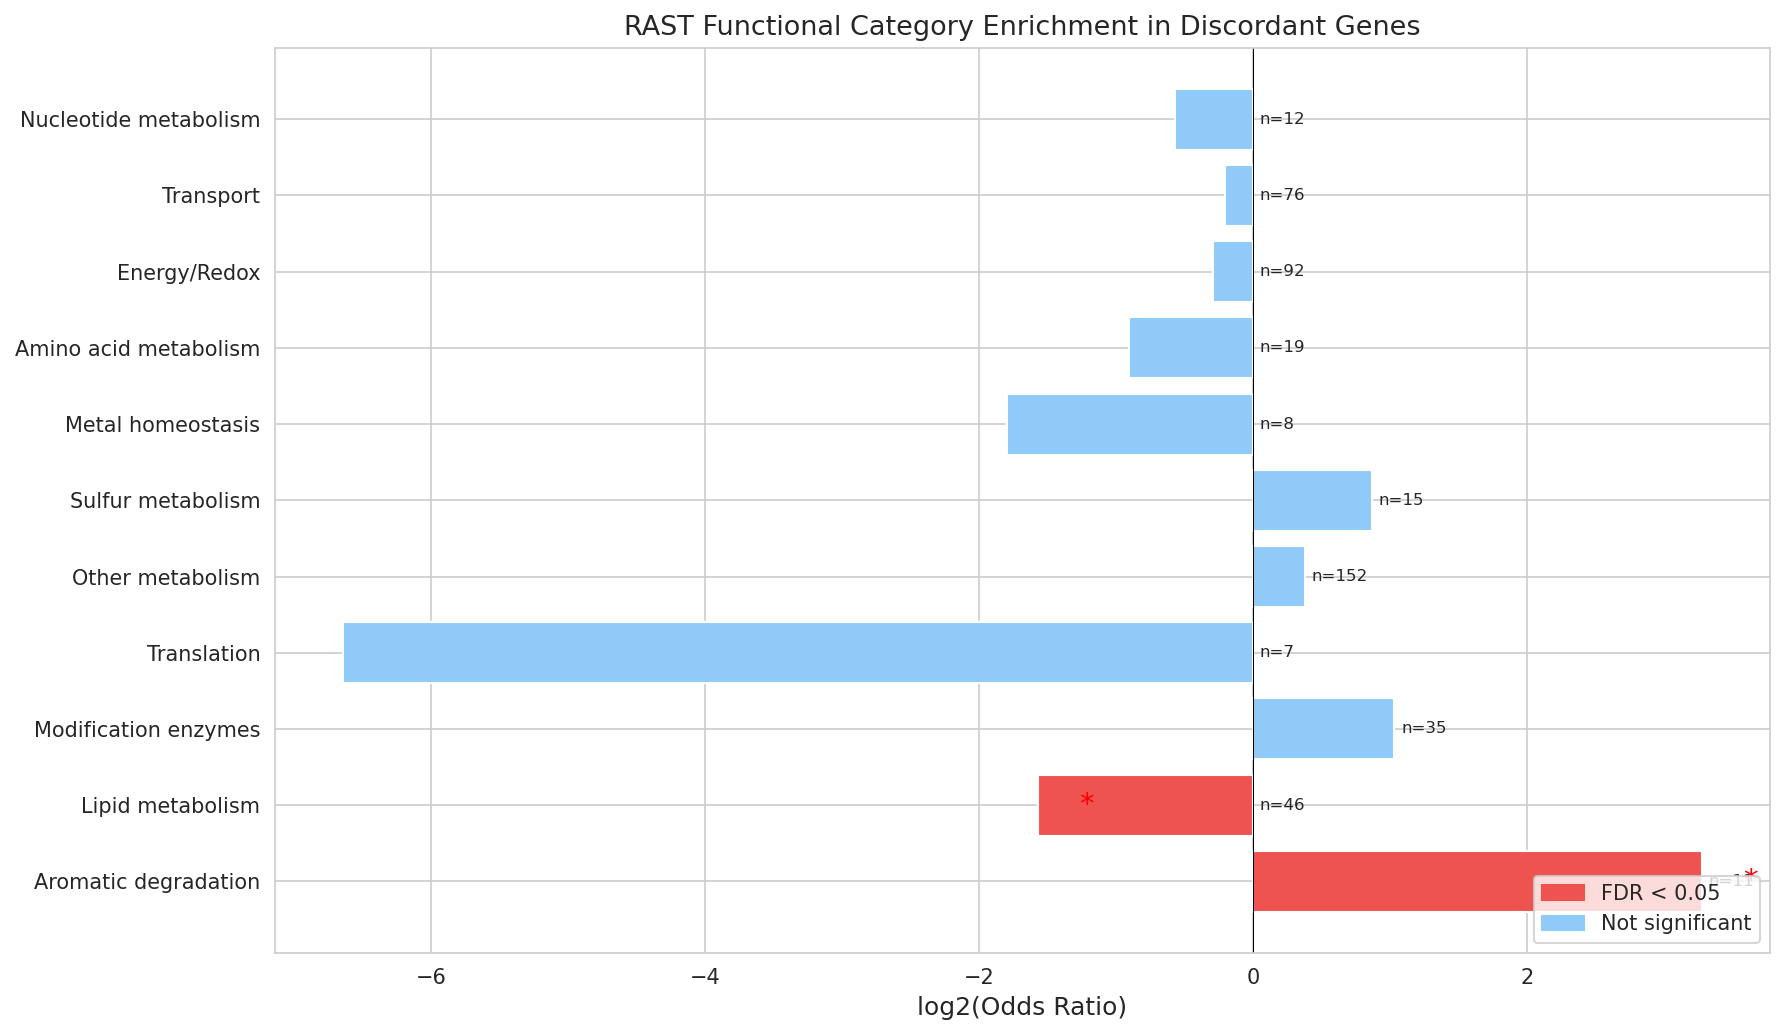
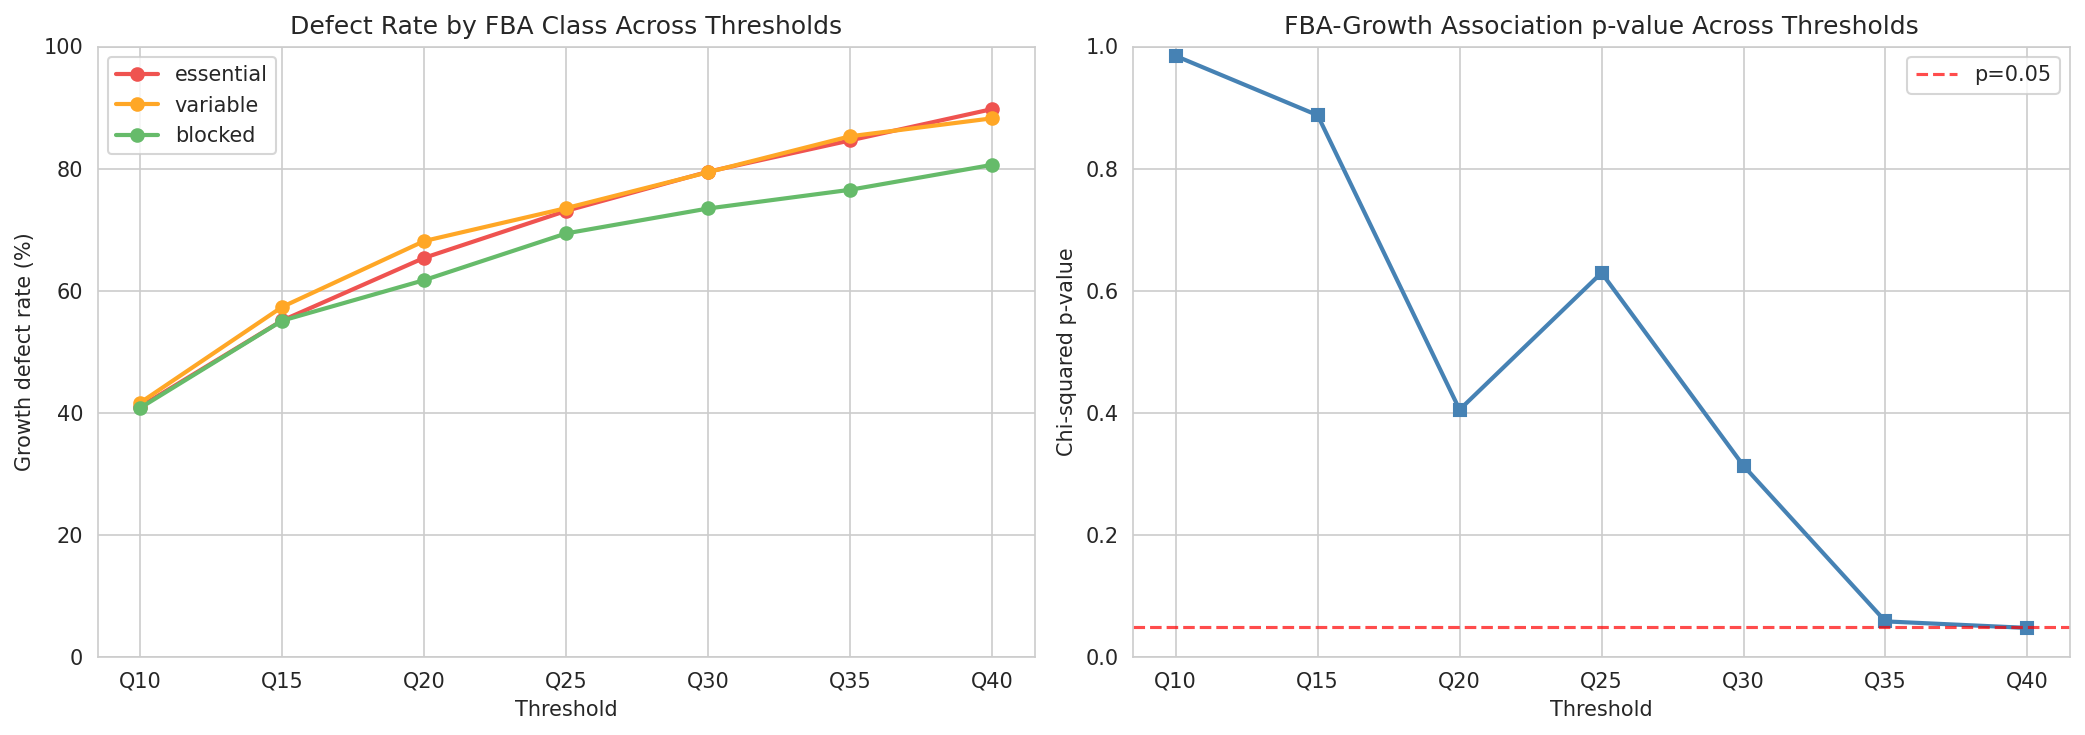
This is a well-executed negative-result project that asks whether FBA essentiality class predicts mutant growth defects among TnSeq-dispensable genes in A. baylyi ADP1, and answers convincingly: no (chi-squared p = 0.63). The project excels in statistical rigor — a threshold sensitivity analysis across Q10–Q40, complementary categorical and continuous tests, and BH-FDR-corrected enrichment analysis — as well as documentation quality (complete three-file structure with README, RESEARCH_PLAN, and REPORT) and reproducibility (all three notebooks have saved outputs, 10 figures span every analysis stage, and a requirements.txt is provided). The biological constraint that all triple-covered genes must be TnSeq-dispensable is clearly explained and its implications are well-understood. The RAST-based functional enrichment revealing aromatic degradation genes as the primary source of FBA discordance (OR = 9.70, q = 0.012) provides a mechanistic explanation grounded in ADP1's known biology. Areas for improvement are minor: the per-condition Spearman correlations lack multiple-testing correction, the RAST keyword-based categorization leaves 32% of genes in a catch-all "Other metabolism" bin, and the external SQLite database dependency could be better documented for full reproducibility.
Methodology
Research question: Clearly stated, specific, and testable. The question is well-scoped — it asks about FBA's predictive power within the dispensable gene subset, carefully distinguishing this from the prior project's binary essential/dispensable concordance (74%).
Approach: Sound and well-motivated. The three-phase design (data assembly, concordance analysis, discordant characterization) follows a logical progression. The decision to use RAST functional annotations (100% coverage) instead of COG identifiers (13% coverage; NB03, cell 5) for enrichment analysis is pragmatic and clearly justified. The earlier review flagged a COG parsing bug, and this project appears to have pivoted to RAST categorization to address both the low coverage and the parsing issues — a good design choice.
Biological constraint handling: The report is transparent about the fundamental limitation that TnSeq-essential genes cannot appear in the triple-covered set. This is explained in the README, RESEARCH_PLAN, REPORT, and within notebooks — appropriately, since it shapes every interpretation.
Data sources: Clearly identified. The project depends on user_data/berdl_tables.db (136 MB, from the prior acinetobacter_adp1_explorer project) and data/cluster_id_mapping.csv (4,891 rows, also from the prior project). The README states the SQLite file is not in git, which is appropriate for its size.
Sensitivity analysis: The threshold sweep (Q10–Q40) with both chi-squared (categorical) and Kruskal-Wallis (continuous, threshold-independent) tests is a strong methodological choice that preempts the most obvious criticism of the Q25 cutoff. The report also correctly explains the "any defect across 8 conditions" aggregation effect on background rate (72% observed vs 90% expected under independence).
Reproducibility: Strong overall:
- All three notebooks have saved outputs (text tables, statistics, and figure images)
- The figures/ directory contains all 10 figures referenced in the REPORT
- requirements.txt is present with versioned dependencies
- The README includes a ## Reproduction section with exact nbconvert commands
- No Spark dependency — everything runs locally against a SQLite file
Code Quality
Notebook organization: All three notebooks follow the setup-query-analysis-visualization-summary pattern consistently. Markdown headers delineate sections clearly. Summary print blocks at the end of each notebook make key results scannable.
Statistical methods: Appropriate throughout:
- Chi-squared test for the 3x2 FBA class x growth defect contingency table (NB02, cell 4)
- Kruskal-Wallis and pairwise Mann-Whitney U for continuous growth rate comparisons (NB02, cell 8)
- Spearman rank correlation for condition-specific FBA flux vs growth (NB02, cell 11)
- Fisher's exact test with BH-FDR for RAST category enrichment (NB03, cell 6)
- Directional enrichment analysis separating FBA over-prediction from under-prediction (NB03, cell 7)
One gap in multiple-testing correction: The six per-condition Spearman correlations (NB02, cell 11) are not corrected for multiple testing. With Bonferroni correction (threshold p < 0.0083), asparagine (p < 0.001), acetate (p = 0.004), and glucarate (p = 0.005) would survive, but the narrative significance markers in the REPORT ("**" for p < 0.01) may overstate confidence for the acetate and glucarate results individually. This is a minor point since the correlations are all weak (|rho| < 0.26) and the report correctly characterizes them as "weak, mixed."
NaN handling: The code in NB01 (cell 9) correctly uses pd.BooleanDtype() for growth defect flags to handle missing data, and the any_growth_defect column uses .fillna(False).astype(bool) — the correct pattern per docs/pitfalls.md (avoiding the fillna(False) object-dtype trap).
Pitfall awareness: The project runs entirely from a local SQLite database, so most BERDL Spark pitfalls are not applicable. The pangenome cluster mapping from the prior project sidesteps cross-species cluster comparison issues. No relevant pitfalls from docs/pitfalls.md appear to be violated.
Minor redundancy: The concordance_class column is created in NB01 (cell 16) and a similar discord_class column is created in NB03 (cell 3) with slightly different naming conventions. Both are internally consistent, but consolidating into a single classification scheme in NB01 (saved to the CSV) would reduce duplication.
RAST categorization quality: The keyword-based categorize_rast() function (NB03, cell 5) is a reasonable heuristic and is acknowledged as approximate in the REPORT limitations. The 32% "Other metabolism" bin is large but doesn't undermine the significant enrichment findings (aromatic degradation, lipid metabolism), which are driven by specific, well-defined keyword patterns.
Findings Assessment
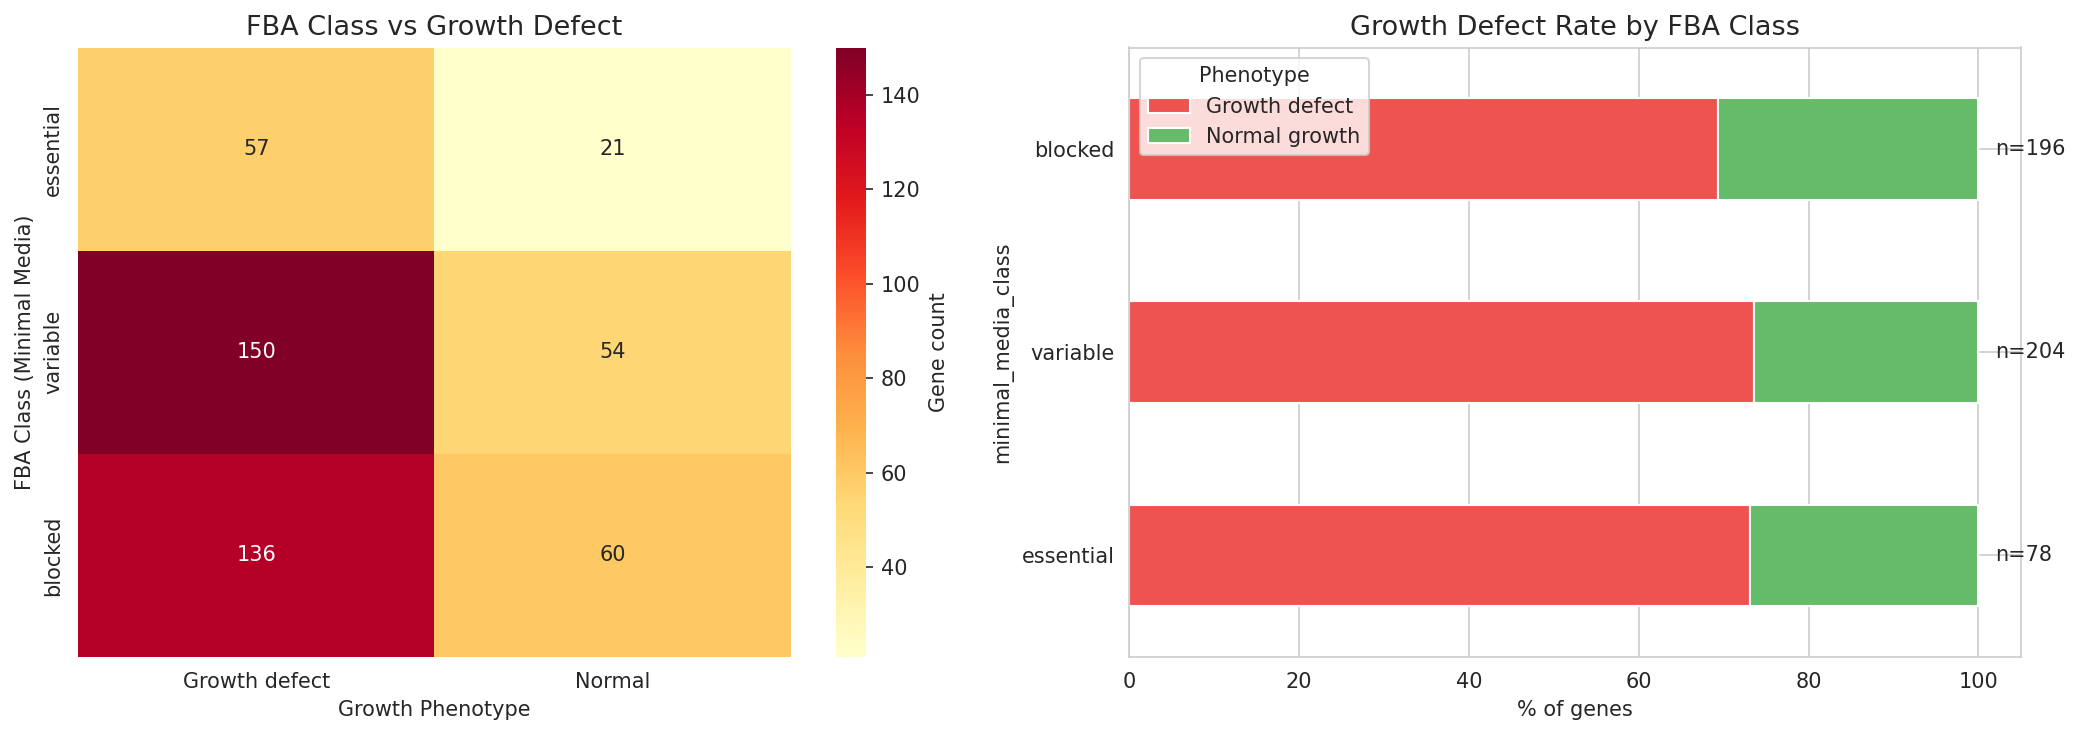
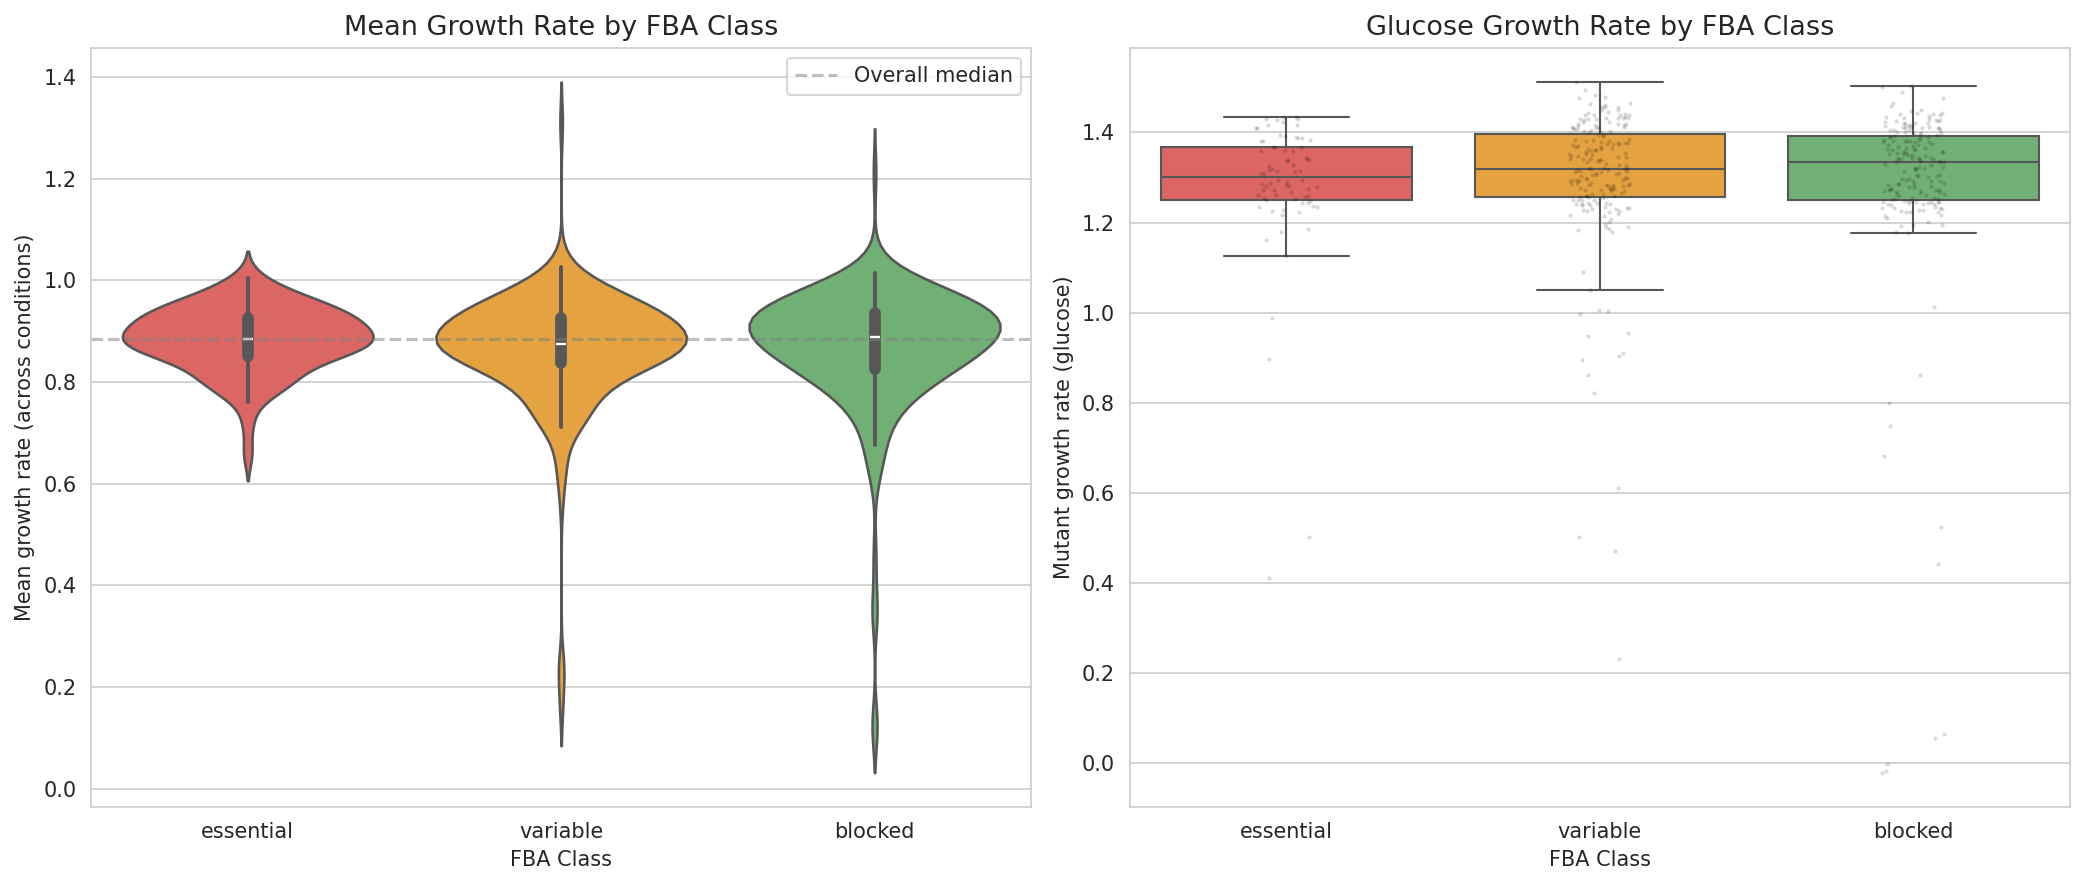
Central negative finding: The conclusion that FBA class does not predict growth defects (p = 0.63) is robustly supported by: (1) nearly identical defect rates across FBA classes (73.1%, 73.5%, 69.4%), (2) the threshold sensitivity analysis showing p > 0.05 from Q10 through Q35, (3) the threshold-independent Kruskal-Wallis test (p = 0.43), and (4) non-significant pairwise Mann-Whitney U tests. This is a convincing negative result.
Aromatic degradation enrichment: The strongest positive finding — aromatic degradation gene enrichment among discordant genes (OR = 9.70, q = 0.012) — is well-interpreted. The connection to ADP1's known aromatic catabolism capabilities and the hypothesis about trace aromatic compounds in the growth medium (or moonlighting functions) is biologically plausible and well-cited (Barbe et al. 2004). The directional analysis (NB03, cell 7) showing this is driven by the FBA-under-prediction class (OR = 12.0, q = 0.004) adds mechanistic specificity.
Glucarate anomaly: The positive Spearman correlation for glucarate (rho = +0.246, opposite to expected) is noted and discussed as a potential condition-specific model gap. This is appropriately flagged rather than explained away.
Concordance rate framing: The report correctly notes that the 42.7% concordance rate (FBA-essential+defect or FBA-blocked+normal) is worse than random chance (50%) because the 72% background defect rate ensures most FBA-blocked genes also show defects. This is an important nuance that prevents misinterpretation.
Limitations acknowledged: Five specific limitations are listed, covering the arbitrary threshold, the TnSeq-dispensable constraint, the approximate RAST categorization, the growth ratio data format, and FBA model vintage. These are appropriate, honest, and well-reasoned.
Literature context: Five references are cited and used meaningfully — each connected to specific findings rather than just listed. The Guzman (2018) citation about "adaptive flexibility" is particularly apt for interpreting the condition-specific growth defects (70% of genes showing condition-dependent effects).
Future directions: The five proposed directions are concrete and actionable, particularly #1 (continuous FBA flux analysis) and #2 (aromatic compound investigation), which follow directly from the current findings.
Suggestions
-
Apply multiple-testing correction to per-condition Spearman correlations (NB02, cell 11). With 6 tests, even a simple Bonferroni or BH-FDR correction would clarify which condition-specific correlations are independently robust. Consider adding a
q_valuecolumn to the correlation results table, mirroring the approach already used for RAST enrichment. Impact: low — does not change main conclusions, but improves statistical rigor. -
Document how to obtain
user_data/berdl_tables.db. The README notes this file is required but not in git. Adding a sentence about which notebook or script in theacinetobacter_adp1_explorerproject generates it (and/or whether it can be downloaded) would close the reproducibility loop. Impact: medium — affects reproducibility for new users. -
Consider a per-condition concordance analysis as a supplement. The main analysis aggregates growth defects across 8 conditions into a binary "any defect" flag, which inflates the background rate to 72%. A per-condition chi-squared test (FBA class x defect on that specific condition) for the 6 matched conditions would test whether FBA performs better when the comparison is condition-matched. The per-condition defect rates already exist in NB02 (cell 8) — this would require only a few additional lines of analysis. Impact: medium — could reveal condition-specific FBA accuracy that the aggregate analysis masks.
-
Reduce the "Other metabolism" RAST category. Adding keyword patterns for a few more functional groups (e.g., cofactor biosynthesis: "cobalamin", "biotin", "thiamin", "folate"; secretion systems: "type II", "type IV", "sec"; carbohydrate metabolism: "glycosyl", "sugar") could shrink the 32% catch-all bin. Impact: low — unlikely to change significant enrichment results but would improve annotation granularity.
-
Consider using continuous FBA flux for the main concordance test (already listed as Future Direction #1). Given that
minimal_media_fluxis available for all 478 genes (NB01, cell 19 shows 478 non-null values), a Spearman correlation between continuous flux and mean growth rate could be computed in a single cell and would test whether FBA's quantitative predictions carry information even when the categorical classification does not. Impact: medium — could yield a more nuanced finding and would strengthen the paper. -
Add expected runtime to reproduction instructions. Even a brief note like "Full pipeline runs in < 5 minutes on a laptop" would help potential reproducers plan. Impact: low.
This review was generated by an AI system. It should be treated as advisory input, not a definitive assessment.
Visualizations
Concordance Comprehensive
Data Assembly Overview
Defect Condition Correlation
Discordance Analysis
Fba Comparison
Fba Growth Concordance
Flux Vs Growth Scatter
Growth By Fba Class
Growth Rate Distributions
Pangenome Discordance
Proteomics Expression Distribution
Rast By Discordance Class
Rast Enrichment Discordant
Roc Comprehensive
Threshold Sensitivity
Tnseq Essentiality Distribution
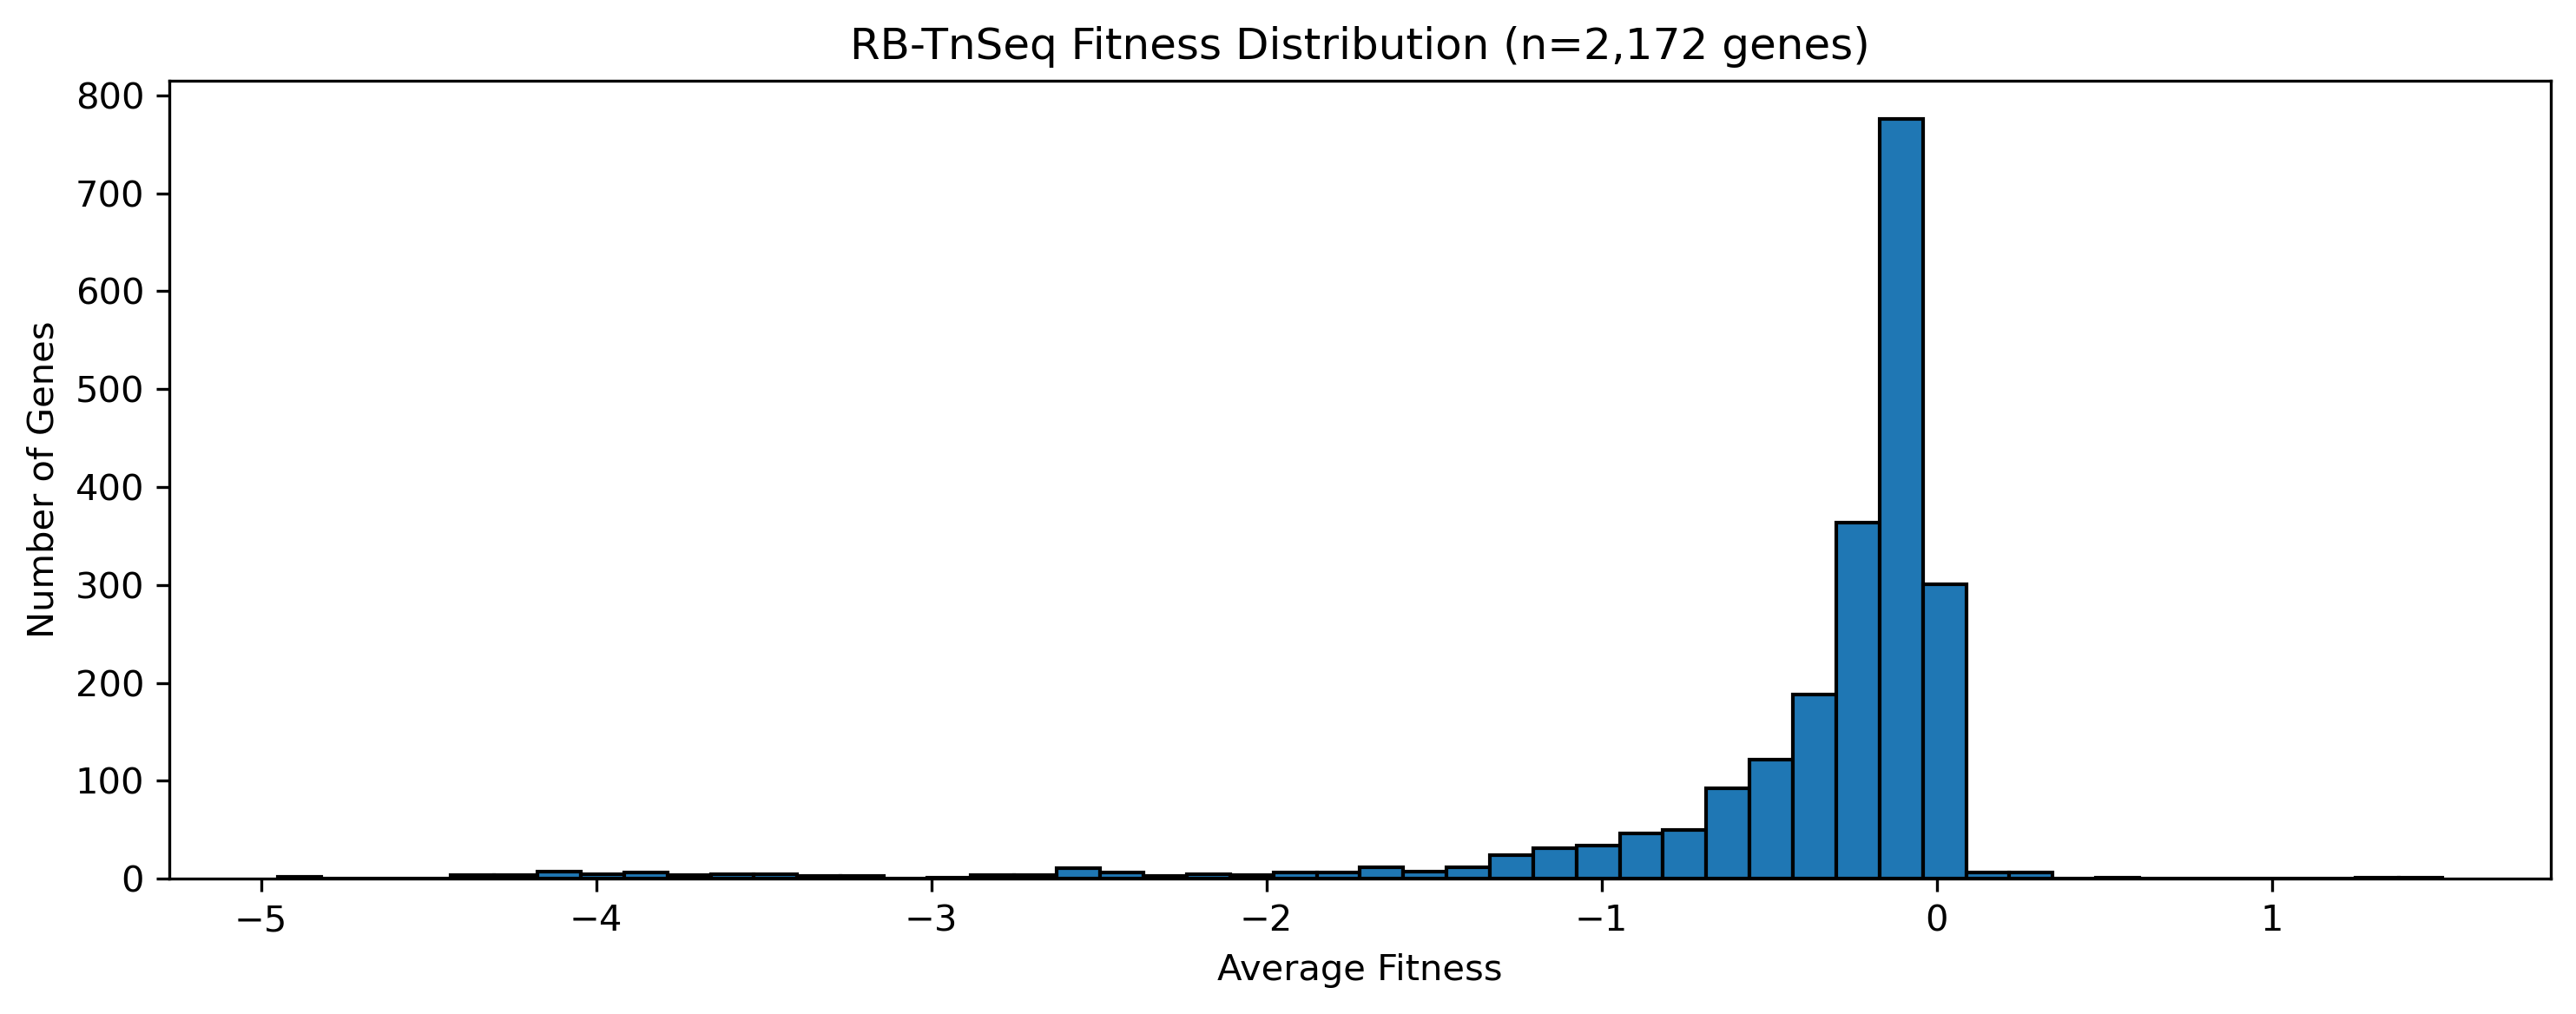
Tnseq Fitness Distribution
Notebooks
01_build_essentiality_vectors.ipynb
01 Build Essentiality Vectors
View notebook →
01_data_assembly.ipynb
01 Data Assembly
View notebook →
02_concordance_analysis.ipynb
02 Concordance Analysis
View notebook →
02_refined_concordance_analysis.ipynb
02 Refined Concordance Analysis
View notebook →
03_discordant_characterization.ipynb
03 Discordant Characterization
View notebook →