ADP1 Deletion Collection Phenotype Analysis
CompletedResearch Question
What is the condition-dependent structure of gene essentiality in Acinetobacter baylyi ADP1, as revealed by the de Berardinis single-gene deletion collection grown on 8 carbon sources?
Research Plan
Hypothesis
- H0: Growth defect profiles across 8 carbon sources are independent — each condition affects a random subset of genes, and no coherent functional modules emerge from the growth matrix.
- H1: Carbon source growth profiles reveal structured condition dependencies and functionally coherent gene modules, reflecting the metabolic architecture of ADP1.
Approach
Data Overview
The analysis centers on the genome_features table from user_data/berdl_tables.db:
- 5,852 total genes in the ADP1 genome
- 2,350 genes with growth data on any of 8 carbon sources
- 2,034 genes with growth data on all 8 conditions (the "complete matrix")
- 3,405 genes with TnSeq essentiality calls (minimal media)
- 2,226 genes with both growth data and TnSeq classification
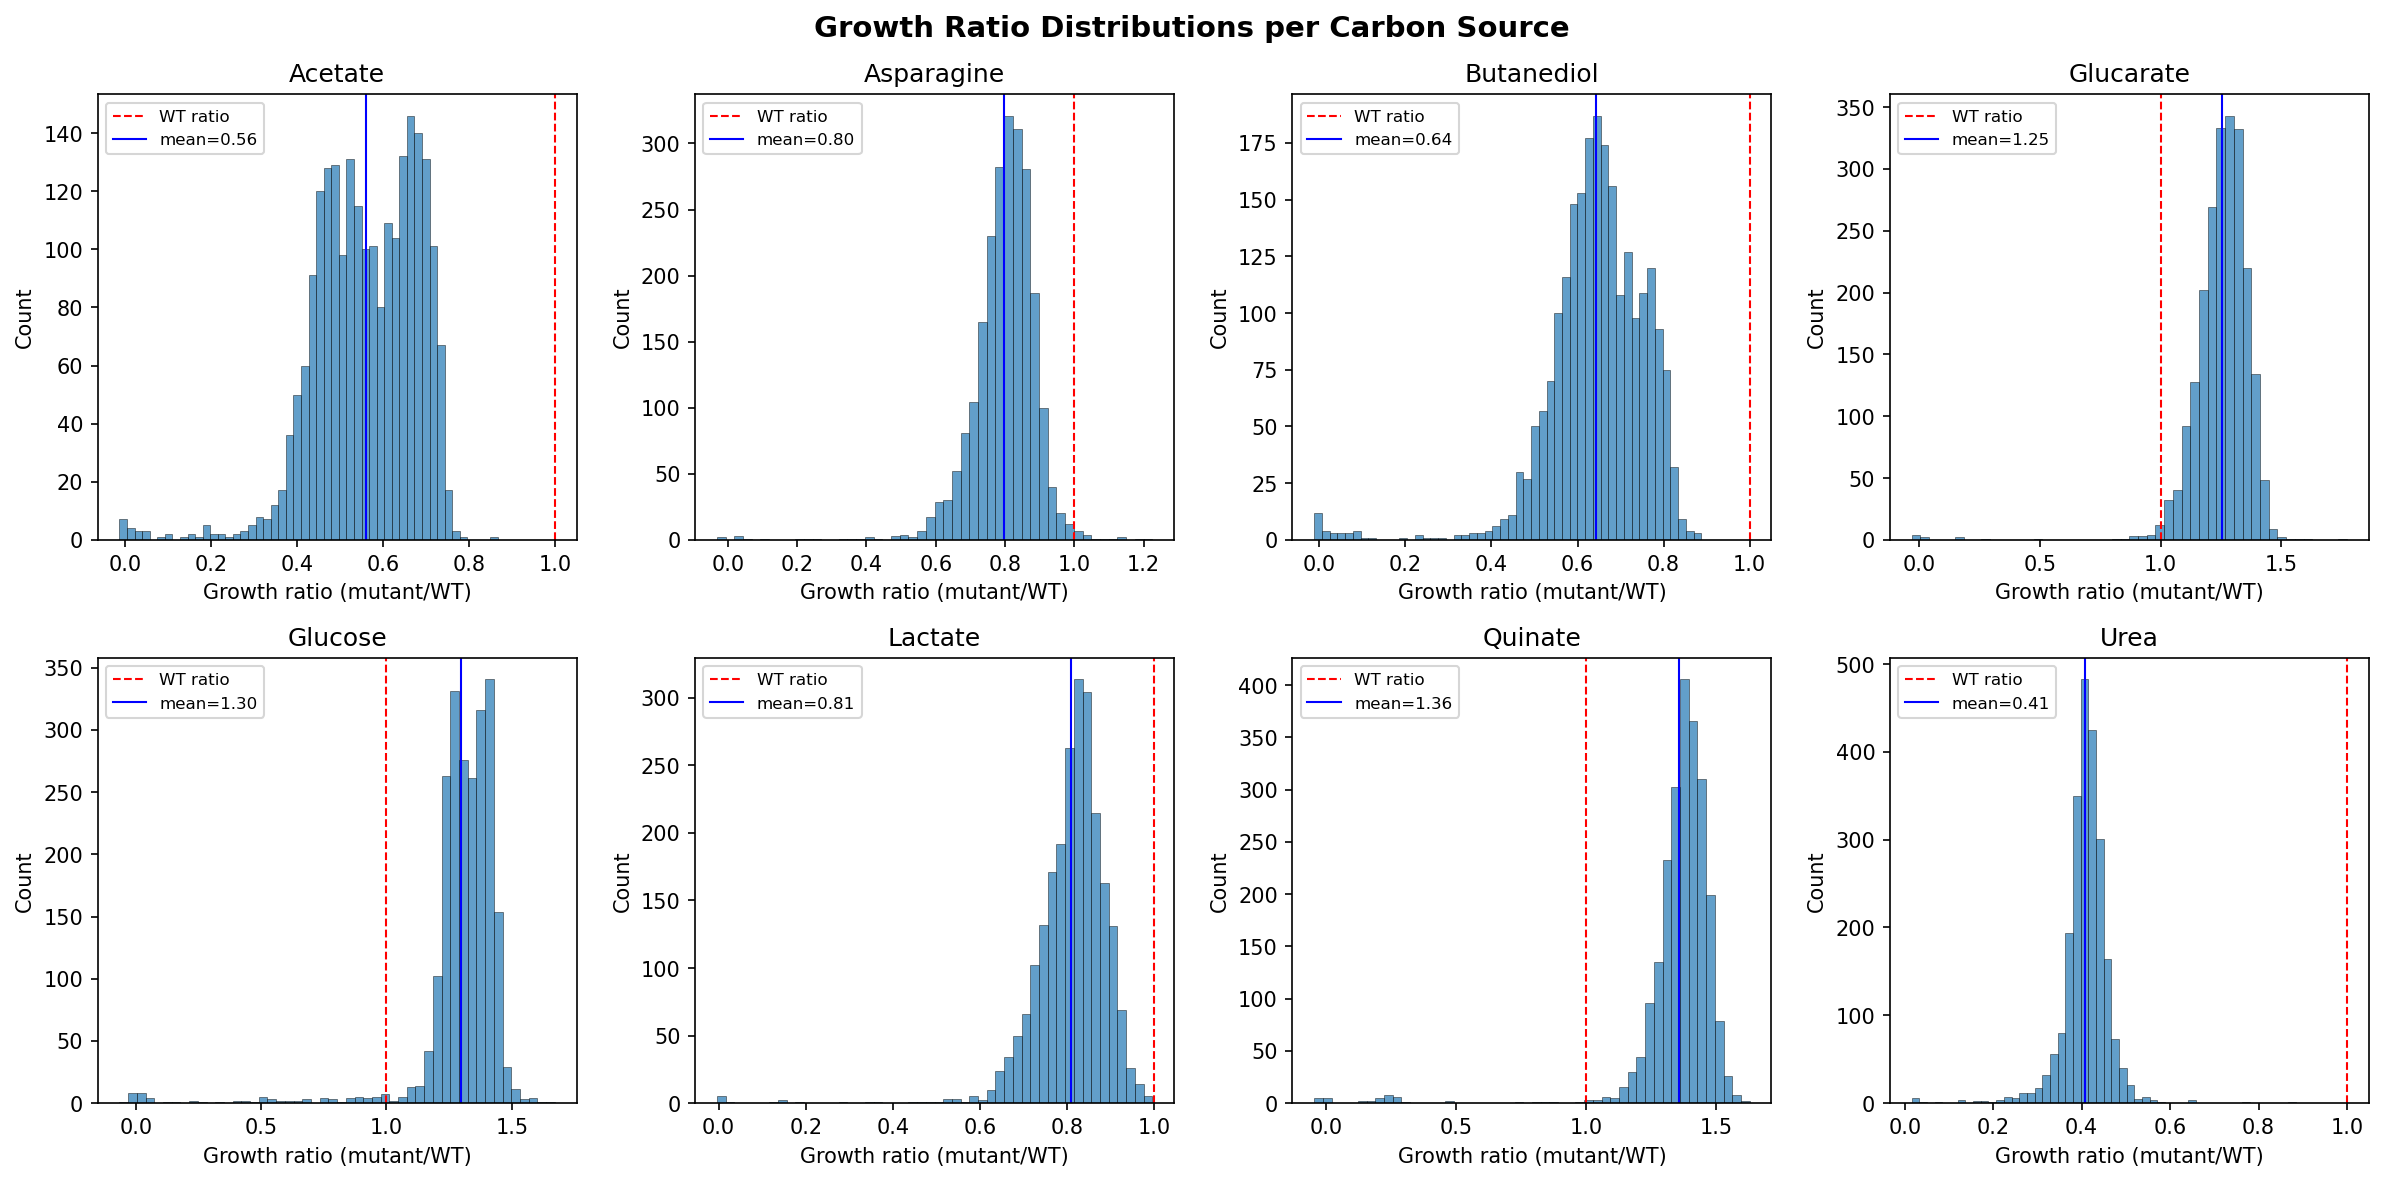
Growth conditions and their mean growth ratios (mutant/WT):
| Condition | n genes | Mean | Interpretation |
|-----------|---------|------|----------------|
| Urea | 2,312 | 0.409 | Most deletions impair growth — urea is demanding |
| Acetate | 2,279 | 0.562 | Many defects — acetate metabolism constrained |
| Butanediol | 2,300 | 0.644 | Moderate defects |
| Asparagine | 2,312 | 0.798 | Moderate |
| Lactate | 2,316 | 0.810 | Moderate |
| Glucarate | 2,222 | 1.254 | Few defects — robust growth |
| Glucose | 2,251 | 1.298 | Few defects — robust, many bypass routes |
| Quinate | 2,310 | 1.355 | Few defects — robust on aromatic carbon |
The conditions naturally split into two groups: "demanding" (urea, acetate, butanediol) where many genes are needed, and "robust" (glucose, quinate, glucarate) where most deletions have no effect.
Aim 1: Condition Structure
Goal: Characterize which carbon sources produce redundant vs independent gene essentiality profiles.
Methods:
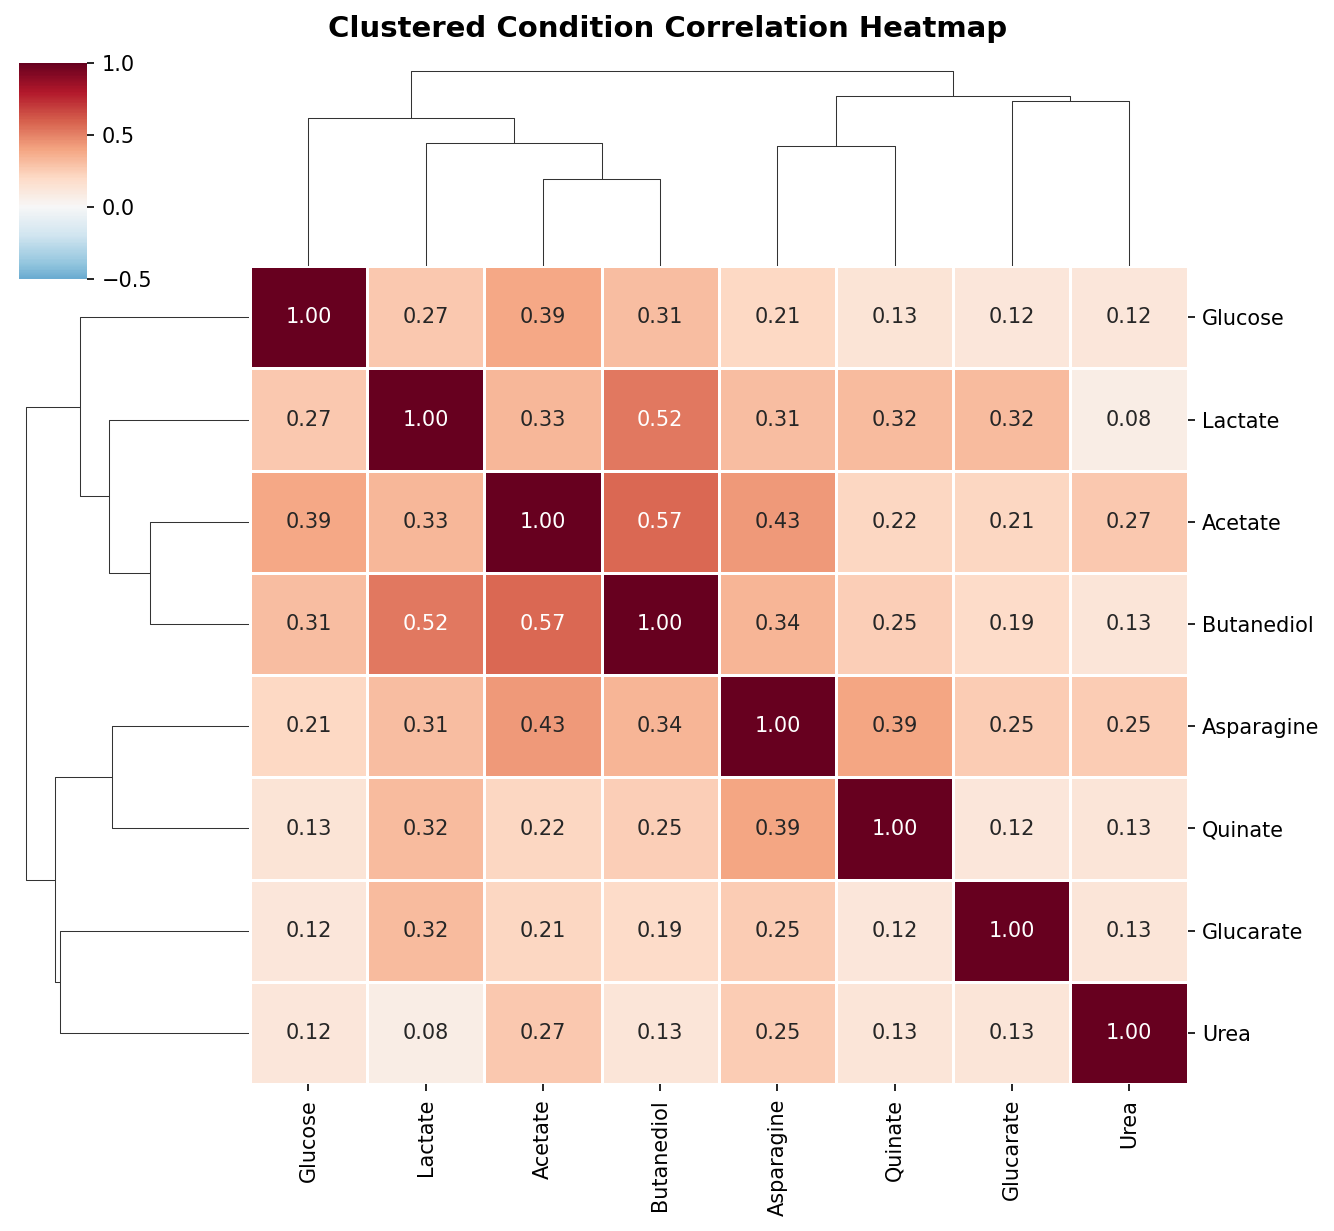
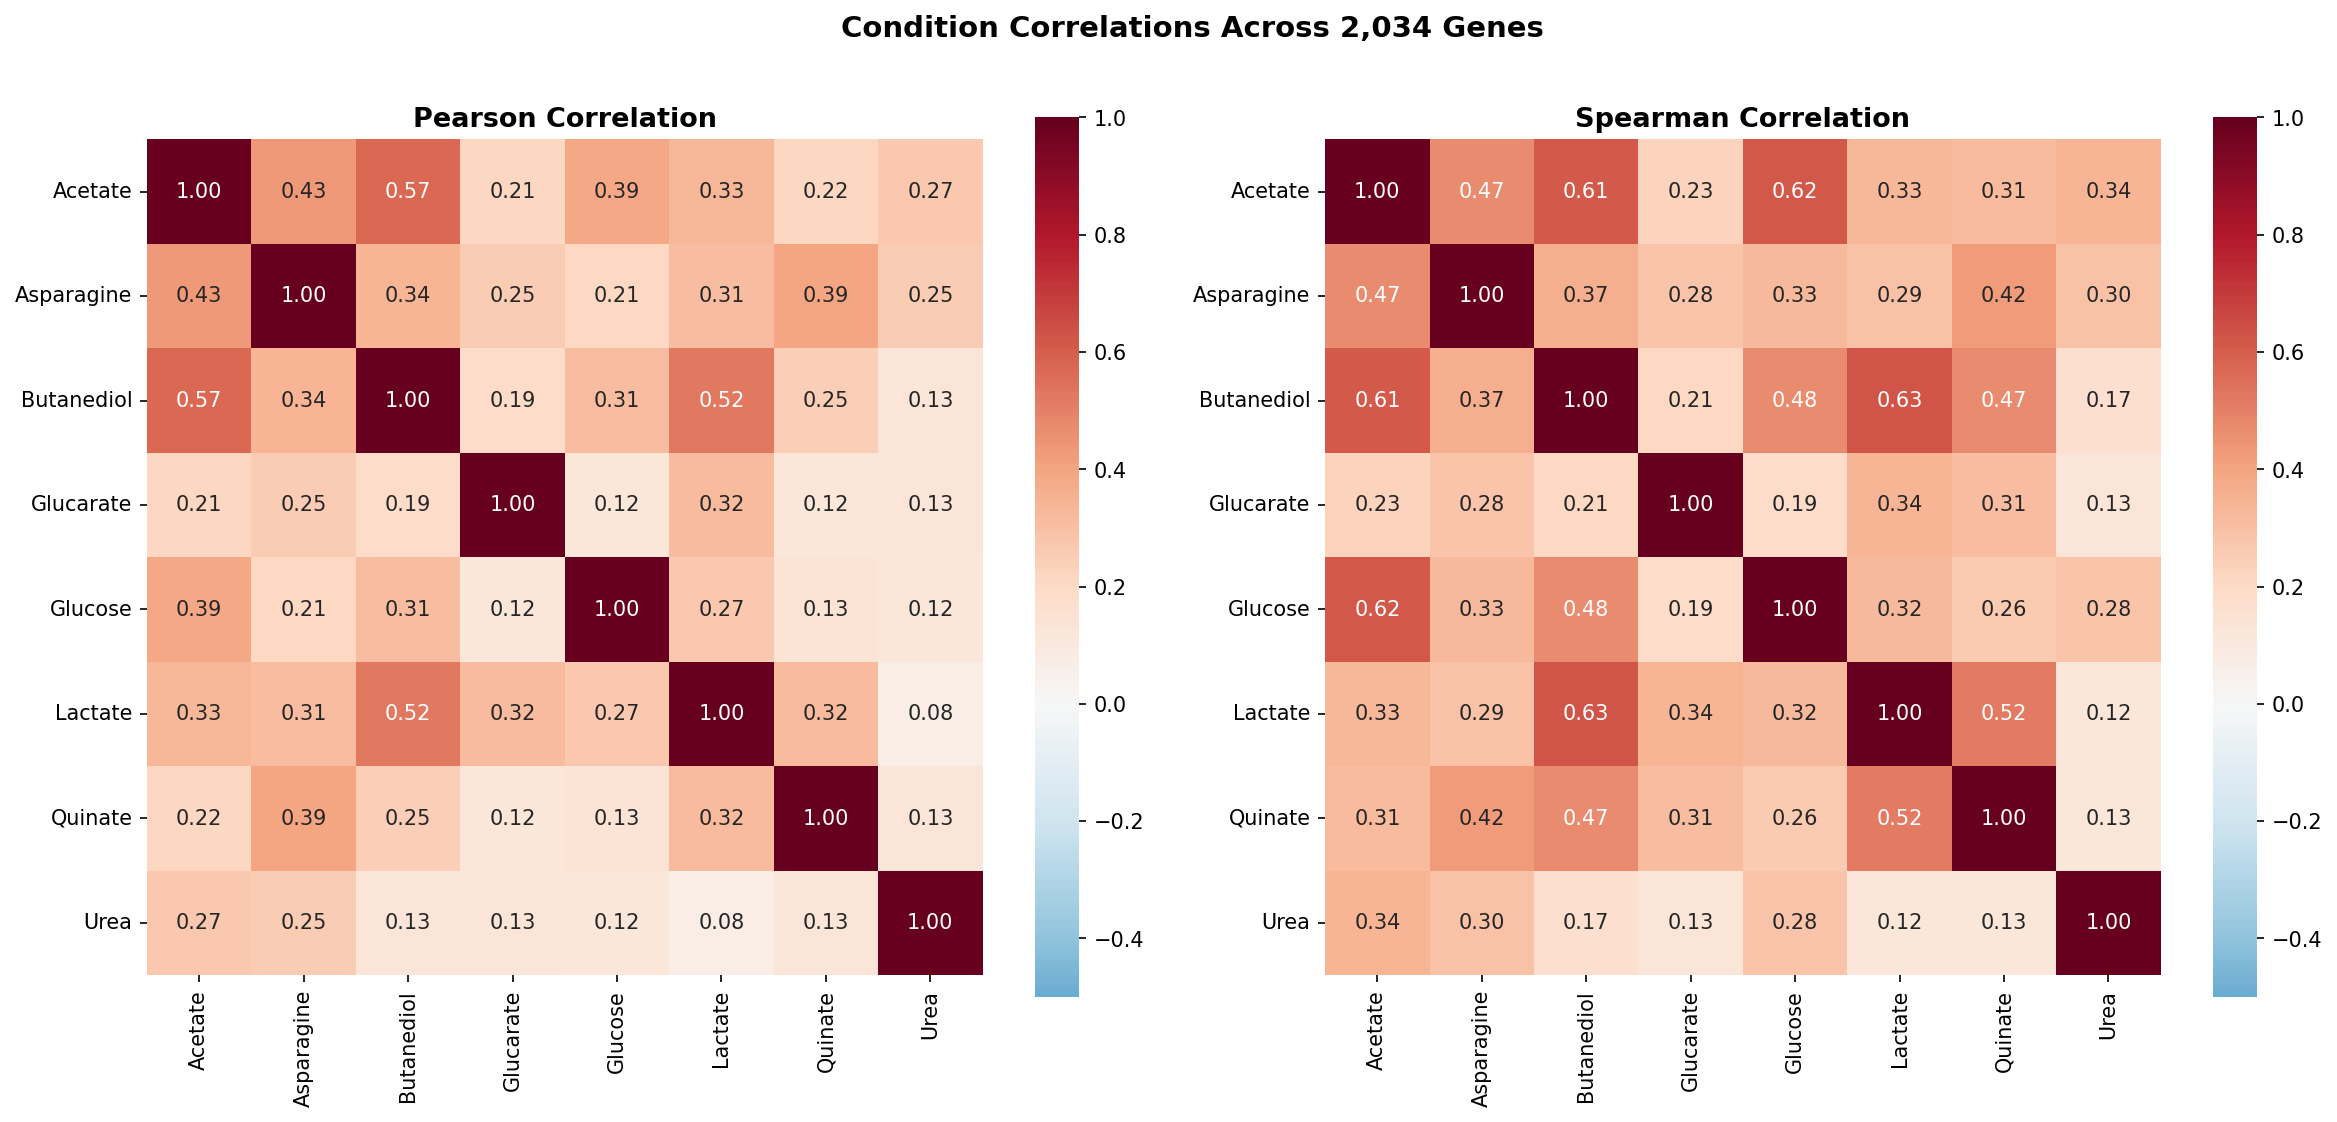
- Pairwise Pearson and Spearman correlations of the 8 conditions across 2,034 shared genes
- PCA of the 2,034×8 growth matrix (conditions as variables): how many principal components capture most variance?
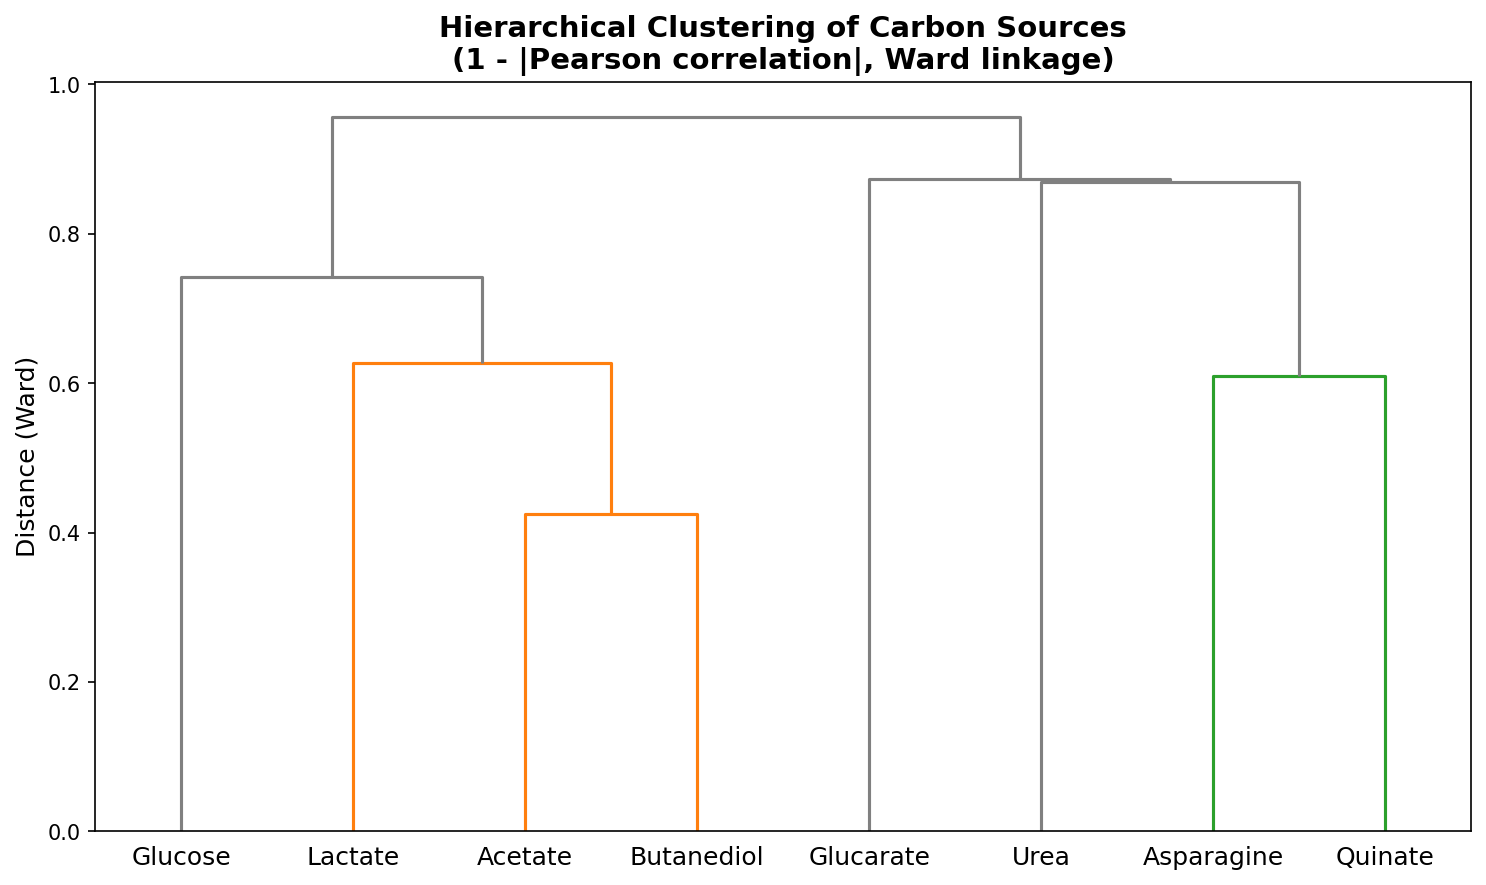
- Hierarchical clustering of conditions (Ward's method, 1-correlation distance)
- Compare condition groupings to carbon source biochemistry: do conditions cluster by metabolic entry point (glycolysis vs TCA vs aromatic degradation)?
Expected output: Condition correlation heatmap, PCA biplot, condition dendrogram, interpretation of condition clusters.
Aim 2: Gene Modules
Goal: Identify groups of genes with correlated growth defect profiles across conditions.
Methods:
- Z-score normalize growth values per condition (center and scale to account for different mean levels)
- Hierarchical clustering of the 2,034 genes by their 8-condition growth profiles (Ward's method, Euclidean distance on z-scores)
- Determine optimal number of clusters via silhouette analysis and gap statistic
- Alternative: NMF decomposition of the (shifted non-negative) growth matrix to find latent factors
- Functional enrichment of each module: RAST functions (100% coverage), KO terms (57% coverage), PFAM domains (95% coverage). Apply Benjamini-Hochberg FDR correction (q<0.05) for multiple testing across all module × category tests. Use pd.notna() checks before string operations on annotation columns with partial coverage.
- Compare modules to known ADP1 pathway structure: do modules correspond to operons, regulons, or metabolic pathways?
Expected output: Clustered heatmap, module membership table with functional annotations, enrichment analysis per module.
Aim 3: Condition-Specific Genes
Goal: For each condition, identify genes whose importance is specific to that carbon source.
Methods:
- Per-gene z-score profile across 8 conditions: genes with one extreme value and 7 near-zero values are condition-specific
- Condition specificity score: max(|z_i|) - mean(|z_j|) for j != i
- For each condition, extract top 20-50 condition-specific genes
- Functional annotation of condition-specific gene sets: RAST categories, KEGG pathways
- Focus on quinate (aromatic degradation) and urea (nitrogen metabolism) as biologically distinctive conditions
- Cross-reference with prior project: are the aromatic degradation genes identified in adp1_triple_essentiality condition-specific for quinate?
Expected output: Condition-specificity rankings, annotated gene lists per condition, pathway mapping of condition-specific genes.
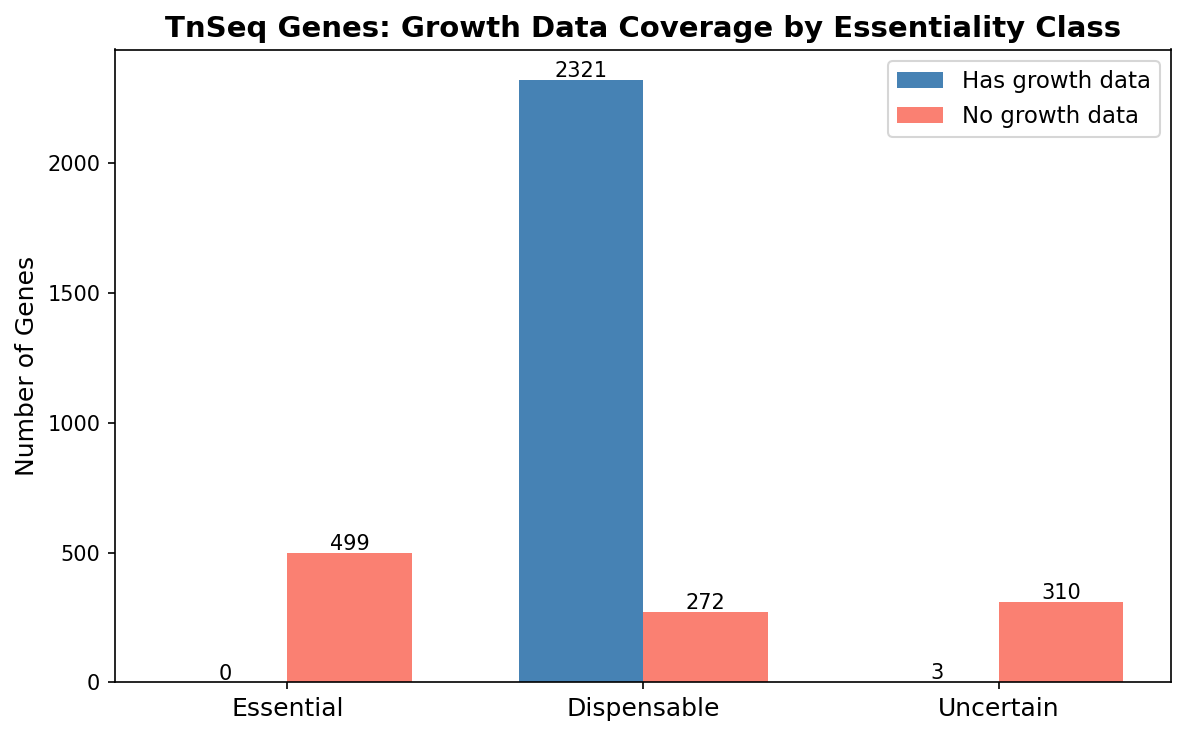
Aim 4: TnSeq Coverage Gap Analysis
Goal: Among the 1,179 TnSeq-classified genes that lack deletion mutant growth data, characterize which genes are missing and why.
Methods:
- Partition the 1,179 genes by TnSeq class:
- 499 essential (expected — no viable deletion mutant)
- 370 dispensable (unexpected — should have been in the collection)
- 310 uncertain
- For the 370 dispensable genes without growth data: compare functional annotations (RAST, KO, PFAM) to the 2,223 dispensable genes WITH growth data
- Test whether the missing dispensable genes are enriched for specific functions, genomic locations, or gene lengths. Apply Benjamini-Hochberg FDR correction for enrichment tests.
- Check whether the 310 uncertain genes show properties intermediate between essential and dispensable
Expected output: Functional comparison table, enrichment tests, characterization of the "missing dispensable" gene set.
Revision History
- v2 (2026-02-19): Addressed reviewer feedback — added BH-FDR correction to enrichment methods, specified execution environment, clarified gene_phenotypes table role, split NB04 into two notebooks (condition-specific genes + TnSeq gap analysis)
- v1 (2026-02-19): Initial plan
Overview
The de Berardinis et al. (2008) complete deletion collection for ADP1 provides growth ratio measurements for ~2,350 single-gene deletion mutants across 8 carbon sources (acetate, asparagine, butanediol, glucarate, glucose, lactate, quinate, urea). This project performs a phenotype-first analysis of the 2,034×8 complete growth matrix to discover: (1) which carbon sources produce redundant vs independent essentiality profiles, (2) functionally coherent gene modules with correlated growth defects, (3) genes with condition-specific importance, and (4) patterns in TnSeq-classified genes that lack deletion mutant data. No FBA — the prior project (adp1_triple_essentiality) showed FBA class adds no predictive value for growth defects among dispensable genes (p=0.63).
Key Findings
1. Carbon sources define a three-tier essentiality landscape
The 8 carbon sources partition into demanding, moderate, and robust tiers based on the fraction of genes showing growth defects. Urea is the most demanding (97.9% of genes show severe defects at ratio < 0.5), while quinate is the most robust (only 1.6% defective). This tier structure is consistent across multiple thresholds.
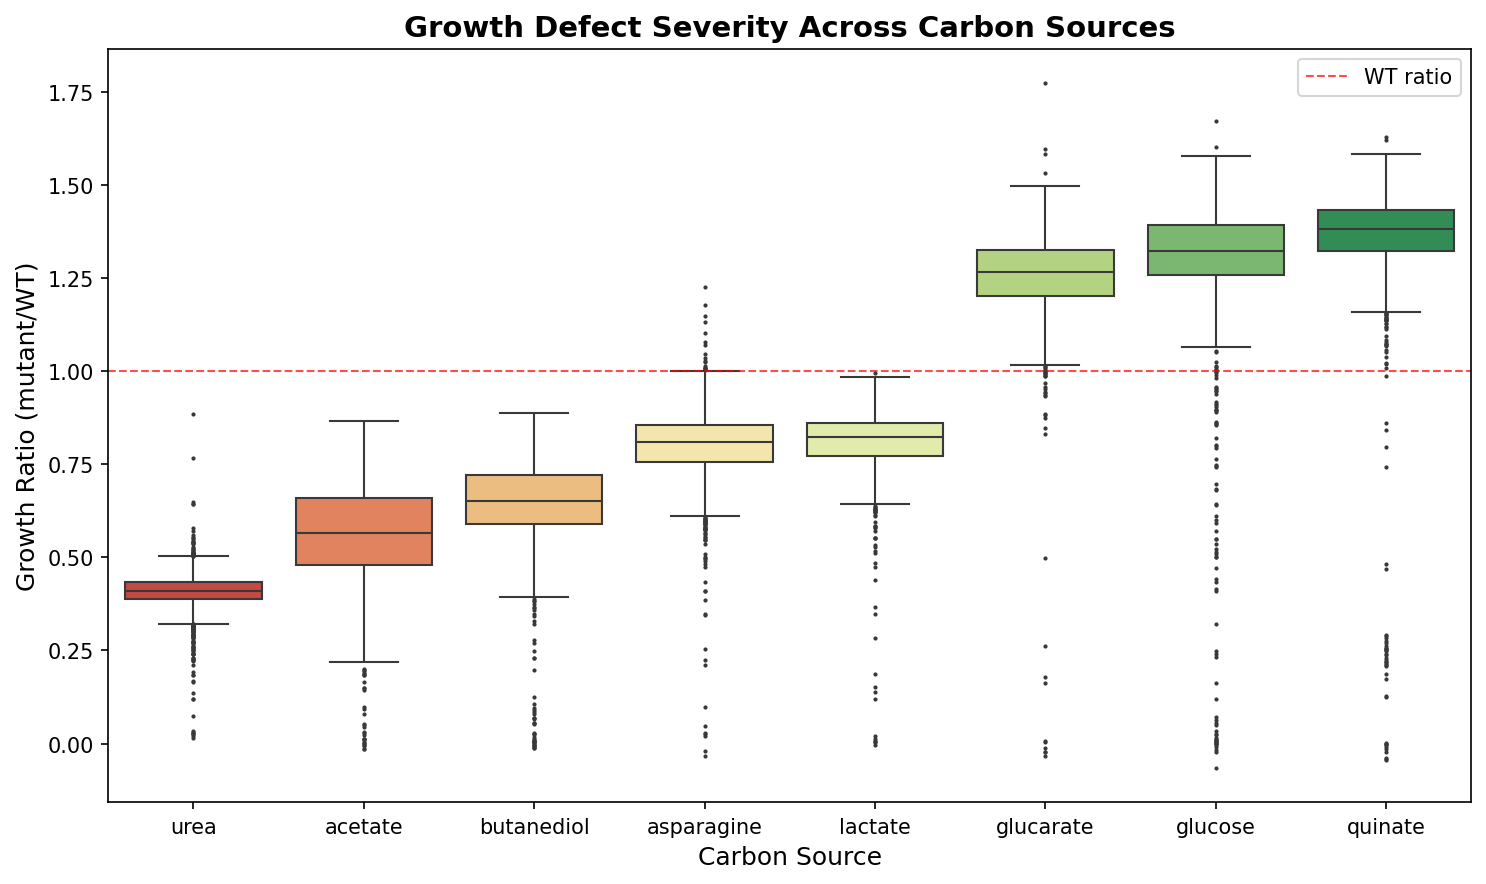
| Tier | Conditions | Mean growth ratio | % genes with defects (ratio < 0.8) |
|---|---|---|---|
| Demanding | Urea, Acetate, Butanediol | 0.41–0.65 | 95–100% |
| Moderate | Asparagine, Lactate | 0.80–0.82 | 37–45% |
| Robust | Glucarate, Glucose, Quinate | 1.25–1.36 | 0.5–2.4% |
(Notebook: 01_data_extraction.ipynb)
2. Conditions are largely independent — 5 PCs capture 82% of variance
PCA of the 2,034×8 growth matrix reveals that 5 principal components are needed to capture 82% of the variance. PC1 (36.7%) represents general growth sensitivity — all conditions load positively. PC2 (12.7%) isolates urea (loading = +0.75), separating nitrogen metabolism from carbon metabolism. The remaining PCs distinguish specific carbon source pairs.
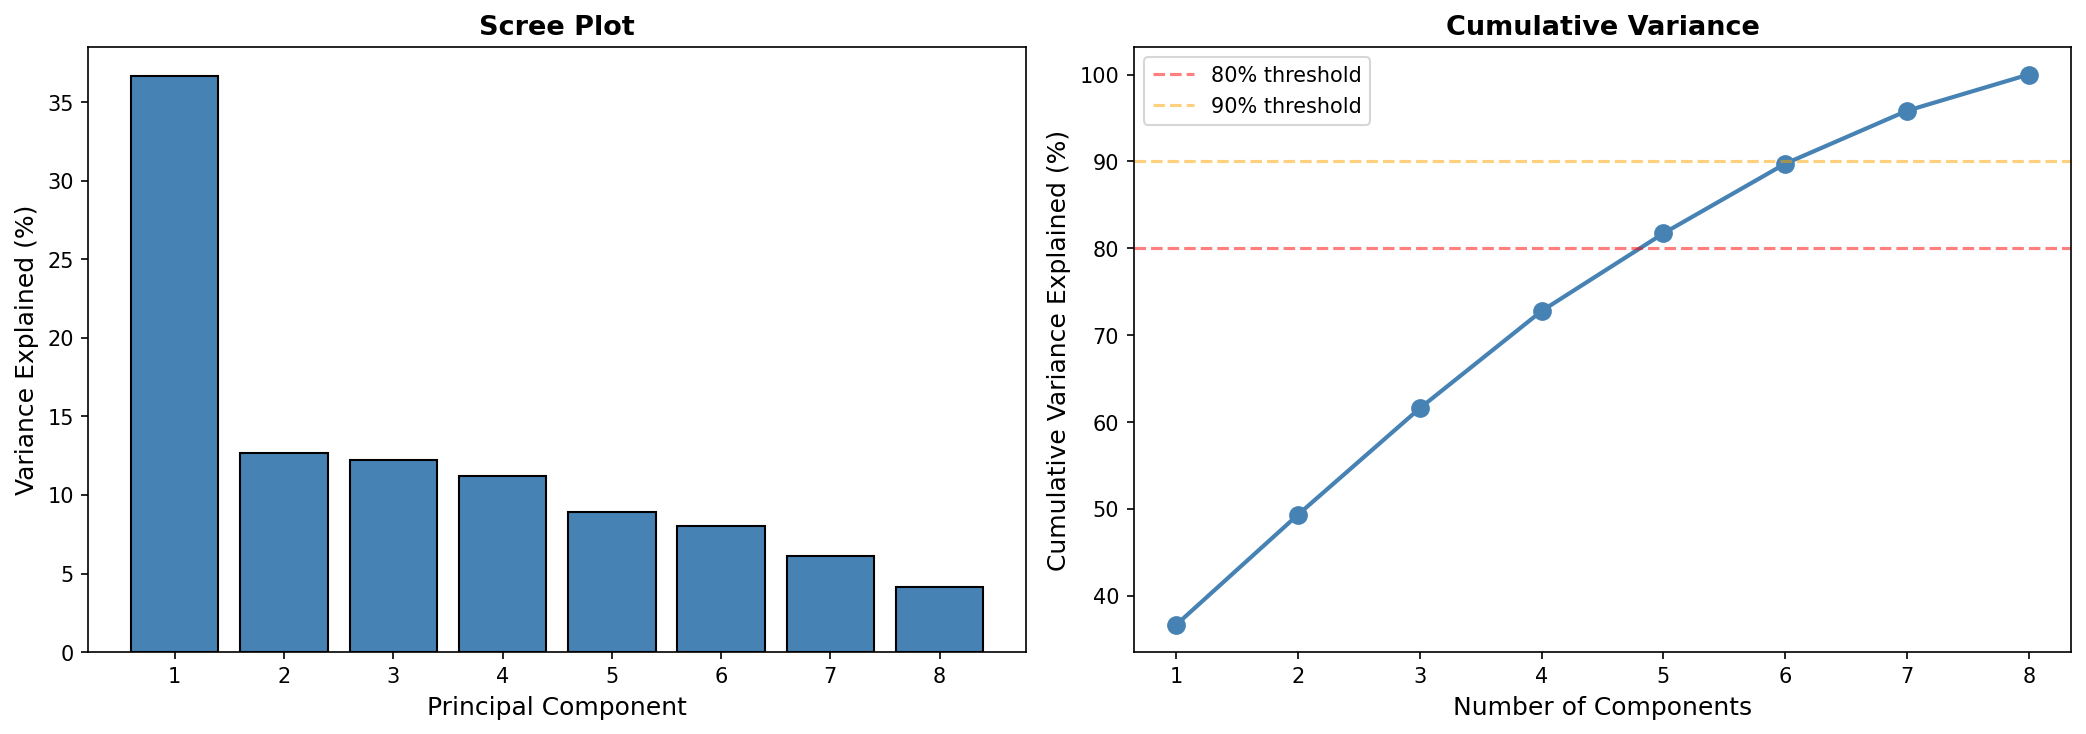
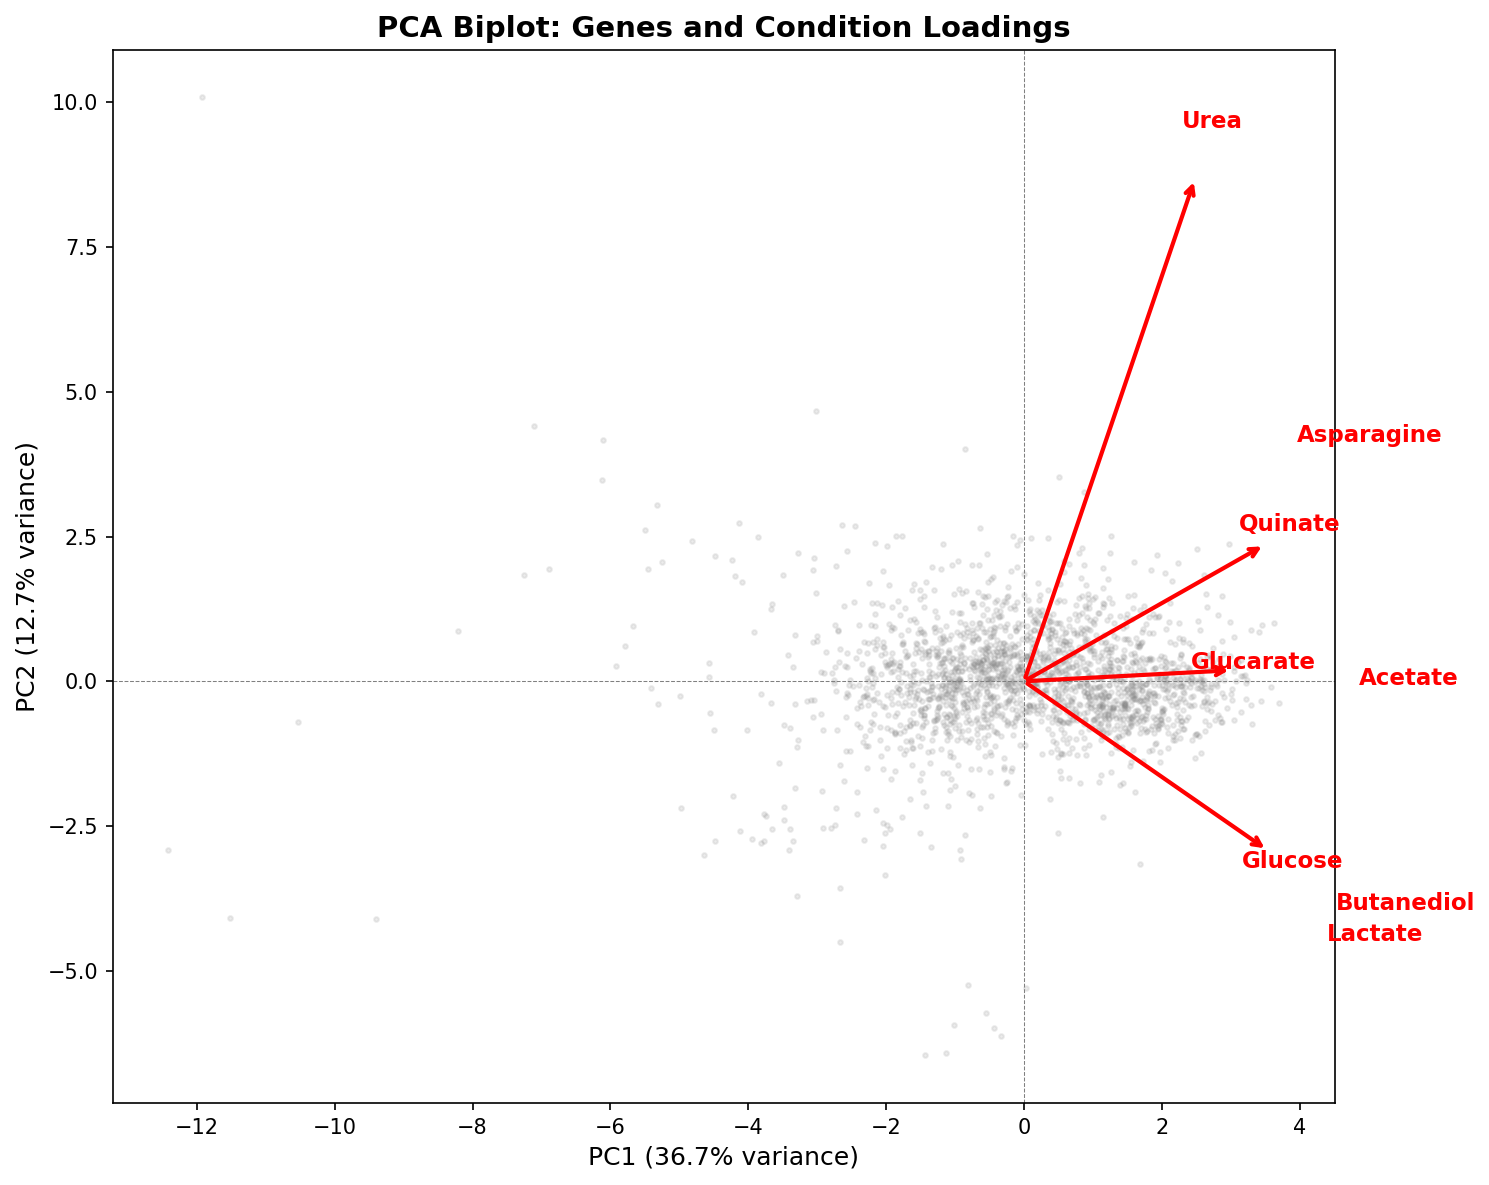
Pairwise Pearson correlations between conditions are moderate at best (highest: acetate–butanediol, r = 0.58; median across all 28 pairs: r = 0.25). This means the 8 conditions provide approximately 5 independent dimensions of phenotypic information — far more than the 2-group (demanding vs robust) model would suggest.
(Notebook: 02_condition_structure.ipynb)
3. The phenotype landscape is a continuum, not discrete modules
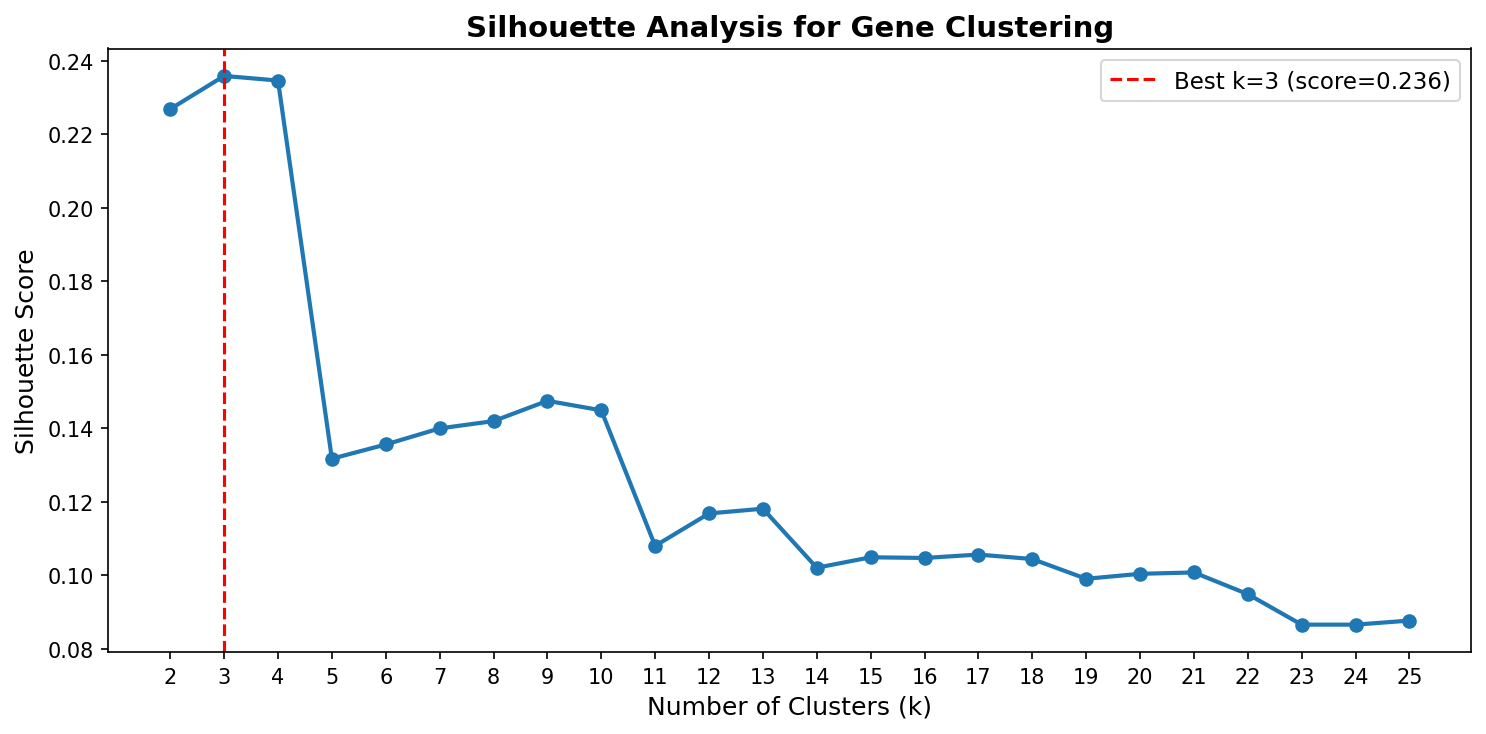
Hierarchical clustering of genes by their 8-condition growth profiles produces an optimal K = 3 with a low silhouette score (0.24). The two large modules (1,160 and 850 genes) represent broad "generally sensitive" vs "generally tolerant" groups without any specific functional enrichment surviving FDR correction. This indicates that gene essentiality varies continuously across conditions rather than falling into discrete functional categories.
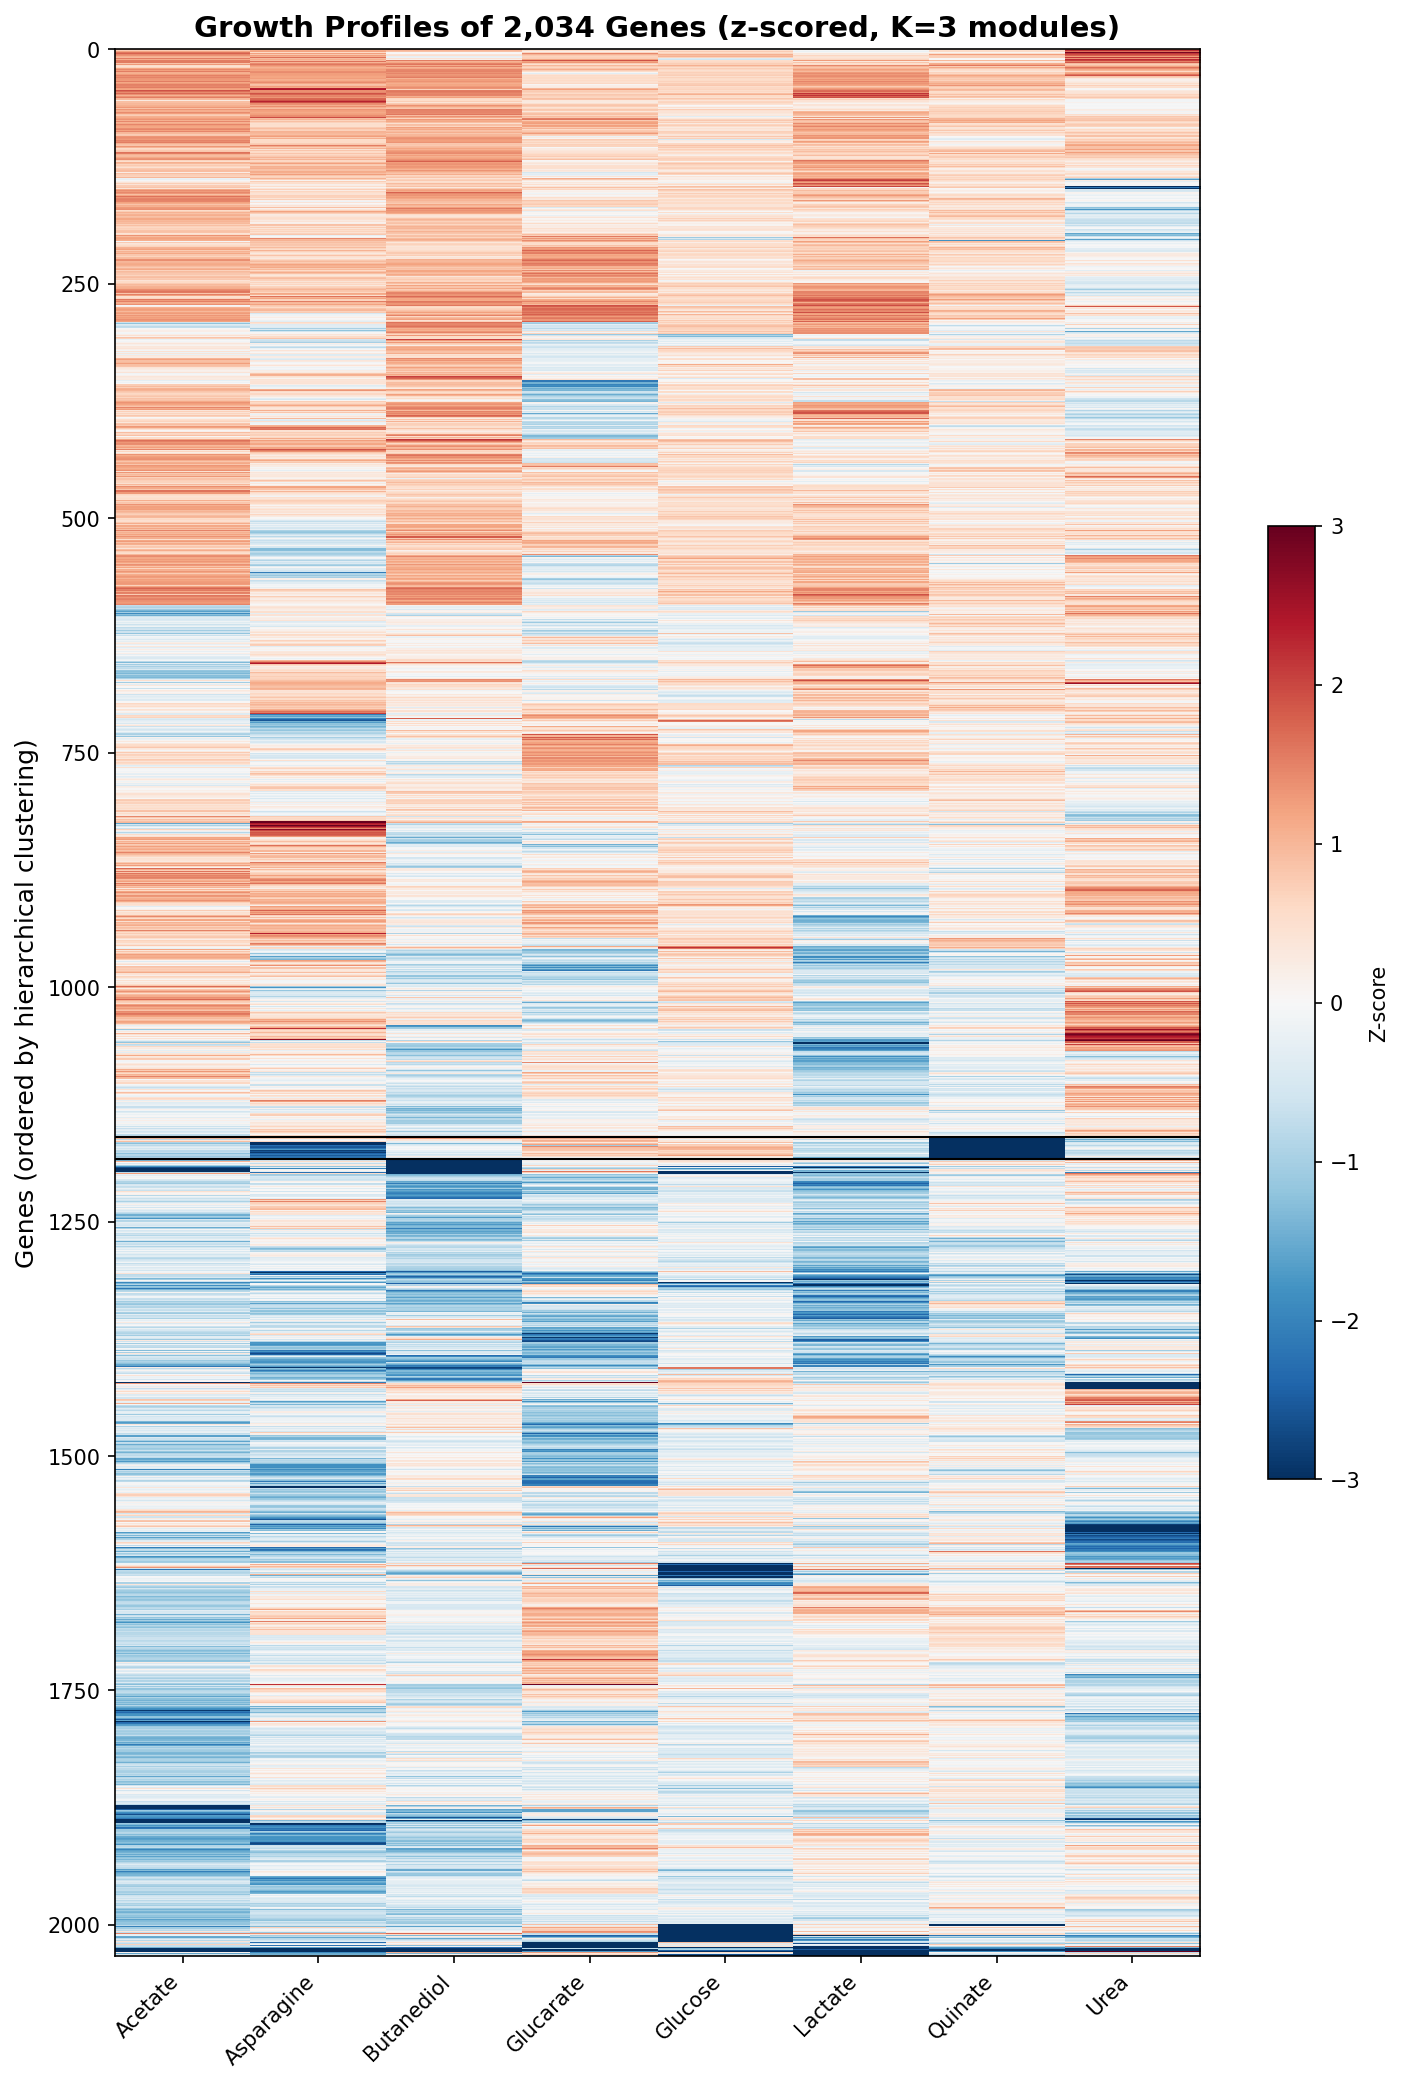
The one exception is a small module of 24 genes with extreme quinate-specific defects (mean z-score = -7.28 on quinate, near-zero on other conditions). These are the aromatic degradation pathway genes, which form the only discrete phenotypic module in the dataset.
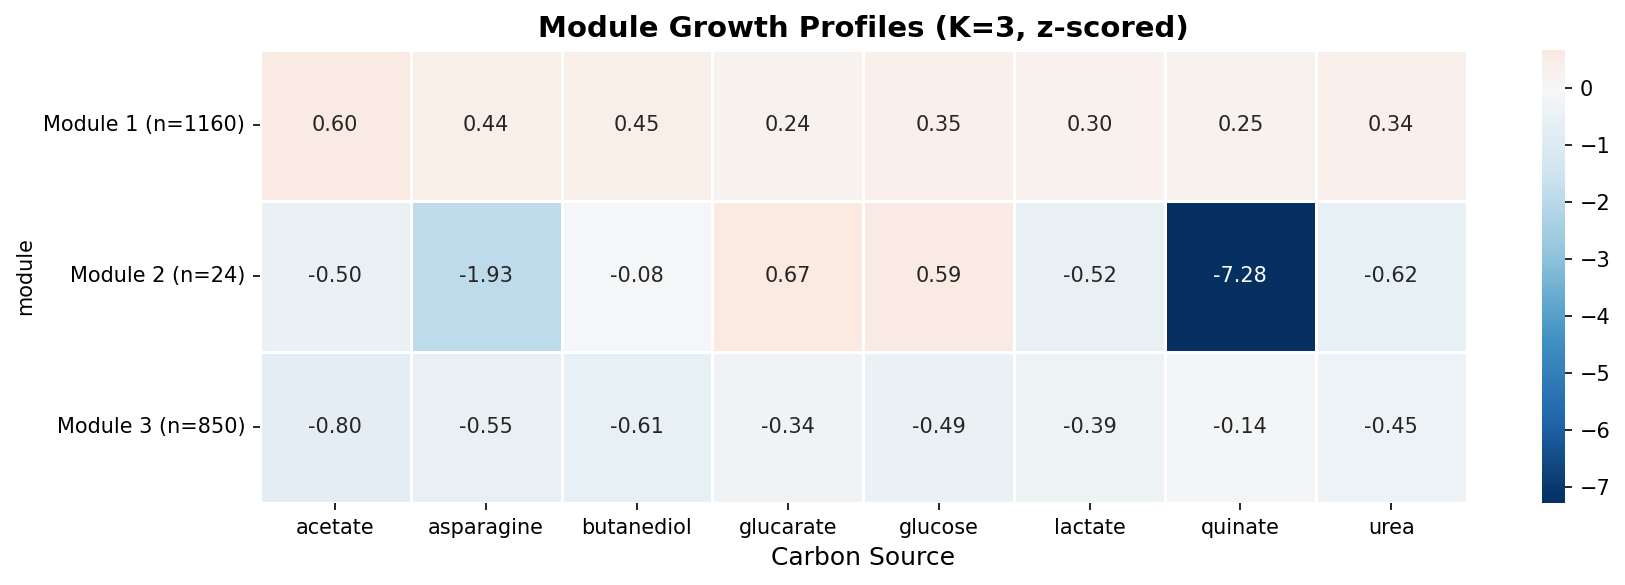
(Notebook: 03_gene_modules.ipynb)
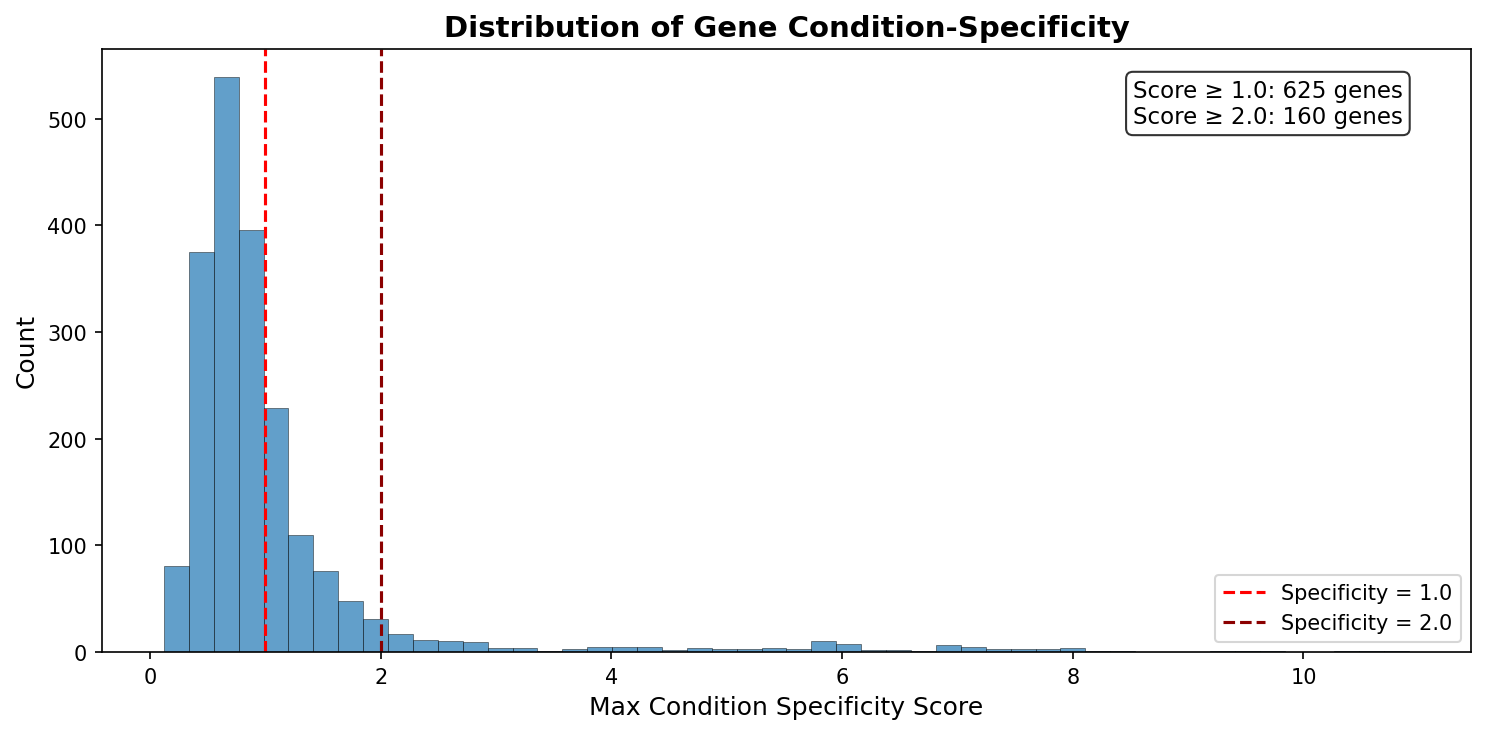
4. Condition-specific genes reveal the metabolic architecture of ADP1
625 genes (31%) have a condition specificity score ≥ 1.0, meaning their growth importance is concentrated on one carbon source. The top condition-specific genes for each carbon source correspond precisely to the expected metabolic pathways:
| Condition | Top specific genes | Pathway |
|---|---|---|
| Quinate | pcaC, pcaG, pcaH, pcaB, quiA, quiB, pqqC, pqqD | Protocatechuate/quinate degradation + PQQ biosynthesis |
| Urea | ureA, ureB, ureC, ureD, ureE, ureF, ureG | Urease complex (all 7 subunits/accessory proteins) |
| Asparagine | aspartate ammonia-lyase, L-asparaginase | Asparagine catabolism |
| Acetate | fadB, malate synthase G, citB | Fatty acid β-oxidation + glyoxylate shunt |
| Glucarate | gudD, D-glucarate transporter, 2,5-dioxovalerate dehydrogenase | Glucarate degradation |
| Glucose | eda, gntT, gluconokinase, glucose dehydrogenase (PQQ) | Entner-Doudoroff pathway + PQQ-glucose dehydrogenase |
| Butanediol | 2,3-butanediol dehydrogenase, E2 acetyltransferase | Butanediol catabolism + acetoin pathway |
| Lactate | lldR, cyoC/cyoD | Lactate regulation + cytochrome oxidase |
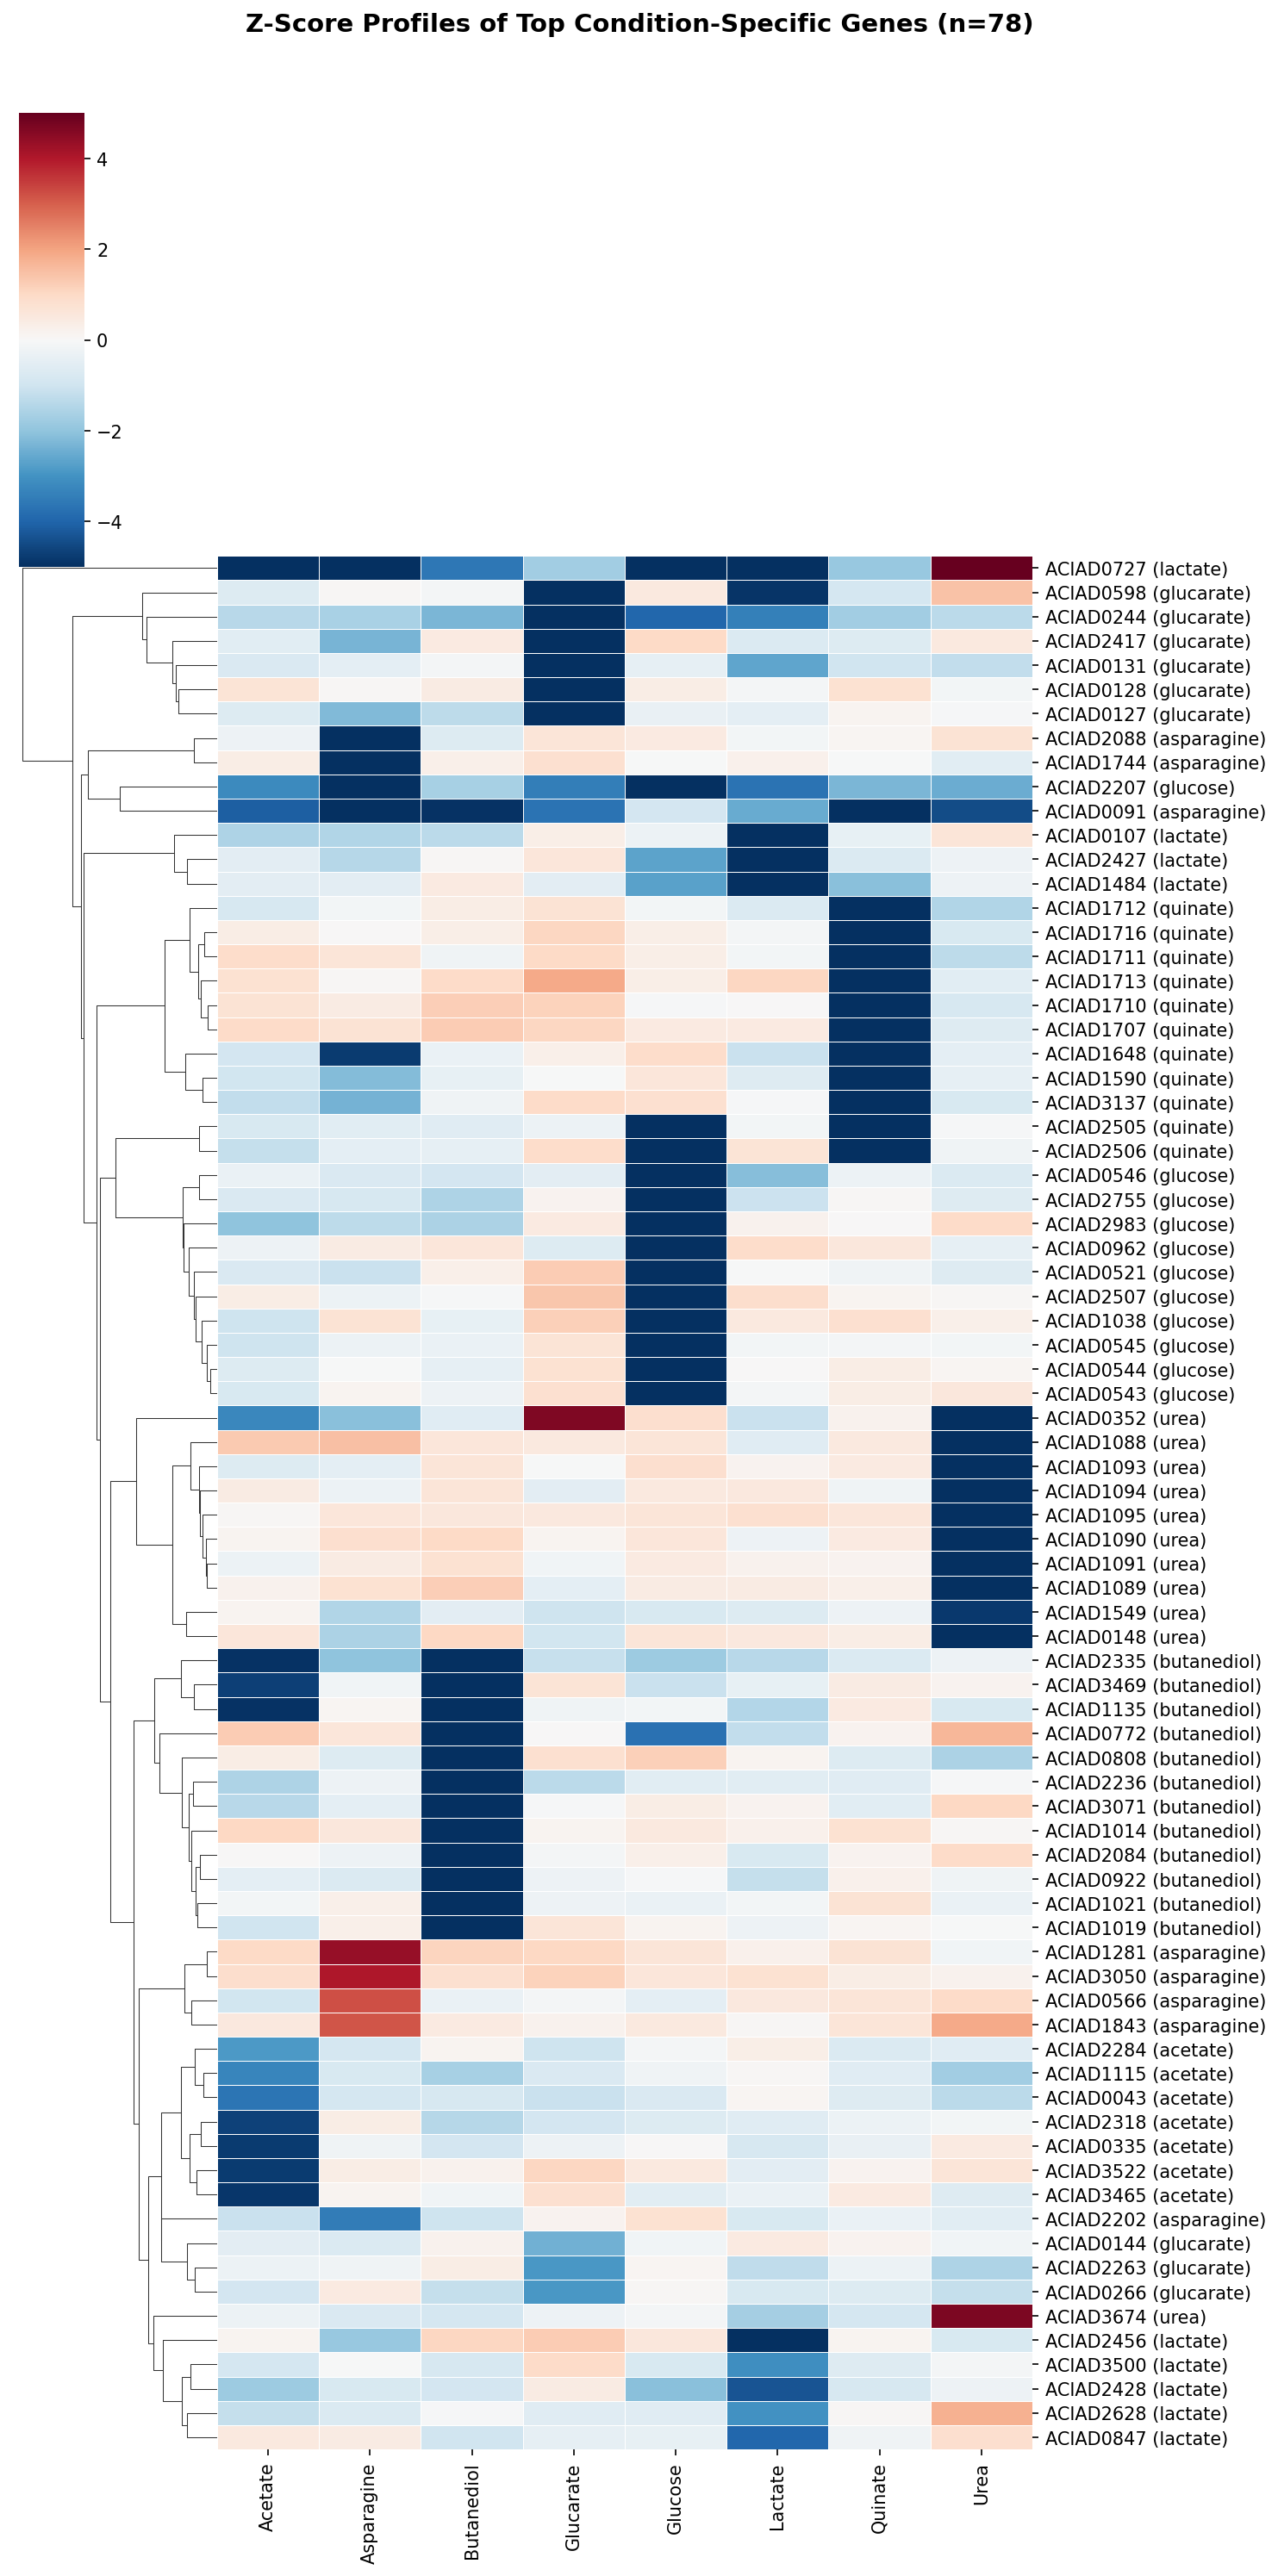
The quinate-specific gene set (51 genes at spec > 0.5, z < -1) extends beyond the core degradation pathway to include NADH-ubiquinone oxidoreductase subunits (Complex I), suggesting that aromatic catabolism places unique demands on the electron transport chain. PQQ biosynthesis genes appear as condition-specific for both quinate and glucose, consistent with PQQ-dependent dehydrogenases catalyzing the first step of both pathways.
(Notebook: 04_condition_specific.ipynb)
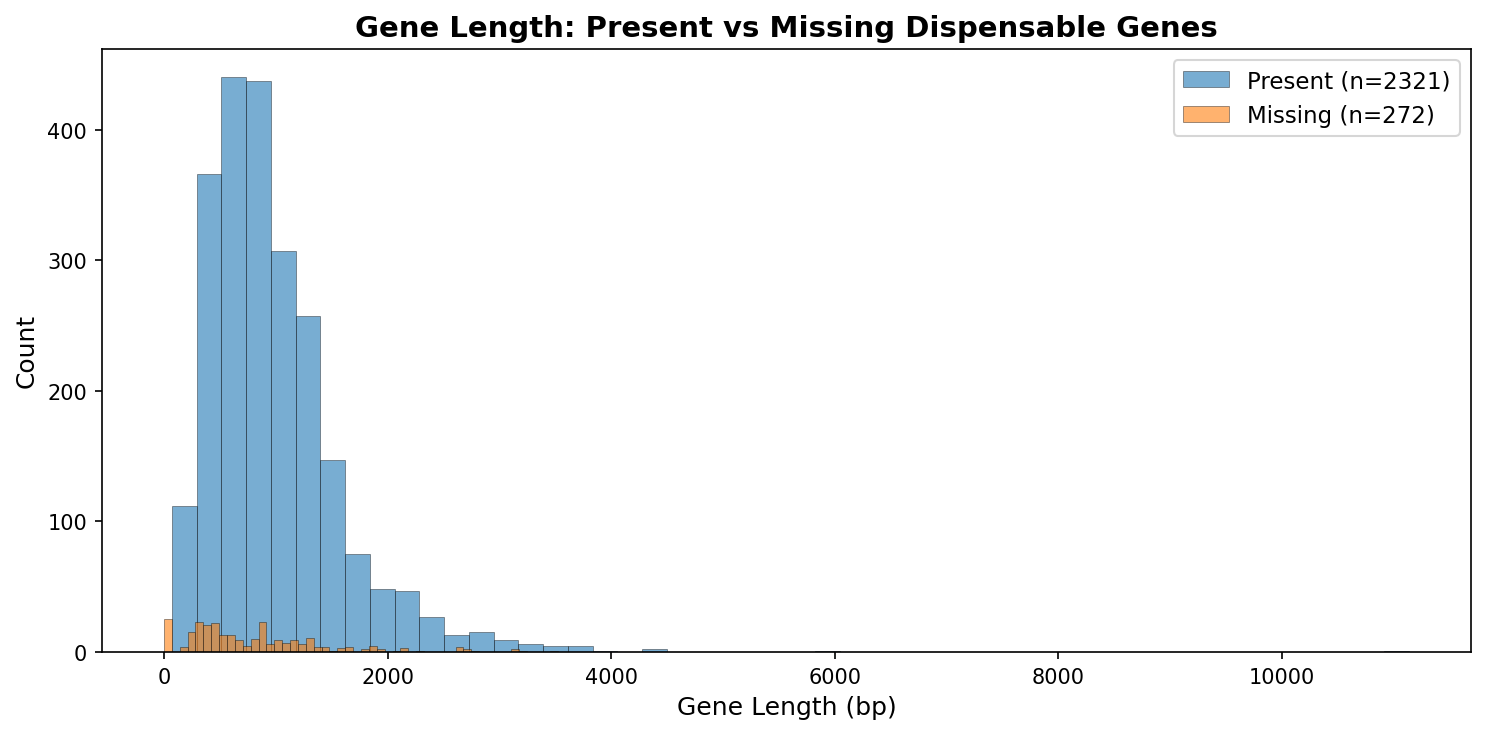
5. Missing dispensable genes are shorter, less conserved, and enriched for hypotheticals
Of 2,593 TnSeq-dispensable genes, 272 (10.5%) lack growth data from the deletion collection. These missing genes are systematically different from the 2,321 present dispensable genes:
| Property | Present (n=2,321) | Missing (n=272) | Significance |
|---|---|---|---|
| Mean length | 981 bp | 813 bp | Shorter |
| RAST annotated | 100% | 91% | Less annotated |
| KO annotated | 59% | 49% | Less annotated |
| Pangenome core | 93.3% | 76.5% | Less conserved (p = 1.4×10⁻²⁰) |
Hypothetical proteins are massively enriched among missing genes (25 completely unannotated, q = 2.4×10⁻²⁵; 48 annotated as "hypothetical protein", q = 3.0×10⁻⁴). The 313 uncertain-class genes are even more distinctive: 361 bp mean length, 42% annotated, 31% core — consistent with gene fragments or pseudogenes rather than true essential genes.
(Notebook: 05_tnseq_gap.ipynb)
Results
Growth Matrix Structure
The complete growth matrix consists of 2,034 genes with growth ratio measurements on all 8 carbon sources. Growth ratios represent mutant/wild-type ratios, where values < 1.0 indicate growth defects and values > 1.0 indicate no defect (or slight growth advantage due to experimental normalization). The conditions span a 3.3-fold range in mean growth ratio (0.41 for urea to 1.36 for quinate).
Condition Independence
The low pairwise correlations (median Pearson r = 0.25, maximum r = 0.58) demonstrate that each carbon source imposes a largely independent set of gene requirements. The PCA confirms this: no single component captures more than 37% of variance, and 5 components are needed for 82%. This contrasts with chemical genomics studies in E. coli (Nichols et al. 2011) where many conditions produce correlated fitness profiles. The difference likely reflects the diversity of metabolic entry points represented by these carbon sources — each enters central metabolism at a different point.
Module Structure vs Gradient
The low silhouette score (0.24) across all tested k values (2–25) indicates that the phenotypic landscape lacks natural cluster boundaries. Most genes vary gradually in their condition sensitivity rather than falling into discrete response groups. This is consistent with Guzman et al. (2018)'s proposal that essentiality is a continuous variable — our data shows this continuity manifests as a gradient across conditions, not as discrete functional modules.
Interpretation
Literature Context
-
The condition-specificity of the quinate/protocatechuate degradation pathway genes aligns with Fischer et al. (2008), who showed that ADP1's aromatic degradation operons are coordinately regulated and carbon-source-dependent. Our specificity scores quantify this coordinate regulation genome-wide.
-
The finding that gene essentiality is condition-dependent and continuous supports the "adaptive flexibility" framework of Guzman et al. (2018), who argued that binary essential/non-essential classifications miss condition-dependent effects. Our 625 condition-specific genes (31% of the complete matrix) demonstrate that nearly one-third of the dispensable genome has condition-specific importance.
-
Nichols et al. (2011) found that chemical-genetic profiles in E. coli define "phenotypic modules" extending beyond operon boundaries. We do NOT find discrete modules in ADP1 — only a continuous gradient with one exception (the 24-gene quinate module). This may reflect differences between single-gene deletions (this study) and chemical perturbations (Nichols et al.), or may indicate that ADP1's metabolic architecture is more interconnected than E. coli's.
-
Wetmore et al. (2015) demonstrated that RB-TnSeq across diverse conditions identifies condition-specific gene functions. Our analysis uses single-gene deletions rather than TnSeq, but reaches the same conclusion: condition-specific phenotyping dramatically increases the functional annotation yield. The 625 condition-specific genes include many with known functions that would not be detected on a single carbon source.
-
Rosconi et al. (2022) showed that bacterial pangenome variation makes gene essentiality strain-dependent and evolvable. Our finding that the 272 missing dispensable genes are less conserved (76.5% core vs 93.3%) connects condition-dependent essentiality to pangenome dynamics — the least conserved genes are also the ones most likely to be missed by deletion collection construction.
Novel Contribution
The BERDL-integrated analysis adds three insights not available from the original de Berardinis et al. (2008) data:
-
Quantitative condition independence: The PCA and correlation analysis show that the 8 conditions provide ~5 independent dimensions of phenotypic information, substantially more than the binary demanding/robust classification would suggest.
-
Gradient vs module architecture: The failure of clustering to find discrete functional modules (silhouette = 0.24, no enrichments survive FDR) is itself informative — it means the phenotype landscape is a continuum. The quinate degradation pathway is the sole exception, forming the only discrete phenotypic module.
-
Pangenome context for the coverage gap: By cross-referencing with BERDL pangenome data, we show that the 272 missing dispensable genes are significantly less conserved across Acinetobacter species, suggesting that gene dispensability and pangenome status are linked through evolutionary retention pressure.
Limitations
- Growth ratios are single-timepoint measurements with unknown technical noise. The condition specificity analysis assumes that variation across conditions reflects biology, not measurement error.
- The complete matrix (2,034 genes) excludes essential genes (499) and genes with incomplete data (316), biasing toward dispensable genes with successful deletion mutants.
- Only 8 carbon sources were tested. The ~5 independent dimensions may increase with more conditions.
- The pangenome core/accessory status comes from BERDL's species-level pangenome for A. baylyi, which may have limited resolution compared to a population-level analysis.
Future Directions
- Higher-resolution clustering: Apply independent component analysis (ICA) instead of hierarchical clustering to extract condition-specific signals from the gradient landscape. ICA may find latent factors that hierarchical clustering misses.
- Cross-species comparison: Compare ADP1 condition specificity profiles with RB-TnSeq data from the Fitness Browser for organisms grown on overlapping carbon sources (e.g., glucose, lactate). Are the same functional pathways condition-specific across species?
- Regulatory network inference: Use the condition-specific gene sets to infer regulatory relationships — genes that are co-specific for a condition may share transcriptional regulators.
- Expanded condition panel: The ~5 independent dimensions from 8 conditions suggests that additional carbon sources, nitrogen sources, or stress conditions would substantially increase the phenotypic resolution.
Data
Sources
| Collection | Tables Used | Purpose |
|---|---|---|
User-provided SQLite (berdl_tables.db) |
genome_features |
Growth ratios, TnSeq essentiality, functional annotations for 5,852 ADP1 genes |
kbase_ke_pangenome |
Pangenome cluster IDs and core/accessory status | Cross-referenced via pangenome_cluster_id column in genome_features |
Generated Data
| File | Rows | Description |
|---|---|---|
data/growth_matrix_complete.csv |
2,034 | Genes with growth data on all 8 conditions |
data/growth_matrix_all.csv |
2,350 | Genes with growth data on any condition |
data/all_genes_annotated.csv |
5,852 | All genes with annotations and TnSeq classification |
data/gene_modules.csv |
2,034 | Gene-to-module assignments (K=3) |
data/module_enrichment.csv |
0 | No significant enrichments after FDR correction |
data/condition_specific_genes.csv |
2,034 | Genes with per-condition specificity scores |
data/tnseq_gap_analysis.csv |
3,405 | TnSeq genes with gap classification |
References
- de Berardinis V et al. (2008). "A complete collection of single-gene deletion mutants of Acinetobacter baylyi ADP1." Molecular Systems Biology 4:174. PMID: 18319726
- Durot M et al. (2008). "Genome-scale models of bacterial metabolism: reconstruction and applications." FEMS Microbiology Reviews 33(1):164-190.
- Fischer R et al. (2008). "Catabolite repression of aromatic compound degradation in Acinetobacter baylyi." Journal of Bacteriology 190(5):1759-1767.
- Guzman GI et al. (2018). "Reframing gene essentiality in terms of adaptive flexibility." BMC Systems Biology 12(1):143.
- Nichols RJ et al. (2011). "Phenotypic landscape of a bacterial cell." Cell 144(1):13-24.
- Rosconi F et al. (2022). "A bacterial pan-genome makes gene essentiality strain-dependent and evolvable." Nature Microbiology 7:1580-1592.
- Stuani L et al. (2014). "Novel metabolic features in Acinetobacter baylyi ADP1 revealed by a multiomics approach." Metabolomics 10(6):1223-1238. PMID: 25374488
- Wetmore KM et al. (2015). "Rapid quantification of mutant fitness in diverse bacteria by sequencing randomly bar-coded transposons." mBio 6(3):e00306-15. PMID: 25968644
Discoveries
31% of dispensable genes have condition-specificity scores ≥ 1.0. Top condition-specific genes for each carbon source are the enzymes biochemically predicted to be required: urease subunits for urea, protocatechuate 3,4-dioxygenase for quinate, Entner-Doudoroff enzymes for glucose, glyoxylate shunt
Read more →Hierarchical clustering of 2,034 genes by their 8-condition growth profiles produces an optimal K=3 with silhouette=0.24 — no discrete functional modules. The phenotype landscape is a gradient, with one exception: 24 genes form a tight quinate-specific module (the aromatic degradation pathway). Gene
Read more →Of 2,593 TnSeq-dispensable genes, 272 (10.5%) lack growth data from the deletion collection. These are systematically different: shorter (813 vs 981 bp), less annotated (91% vs 100% RAST), and less conserved in the pangenome (76.5% core vs 93.3%, p=1.4e-20). Hypothetical proteins are massively enric
Read more →Data Collections
Review
Summary
This is a well-executed phenotype-first analysis of the Acinetobacter baylyi ADP1 single-gene deletion collection across 8 carbon sources. The project is mature and complete: all five notebooks have saved outputs with figures, the three-file documentation structure (README, RESEARCH_PLAN, REPORT) is properly used, and conclusions are well-supported by the data shown. The strongest results are the condition-specificity analysis (NB04), which maps top genes per carbon source to precisely the expected metabolic pathways, and the TnSeq gap analysis (NB05), which reveals that missing dispensable genes are shorter, less conserved, and enriched for hypotheticals. The main area for improvement is the gene module analysis (NB03), where hierarchical clustering with K=3 produces two oversized modules (1,160 and 850 genes) that are too large to yield functional enrichments — the project correctly reports this negative result but could explore alternative decomposition methods mentioned in the research plan.
Methodology
Research question: Clearly stated and testable. The hypothesis (H0 vs H1) is well-framed, and the four aims are logically structured from broad (condition structure) to specific (TnSeq gaps).
Approach: Sound overall. The decision to exclude FBA predictions is well-justified by the prior project's finding (p=0.63). Z-score normalization per condition before clustering and PCA is appropriate given the 3.3-fold range in mean growth ratios across conditions. The condition specificity score (|z_i| - mean(|z_j|) for j != i) is a reasonable and interpretable metric.
Data sources: Clearly identified — a user-provided SQLite database (136 MB) with cross-references to BERDL pangenome data. The symlink dependency on projects/acinetobacter_adp1_explorer/user_data/ is documented but could be fragile for reproduction by others.
Statistical rigor: Benjamini-Hochberg FDR correction is applied consistently across all enrichment analyses (NB03 RAST/PFAM enrichment, NB05 gap functional enrichment). Fisher's exact test is appropriate for the contingency tables used. The chi-squared test for pangenome core status (p=1.4e-20) is correctly applied to a 2x2 table with adequate cell counts.
Reproducibility: The README includes a clear ## Reproduction section with exact nbconvert commands. All notebooks run locally (no Spark required), which is explicitly documented. The requirements.txt lists all Python dependencies with minimum versions.
Minor concern: The RESEARCH_PLAN (Aim 4) estimated "370 dispensable genes" lacking growth data, but the actual analysis found 272. This is expected for a pre-analysis estimate, and the correct number is used throughout the notebooks and REPORT. However, the RESEARCH_PLAN was not updated to reflect the actual count.
Code Quality
Notebook organization: All five notebooks follow a consistent structure: markdown header with goal/inputs/outputs, numbered sections, inline interpretation, and a summary cell at the end. This makes each notebook self-contained and easy to follow.
SQL queries: The SQLite queries in NB01 are straightforward SELECT statements on the genome_features table. No performance issues expected given the small table size (~5,852 rows).
Statistical methods:
- PCA implementation (NB02) is correct: StandardScaler followed by full PCA with variance reporting.
- Hierarchical clustering uses Ward's method with Euclidean distance on z-scores (NB03), which is the appropriate pairing. However, the condition dendrogram in NB02 uses Ward's method on 1 - |Pearson correlation| distance, which is technically non-Euclidean. Ward's method assumes Euclidean distance; using it on correlation-based distances can produce suboptimal merges. In practice the results here appear reasonable, but this is a methodological imprecision worth noting.
- The silhouette analysis (NB03, cell 6) tests K=2 through K=25, which is thorough for 2,034 genes.
Pitfall awareness: The project addresses several relevant pitfalls from docs/pitfalls.md:
- Uses pd.notna() checks before string operations on annotation columns (addressed in RESEARCH_PLAN and code).
- Correctly handles NaN in pangenome_is_core with .fillna(False).astype(bool) (NB05, cell 10).
- No Spark-related pitfalls apply since all analysis is local SQLite + pandas.
- The fillna(False).astype(bool) pattern in NB05 correctly avoids the object-dtype boolean pitfall documented in docs/pitfalls.md.
Code issues:
1. In NB03 (cell 14), rast_clean splits on ' / ' to take the first function, which is a reasonable heuristic but discards multi-function annotations. The threshold of >=5 genes for testable functions reduces the number of testable categories to only 19 out of 1,446 RAST categories. With module sizes of 1,160 and 850, even real enrichments would be diluted below detection. This is a design limitation, not a bug.
2. In NB03 (cell 17), PFAM parsing assumes comma-separated domains but only produces 2,012 gene-domain pairs for 2,012 genes — exactly 1 domain per gene. This suggests the PFAM column may not actually contain multi-domain entries, or the parsing is capturing only the first match. Worth verifying.
3. In NB05 (cell 5), the markdown header says "370 dispensable genes" but the analysis correctly finds 272. The markdown text should be updated for consistency.
Findings Assessment
Conclusions supported by data: Yes, comprehensively. Each key finding is directly traceable to specific notebook outputs:
- The three-tier condition structure (Finding 1) is supported by the box plots and defect fraction tables in NB01.
- The ~5 independent dimensions (Finding 2) follows directly from the PCA scree plot showing 5 PCs for 82% variance.
- The continuum vs module conclusion (Finding 3) is well-supported by the low silhouette score (0.24) and absence of enrichments after FDR.
- The condition-specific gene lists (Finding 4) are biologically compelling — urease subunits for urea, protocatechuate degradation for quinate, Entner-Doudoroff for glucose.
- The TnSeq gap characterization (Finding 5) is quantitative and statistically supported (chi-squared p=1.4e-20 for core status difference).
Limitations acknowledged: Yes, four substantive limitations are listed in the REPORT, covering measurement noise, ascertainment bias, condition panel size, and pangenome resolution. These are appropriate and honest.
Incomplete analysis: The RESEARCH_PLAN mentioned NMF decomposition as an alternative to hierarchical clustering (Aim 2), but this was not attempted. Given that hierarchical clustering produced uninformative modules, trying NMF or ICA (mentioned in Future Directions) would strengthen the negative finding or potentially reveal latent structure. The REPORT's Future Directions section appropriately flags ICA as a next step.
Visualizations: All 15 figures are properly labeled with titles, axis labels, and legends. The figures span all analysis stages (exploration: growth distributions/boxplots; analysis: PCA/correlation/clustering; results: condition-specific heatmap; validation: TnSeq gap plots). The clustermap in NB02 and condition-specific heatmap in NB04 are particularly effective.
Suggestions
-
Try ICA or NMF for gene module discovery (high impact). The hierarchical clustering with K=3 produces two mega-modules (1,160 and 850 genes) that are too diffuse for functional enrichment. ICA, as mentioned in Future Directions, could extract condition-specific latent factors from the growth matrix and would likely recover the quinate and urea signals as independent components. This would transform the "no modules found" result into a positive finding about the structure of the phenotype landscape.
-
Lower the enrichment threshold for RAST functions (medium impact). Testing only functions with >=5 genes in NB03 reduces testable categories from 1,446 to 19. With BH-FDR correction, a threshold of >=3 would still be statistically valid and would test many more categories. Alternatively, use broader functional categories (e.g., RAST subsystem level) rather than individual function strings, which would aggregate genes into larger functional groups more amenable to enrichment testing.
-
Update RESEARCH_PLAN with actual counts (low impact, documentation). The plan estimates 370 missing dispensable genes and 1,179 total TnSeq genes without growth data, but the actual numbers are 272 and 1,081. While the revision history notes reviewer feedback was addressed, the gene counts in Aim 4 were not corrected. Similarly, NB05 cell 5 markdown still says "370 dispensable genes."
-
Verify PFAM multi-domain parsing (low impact, correctness). NB03 cell 17 reports exactly 2,012 gene-domain pairs for 2,012 genes with PFAM annotations, suggesting each gene has exactly one domain entry. If the PFAM column contains multi-domain annotations (e.g., "PF00106,PF03466"), the comma-split logic should produce more pairs. Verify whether PFAM entries are genuinely single-domain or if the parsing needs adjustment.
-
Document the SQLite database provenance more explicitly (low impact, reproducibility). The database is described as "symlinked from
projects/acinetobacter_adp1_explorer/user_data/" but its original construction method is not documented in this project. A sentence in the README noting howberdl_tables.dbwas built (which BERDL tables were exported, what processing was done) would help someone reproduce the full pipeline from scratch. -
Add a Mann-Whitney U test for gene length comparison (nice-to-have). NB05 reports mean/median gene lengths for present vs missing dispensable genes but does not include a formal statistical test for the length difference. Adding a Wilcoxon rank-sum test would complement the chi-squared test already done for pangenome core status.
This review was generated by an AI system. It should be treated as advisory input, not a definitive assessment.
Visualizations
Condition Boxplots
Condition Clustermap
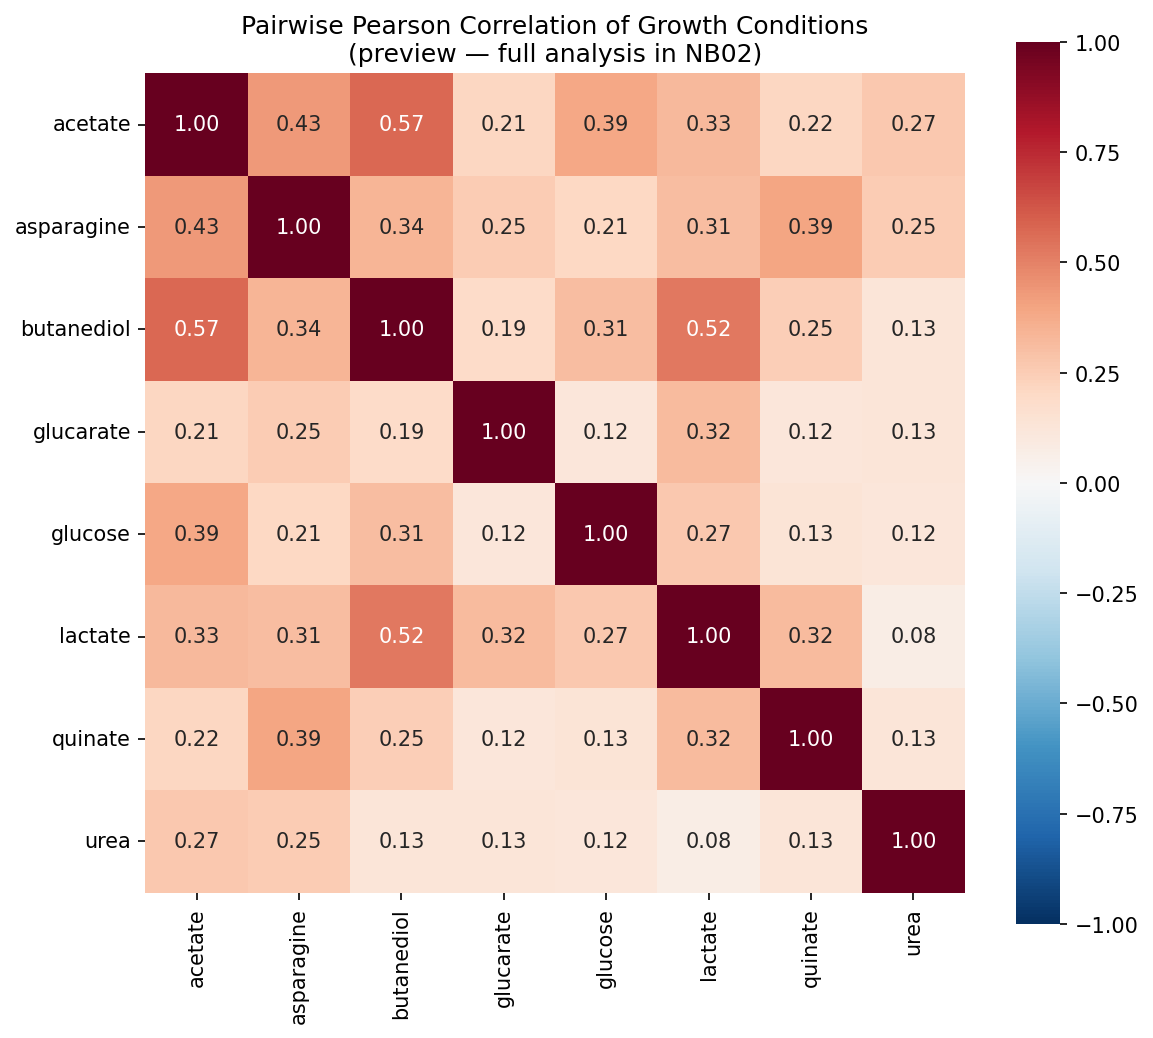
Condition Correlation Preview
Condition Correlations
Condition Dendrogram
Condition Specific Heatmap
Gene Heatmap
Growth Distributions
Missing Gene Length
Module Profiles
Pca Biplot
Pca Variance
Silhouette Analysis
Specificity Distribution
Tnseq Gap Coverage
Notebooks
01_data_extraction.ipynb
01 Data Extraction
View notebook →
02_condition_structure.ipynb
02 Condition Structure
View notebook →
03_gene_modules.ipynb
03 Gene Modules
View notebook →
04_condition_specific.ipynb
04 Condition Specific
View notebook →
05_tnseq_gap.ipynb
05 Tnseq Gap
View notebook →